http://dx.doi.org/10.7585/kjps.2013.17.4.283
Open Access
283
전국 농경지 토양 중 농약 잔류량 모니터링 및 연차별 변화
박병준*·이병무
1·김찬섭·박경훈·박상원
2·권혜영·김진효·최근형·임성진 농촌진흥청 국립농업과학원 농산물안전성부,
1국립한경대학교,
2농촌진흥청 연구정책국
Long-term Monitoring of Pesticide Residues in Arable Soils in Korea
Byung-Jun Park *, Byeong-Moo Lee
1, Chan-Sub Kim, Kyung-Hun Park, Jin-Hyo Kim, Hyeyoung Kwon, Sang-Won Park
2, Geun-Hyoung Choi and Sung-Jin Lim
Department of Agro-food Safety, National Academy of Agricultural Science, Rural Development Administration, Suwon, 441-707, Korea
1
Hankyong National University, Anseong, 456-749, Korea
2
Research Policy Planning Division, Research Policy Bureau, RDA, Suwon, 441-707, Korea (Received on November 12, 2013. Revised on November 20, 2013. Accepted on November 29, 2013)
Abstract A series of monitoring studies were carried out to evaluate the residue level of pesticides in different native soils from 1999 to 2006. The nation-wide collection of soil samples from paddy, greenhouse, upland and orchard, were analyzed by GLC (ECD or NPD) and GC/MS. The results obtained are summarized as follows; out of 14 pesticides detected from paddy soils in 1999, the highest residue level was 0.25 mg kg
−1, and the frequency was 21.7% as butachlor, 20.0% as isoprothiolane, and 16.7% as iprobenfos.
In 2003, 7 pesticides were detected and their frequencies were 0~36.0%; the frequency was 36.0% as isoprothiolane and 33.3% as oxadiazon. In the year 2000, 57 pesticides in the greenhouse soil samples were detected with the highest frequency of 65.3%. Of the pesticides detected, endosulfan and procymidone showed the frequency of 65.3 and 50.0%, respectively. In 2004, 19 pesticides were detected from greenhouse soils, and their frequencies and residue levels were decreased. Endosulfan and procymidone showed high detection frequencies and concentrations of 21.3 and 9.3% and 0.76 and 0.31 mg kg
−1, respectively. In 2001, a total of 25 pesticides were detected through monitoring in 170 upland soils and the highest residue level was 2.24 mg kg
−1. The detection frequencies showed the range of 0~53.5%. Especially, endosulfan showed the highest frequency of 53.5%. Residue levels and frequencies of pesticide in the year 2005 were almost the same compared with that of the year 2001. As a result of monitoring in 150 orchard soils in 2002, 26 pesticides were detected and the highest residue level was 1.43 mg kg
−1. Of them, the frequency of endosulfan showed the highest as 45.3%. In 2006, 20 pesticides were detected in orchard soils. The frequency of total endosulfan was the highest as 5.3% but was lower than that of the year 2002.
Key words Pesticide residue, monitoring, arable soils
서 론
작물재배시 병해충과 잡초를 방제하기 위하여 살포되는 농약은 작물체에 부착되고 일부는 대기 중으로 비산되나 대
부분이 토양에 투하된다. 농약잔류는 토양입자, 유기물, 토 양수분 등에 잔류하게 되며 작물체에 부착된 농약도 강우나 바람에 의해 이탈된 후 토양으로 이동되어 잔류된다. 특히, 작토층은 토양에 직접 처리되는 입제농약과 직접 접촉되는 주요 장소인 동시에 분해 장소가 된다(Chen 등 1978; Deuel 등 1978; Imai 등 1984; Lynton 등 1996; Park 등 2005).
경작지 토양의 농약잔류 양상은 농약성분, 제형, 사용방법, 사용량, 살포시기, 토성 및 유기물의 함량 등에 따라 다르게
*Corresponding author
Tel: +82-31-290-0521, Fax: +82-31-290-0506 E-mail: [email protected]
ORIGINAL ARTICLES / RESIDUE
나타나게 된다. 토양에 유입된 농약은 광분해, 가수분해, 미 생물분해, 휘산, 식물체로서의 흡수 및 토양 하층으로의 용 탈 등 여러 가지 과정을 밟아 소실된다(Chen 등 1978;
Nicholls 등 1988; Park 등 2006; Park 등 2011). 따라서 농 경지에 잔류하는 농약성분은 작물에 흡수이행되거나 수분 등에 의해 수평 및 수직 이동되어 환경오염을 시킬 수 있어 재배환경보전과 안전농산물생산에 중요한 부분을 차지한다.
과거 국내의우리나라에서는 농경지 토양에 대한 잔류농약 의 체계적인 조사는 1982년에 처음으로 전국 농경지 토양에 대한 유기염소계 농약잔류실태가 보고되었다. 그 후에 농업 기술연구소에서 전국 논토양 중 유기염소계농약과 유기인계 농약의 잔류에 대하여 보고되었으며, 그 외에 지방자치 단 체별로 한정된 지역에서 조사된 바 있다. 또한 1995년부터 1998 년까지 토양정점 조사시 4년 1주기로 하여 논토양, 시 설재배지 토양, 밭토양, 과원토양에 대하여 잔류농약을 조사 하였다(Park등 1982; Suh 등, 1982; Lee 등, 1983 ).
본 조사는 환경농업육성법 제 11조에 따라 우리나라 농경 지 토양 중 농약잔류 실태를 파악하고 농업환경보존과 안전 한 농산물 생산의 기초자료를 위해 전국 주요 논토양(1999, 2003), 시설재배지토양(2000, 2004), 밭토양(2001, 2005), 과수원토양(2002, 2006)을 대상으로 등록되어 사용되고 있 는 약제는 물론 토양잔류 가능성이 큰 성분을 대상으로 농 약잔류량의 변동 추이를 조사하였다.
재료 및 방법
농약의 표준용액 조제와 시약
표준 용액 조제는 작물별 사용토록 등록된 농약 중 분석이 가능하고 잔류가능성이 높은 농약을 선정하였으며 기기분석 가능성, 추출, 각각 성분별 컬럼 머무름 시간(retention time) 을 확인한 후 조합하여 표준용액을 그룹별로 제조하였다.
분석에 사용된 유기용매 hexane, acetone, dichloromethane, acetonitrile, sodium sulfate anhydrous 등은 모두 잔류분석 용으로 사용하였고, sodium chloride는 증류수에 포화시킨
후, 포화 용액을 dichloromethane으로 세척하여 불순물을 제거한 후 분석에 이용하였다. 정제용 florisil은 Sigma Co.
(USA) 60~100 mesh 를 130
oC 에서 8시간 활성화시켜 사용하 였고, 여지는 Whatman NO. 6을 사용하였다.
회수율 및 검출한계 시험
토양 중 분석농약의 회수율과 검출한계의 시험은 2011년 동지에 발표된 박 등의 논문과 동일하게 수행하였다. 풍건 토양 50 g을 acetone에 녹인 살균제 36종, 살충제 63종 및 제초제 31종의 표준액 10 mg L
−1의 혼합액 1 mL를 토양에 처리하여 용매가 날아가도록 후드에서 1시간 방치한 후 0.2 N ammonium chloride 용액 30 mL를 가하여 토양을 팽 윤 시키고 acetone 100 mL로 2시간 동안 진탕추출하였다.
추출물을 흡인 여과하고 acetone 50 mL 정도로 토양 잔사 및 용기를 씻어 여과액과 합하였다. 추출여액에 포화식염수 50 mL, 증류수 500 mL를 가한 후 dichloromethane 100 mL (50 mL × 2회)로 추출한 후 sodium sulfate anhydrous층을 통과시켜 수분제거 후 유기용매 층을 감압 농축하고 hexane 10 mL 로 재용해하여 정제 과정에 사용하였다. 추출액 중 5 mL를 취하여 활성 florisil을 이용한 정제 방법에 따라 정제 후 수집된 용출분획을 감압 농축하고 재용해 하여 분석하였다.
정제는 칼럼크로마토그라피법을 이용하였다. 직경 1 cm 의 pyrex glass column 하단부를 탈지면으로 막고 130
oC 에 서 24시간 동안 활성화시킨 florisil 10 g을 가하여 충진하고 그위에 무수 Na2SO4를 1.5 cm 높이로 깔고 n-hexane 50 mL 를 흘려보낸 다음 hexane에 녹인 시료액을 loading 한 후 용매의 극성을 증가시켜가면서 분획별로 50 mL 용출시 켜 40
oC 에서 감압농축 후 n-hexane 5 mL로 재용해하여 GLC로 분석하였다. 분석대상 농약성분의 회수율은 70~
110% 수준으로 양호하였으며 정량한계(LOQ)는 0.001~
0.005 mg kg
−1수준이었다(Kim 등 2010; Park 등 2011).
시료채취 및 조제
토양시료는 논토양(1999, 2003년), 시설재배지토양(2000, Table 1. Number of sampling site by provinces and year for pesticide monitoring in Korea
Gyeon ggi
Gang won
Chung buk
Chung nam
Jeon buk
Jeon
nam Gyeongbuk Gyeongnam Jeju Total
1999 26 14 17 26 23 24 26 24 - 180
2000 7 - 22 32 19 15 21 54 - 170
2001 20 20 15 20 20 20 20 20 15 170
2002 12 6 15 16 6 14 39 22 20 150
2003 20 14 14 22 20 17 21 22 - 150
2004 5 - 20 30 18 15 18 44 - 150
2005 15 10 15 20 20 17 18 20 15 150
2006 12 6 15 16 6 17 39 22 20 150
2004 년), 밭토양(2001, 2005년), 과수원토양(2002, 2006)을 3 월부터 4월말까지 토양변동 조사시에 시료를 채취하였고 시료채취 내역은 Table 1과 같다. 채취방법은 토양시료채취 기를 이용하여 10 cm 깊이로 10개 지점에서 채취하여 잘 섞어 500 g 정도를 취한 후 음건, 분쇄하고 2 mm 체를 통과 시켜 분석용 시료로 하였다.
추출 및 정제
토양시료 50 g을 칭량하여 30 mL의 0.2 N NH
4Cl 수용액 을 가하고 30분간 정치 후 100 mL의 acetone을 가하여 2시 간 동안 진탕, 추출, 감압여과하고 잔사를 50 mL의 acetone 으로 씻어 두 여액을 합하였다. 여액을 용량 1 L의 분액여두 에 옮긴 후 50 mL 포화식염수, 450 mL의 증류수와 dichlo- romethane 50 mL 를 가하여 10분간 격렬하게 진탕하고 정치 후 dichloromethane 층을 무수 Na
2SO
4층에 통과시켜 탈수 하였고, dichloromethane 50 mL를 가하여 같은 조작을 반복 하였다. 탈수시킨 dichloromethane 층은 40
oC 의 water bath 상에서 감압농축, 건고시킨 후 10 mL hexane으로 정용하여 florisil column chromatography 를 행하였다. 즉 정제용 column 에 활성화시킨 florisil 5 g을 채우고 그 위에 1 g의 무수 Na
2SO
4를 넣은 후 50 mL hexane으로 세척하고 상기 10 ml 의 hexane 농축액 중 5 mL를 취하여 로딩하고 E
1용 액(hexane/dichloromethane, v/v, 80/20), E
2용액(hexane/
dichloromethane/ acetonitrile, v/v, 49.65/50/0.35), E
3용액 (hexane/dichloromethane/acetonitrile, v/v, 48.5/50/1.5), E
4용 액(hexane/dichloromethane/acetonitrile, v/v, 45/50/5), E
5용 액(dichloromethane/acetonitrile, v/v, 50/50) 순으로 각각 50 mL 씩의 혼합액으로 용출시켜 각각을 감압 농축하여 5 mL
의 hexane에 재용해하여 기기 분석하였다.
기기분석
분석대상 농약은 ECD와 NPD가 부착된 Hewlett Packard 5890II Series gas chromatography 와 6890 Series GC System 을 이용하였고, column은 DB-5 30 m × 0.25 mm이 었고, oven 온도는 60
oC (2 min) → 20
oC/min → 120
oC → 5
oC/min → 270
oC (15 min) 로 승온하였다. 주입부 온도는 230
oC, 검출기 온도는 ECD 300
oC, NPD 270
oC 이었으며 주 입량은 splitness 모드에서 ECD 1 µL, NPD에는 2 µL이었다.
결과 및 고찰
논 토양
전국 주요 논토양에서 채취한 토양시료 180점(‘99)에 대 한 잔류농약 분석결과는 Table 2에서 보는 바와 같이 분석 대상 100약제 중 14종 농약이 검출되었으나, 그 밖의 약제 는 검출되지 않았다. 또한 검출된 약제의 검출빈도는 0.6~21.7%이었으며, butachlor가 21.7%로 가장 높았고, isoprothiolane 이 다음으로 높았는데, 이는 1998년도의 농약 사용량이 성분량으로 각각 1,000톤과 700톤(농약공업협회, 2002) 으로 다른 농약의 사용량에 비해 많았고, 토양 중 반감 기도 isoprothiolane이 27~28일, butachlor는 24~27일로 다 른 약제들에 비해 길기 때문인 것으로 추정된다.
유기인계 농약 중 검출된 농약은 3종으로 iprobenfos, chlorpyrifos 및 diazinon으로 검출율은 각각 16.7, 1.1 및 1.6%이었으며, 이는 이(1983) 등이 보고에 비하여는 상당히 낮은 수준이었고 농업과학기술원 조사결과(1995)보다도 검 Table 2. Number of pesticide detections, detection frequency, and concentrations observed in samples collected at the paddy field soils in 1999
Pesticide No. of detections Detection frequency (%) Range of concentration (ppm) Fungicide
(3)
Hexaconazole 13 7.2 0.016~0.117
Iprobenfos 30 16.7 0.013~0.245
Isoprothiolane 36 20.0 0.010~0.142
Insecticide (5)
Buprofenzin 14 7.8 0.009~0.212
Chlorpyrifos 2 1.1 0.001~0.009
Diazinon 3 1.6 0.001~0.003
Endosulfan 18 10.0 0.002~0.105
Fipronil 1 0.6 0.020
Herbicide (6)
Butachlor 39 21.7 0.010~0.181
Molinate 5 2.8 0.009~0.027
Oxadiazon 21 11.7 0.004~0.113
Piperophos 2 1.1 0.004~0.018
Pendimethalin 10 5.6 0.004~0.137
Thiobencarb 6 3.3 0.024~0.088
출빈도가 낮게 나타났다. 이러한 결과는 이 시기에 개발된 약제의 단위 면적당 투하량이 점차 낮아지는데 기인되었다 고 추정된다.
2003 년에 1999년과 동일한 지역 또는 인근지역에서 150 점을 채취하여 잔류농약을 분석한 결과 총 7종의 농약성분 이 검출되어 4년 전인 ‘99년도에 14종 농약성분에 비하여
낮았으나 검출된 성분의 검출빈도는 6.0~36.0%로 오히려 높았으며, 그 중 isoprotholane이 36.0%로 가장 높았고, 다 음으로 oxadiazon이 33.3%, endosulfan이 16.7%로 높은 경 향을 나타냈다(Table 3). 제초제의 경우 1999년도의 6종 성 분검출에 비해 2종만 검출되었다(Table 4).
Table 3. Number of pesticide detections, detection frequency, and concentrations observed in samples collected at paddy field soils in 2003
Pesticide No. of detections Detection frequency (%) Range of concentration (ppm)
Fungicide (3)
Butachor 9 6.0 0.016~0.083
Endosulfan 25 16.7 0.003~0.193
Hexaconazole 11 7.3 0.020~0.236
Insecticide (2) Iprobenfos 17 11.3 0.003~0.103
Isoprothiolane 54 36.0 0.004~0.425
Herbicide (2) Oxadiazon 50 33.3 0.004~0.211
Pyridaphenthion 17 11.3 0.004~0.012
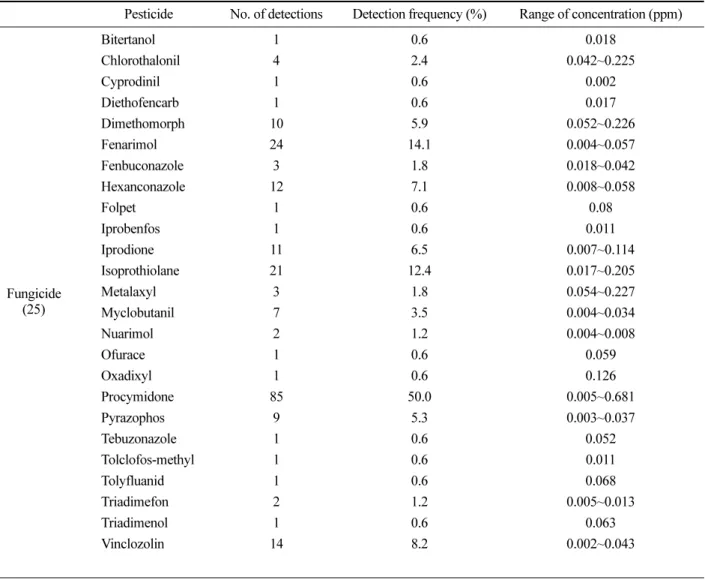
Table 4. Number of pesticide detections, detection frequency, and concentrations observed in samples collected at the plastic house soils in 2000
Pesticide No. of detections Detection frequency (%) Range of concentration (ppm)
Fungicide (25)
Bitertanol 1 0.6 0.018
Chlorothalonil 4 2.4 0.042~0.225
Cyprodinil 1 0.6 0.002
Diethofencarb 1 0.6 0.017
Dimethomorph 10 5.9 0.052~0.226
Fenarimol 24 14.1 0.004~0.057
Fenbuconazole 3 1.8 0.018~0.042
Hexanconazole 12 7.1 0.008~0.058
Folpet 1 0.6 0.08
Iprobenfos 1 0.6 0.011
Iprodione 11 6.5 0.007~0.114
Isoprothiolane 21 12.4 0.017~0.205
Metalaxyl 3 1.8 0.054~0.227
Myclobutanil 7 3.5 0.004~0.034
Nuarimol 2 1.2 0.004~0.008
Ofurace 1 0.6 0.059
Oxadixyl 1 0.6 0.126
Procymidone 85 50.0 0.005~0.681
Pyrazophos 9 5.3 0.003~0.037
Tebuzonazole 1 0.6 0.052
Tolclofos-methyl 1 0.6 0.011
Tolyfluanid 1 0.6 0.068
Triadimefon 2 1.2 0.005~0.013
Triadimenol 1 0.6 0.063
Vinclozolin 14 8.2 0.002~0.043
시설재배지 토양
전국 주요 시설재배지 토양 170점을 작물별 시료를 채 취하여 토양 중 잔류농약을 분석한 결과는 Table 4에서 보는 바와 같이 분석대상 108약제 중 57종 농약이 검출되 었으나 그 밖의 51종 농약은 전혀 검출되지 않았다. 검출 된 약제의 검출빈도는 0.6~65.3%로 높은 경향이었으며, 그중에서도 토양살충제인 endosulfan과 잿빛곰팡이병 방제 약제인 procymidone이 65.3과 50%로 높았다. 이는 시설하 우스 내에서는 작물의 생육기간이 짧아 재배작물이 자주 변 환되고 또한 온도와 습도가 높아 작물의 각종 병해의 발생 이 많아져 이들 병해충 방제를 위해 자주 약제를 살포하기 때문인 것으로 추정되며, 비닐하우스 내에서는 자외선 등이
일부 차단되므로 분해가 느리게 진행되는 것으로 생각된다.
한편, 검출된 농약성분 수가 57종으로 토양시료 채취시기가 작물의 생육시기와 같아 병해충, 잡초를 방제하기 위해 농 약을 살포하는 시기와 비슷하기 때문에 검출량과 빈도가 높 게 나타난 것으로 추정된다.
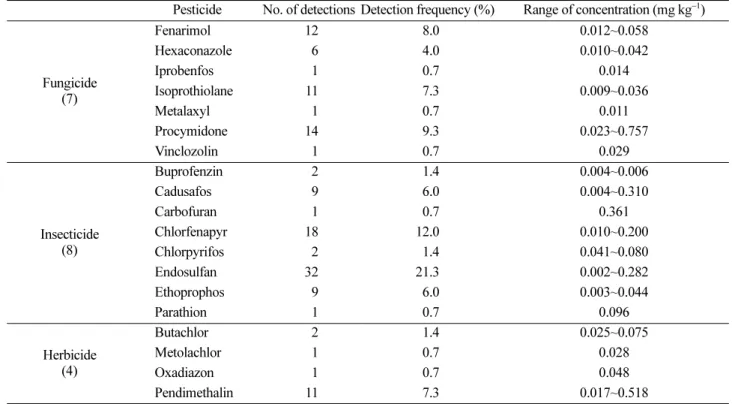
2000 년과 같은 방법으로 2004년에 동일지역 또는 인근 지역에서 150점의 토양을 채취하여 동일한 방법으로 분석 한 결과 분석대상농약 110종 성분 중 19성분이 검출되었으 며, 이는 2000년 분석시 57성분 검출에 비하여 상당히 낮 은 검출빈도를 보였으며, 이는 재배자의 농약안전사용기준 을 준수하려는 노력이 향상되어 무분별하게 농약을 살포하 지 않은 결과인 것으로 생각된다(Table 5). 특히 2000년도 Table 4. continued
Pesticide No. of detections Detection frequency (%) Range of concentration (ppm)
Insecticide (22)
Bromopropylate 1 0.6 0.015
Buprofezin 4 2.4 0.002~0.005
Cadusafos 20 11.8 0.006~0.780
Carbofuran 4 2.4 0.013~0.196
Carbosulfan 1 0.6 0.156
Chlorfenapyr 38 22.4 0.003~0.109
Chlorpyrifos 9 5.3 0.003~0.390
Cypermethrin 10 5.9 0.008~0.089
Diazinon 1 0.6 0.004
Endosulfan 111 65.3 0.002~2.929
EPN 4 2.4 0.019~0.048
Esfenvalerate 3 1.8 0.009~0.022
Ethoprophos 31 18.2 0.004~0.188
Fenazaquin 3 1.8 0.004~0.014
Fipronil 1 0.6 0.012
Isazofos 3 1.8 0.018~0.093
Methidathion 3 1.8 0.005~0.214
Parathion 5 2.9 0.008~0.164
Prothiofos 8 4.7 0.002~0.012
Pyridaben 3 1.8 0.020~0.132
Tebufenpyrad 8 4.7 0.011~0.118
Tebufos 1 0.6 0.177
Herbicide (10)
Alachlor 3 1.8 0.017~0.024
Butachlor 1 0.6 0.110
Dimethametryn 8 4.7 0.007~0.067
Ethalfluralin 2 1.2 0.014~0.015
Mefenacet 1 0.6 0.006
Metolachlor 1 0.6 0.027
Napropamid 1 0.6 0.009
Oxadiazon 1 0.6 0.019
Pendimethalin 7 4.1 0.021~0.457
Thiobencarb 1 0.6 0.011
Table 5. Number of pesticide detections, detection frequency, and concentrations observed in samples collected at the plastic house soils in 2004
Pesticide No. of detections Detection frequency (%) Range of concentration (mg kg
−1)
Fungicide (7)
Fenarimol 12 8.0 0.012~0.058
Hexaconazole 6 4.0 0.010~0.042
Iprobenfos 1 0.7 0.014
Isoprothiolane 11 7.3 0.009~0.036
Metalaxyl 1 0.7 0.011
Procymidone 14 9.3 0.023~0.757
Vinclozolin 1 0.7 0.029
Insecticide (8)
Buprofenzin 2 1.4 0.004~0.006
Cadusafos 9 6.0 0.004~0.310
Carbofuran 1 0.7 0.361
Chlorfenapyr 18 12.0 0.010~0.200
Chlorpyrifos 2 1.4 0.041~0.080
Endosulfan 32 21.3 0.002~0.282
Ethoprophos 9 6.0 0.003~0.044
Parathion 1 0.7 0.096
Herbicide (4)
Butachlor 2 1.4 0.025~0.075
Metolachlor 1 0.7 0.028
Oxadiazon 1 0.7 0.048
Pendimethalin 11 7.3 0.017~0.518
Table 6. Number of pesticide detections, detection frequency, and concentrations observed in samples collected at the upland soil in 2001 Pesticide No. of detections Detection frequency (%) Range of concentration (mg kg
−1)
Fungicide (6)
Chlorothalonil 2 1.2 0.061~0.085
Fluazinam 1 0.6 0.111
Isoprothiolane 11 6.5 0.042~0.215
Penconazole 1 0.6 0.028
Procymidone 3 1.8 0.113~0.173
Tebuconazole 4 2.4 0.046~0.593
Insecticide (11)
Cadusafos 3 1.8 0.007~0.694
Carbofuran 2 1.2 0.050~0.185
Chlorfenapyr 6 3.5 0.010~0.063
Chlorpyrifos 5 2.9 0.014~0.182
Diazinon 4 2.4 0.001~0.069
T-?endosulfan 91 53.5 0.010~2.236
EPN 6 3.5 0.018~0.085
Esfenvalerate 1 0.6 0.033
Ethoprophos 1 0.6 0.083
Prathion 4 2.4 0.022~0.736
Prothios 3 1.8 0.004~0.068
Herbicide (8)
Alachlor 16 9.4 0.012~0.639
Butachlor 6 3.5 0.112~0.237
Chloronitrofen 2 1.2 0.104~0.151
Ethalfluralin 3 1.8 0.033~0.174
Metabenthiazuron 1 0.6 0.152
Metolachlor 11 6.5 0.015~0.064
Napropamid 5 2.9 0.004~0.006
Pendimethalin 31 18.2 0.007~0.580
에는 endosulfan의 경우 65.3%, procymidone 성분이 50.0%
로 높은 검출빈도를 보였으나, 2004년도에는 endosulfan, procymidone 성분이 각각 21.3과 9.3%로 보다 낮은 검출빈 도를 나타냈다.
밭 토양
2001 년 전국 밭 토양에서 채취한 170점 토양에 대한 잔류 농약 분석결과는 Table 6에서 보는 바와 같이 분석대상 110 약제 중 25종 농약성분이 검출되었으나, 그 밖의 85종 농약 은 전혀 검출되지 않았다. 또한 검출된 약제들의 빈도를 보 면 논, 시설재배지 등에 비하여 현저히 낮은 검출빈도를 보 였는데, 이는 노지 밭작물의 경우 소규모 재배이고, 고추 등 의 과채류를 제외하고는 일반적으로 농약사용량이 낮고, 또 한 경사지 밭이 대부분이어서 토양유실 등에 의한 것으로 추 정된다. 그러나 밭토양 중에서도 토양살충제인 endosulfan은 53.5% 의 높은 검출빈도를 보였는데 이는 토양중 반감기가 길고 sulfate 상태로 되어 오랫동안 잔존하기 때문인 것으로 추정되며, 제초제인 pendimethalin도 상당히 높은 검출빈도 를 보였는데 이는 초기 발 잡초방제를 위하여 연간 평균 200 M/T (성분량) 정도로 많이 살포하기 때문으로 인정된 다. 한편 이(1983,1984) 등과 박 (1982)등의 보고와는 달리 과거에 사용되었던 유기염소계 약제인 BHCs, heptachlor, DDTs등의 농약은 전혀 검출되지 않았다.
2001 년과 같은 방법으로 2005년도에 동일한 지역 또는 인근지역에서 150점 토양을 채취하여 추출 정제 후 분석한 결과 분석대성 농약 110종 성분 중 25종 농약성분이 검출되 었으며, 이는 2001년 분석시와 검출된 성분 수는 동일하나 각각의 농약성분은 상이하였다(Table 7). 검출된 농약성분 중 살충제인 endosulfan이 70.0%의 가장 높은 검출빈도를 보였으며, pendimethalin과 alachlor가 각각 30.7과 18.0%의 대체로 높은 검출빈도를 보였는데 이는 밭 작물재배 시 농 촌 노동력 부족으로 인한 제초제의 빈번한 살포와 병해충의 다양성에 따라 나타난 현상으로 보인다.
과수원 토양
주요 과수원토양 150점을 2002년 3~4월에 채취하여 토양 중 잔류농약을 분석한 결과는 Table 8과 같이 분석대상 110 약제 중 26종 농약이 검출되었을 뿐 그 밖의 84종 농약은 검출되지 않았다. 검출빈도는 0.7~45.3%로 나타났으나 그 중 endosulfan이 45.3%로 가장 높게 나타났고, chlorfenapyr 와 EPN이 16.7과 14.0%로 다소 높은 경향이었다. 검출된 농약성분 수는 시설재배지 다음으로 높게 나타났는데 이는 과수의 종류에 따라 등록된 농약이 다양하고 다른 작물에 비하여 병충해가 다양하게 나타나기 때문인 것으로 추정된 다. 한편 제초제는 논이나 밭에 비하여 검출된 성분수가 2 종뿐으로 검출빈도가 낮았는데 이는 논이나 밭시설재배지에 Table 7. Number of pesticide detections, detection frequency, and concentrations observed in samples collected at the upland soils in 2005
Pesticide No. of detections Detection frequency (%) Range of concentration (mg kg
−1)
Fungicide (8)
Chlorothalonil Fenarimol Hexaconazole Iprodione Isoprothiolane Myclobutanil Nuarimol Procymidone
2 2 11 1 11 2 4 25
1.4 1.3 7.3 0.7 7.3 1.3 2.7 16.7
0.090~0.129 0.262~0.276 0.003~0.104
0.018 0.017~1.314 0.005~0.012 0.022~0.048 0.011~0.988
Insecticide (11)
Cadusafos Carbofuran Chlorfenapyr Chlorpyrifos Cyhalothrin Cypermethrin Diazinon Endosulfan Ethoprophos Fenpropathrin Fipronil
1 5 7 14 1 11 7 105 9 2 9
0.7 3.3 4.7 9.3 0.7 7.3 4.7 70.0 6.0 1.3 6.0
0.012 0.037~0.294 0.007~0.039 0.007~0.133
0.041 0.007~0.111 0.002~0.096 0.007~3.383 0.003~0.038 0.016~0.019 0.003~0.043
Herbicide (6)
Alachlor Butachlor Metolachlor Napropamid Pendimethlin Pretilachor
27 8 4 7 46 1
18.0 5.3 2.7 4.7 30.7 0.7
0.006~0.861 0.014~0.553 0.017~0.032 0.003~0.161 0.006~1.981
0.007
Table 8. Number of pesticide detections, detection frequency, and concentrations observed in samples collected at the orchard soils in 2002 Pesticide No. of detections Detection frequency (%) Range of concentration (mg kg
−1)
Fungicide (9)
Chlorothalonil 2 1.3 0.087~0.102
Fenarimol 15 10.0 0.012~0.074
Fluazinam 1 0.7 0.053
Hexaconazole 4 2.7 0.067~0.147
Iprodione 1 0.7 0.024
Nuarimol 1 0.7 0.051
Penconazole 1 0.7 0.089
Procymidone 9 6.0 0.010~0.045
Tebuconazole 8 5.3 0.046~0.909
Insecticide (15)
Buprofezin 10 6.7 0.002~0.023
Bromopropylate 1 0.7 0.819
Carbofuran 2 1.3 0.216~0.874
Chlorfenapyr 25 16.7 0.007~0.125
Chlorpyrifos 12 8.0 0.004~0.019
Cypermethrin 3 2.7 0.075~0.246
Endosulfan 68 45.3 0.003~1.433
EPN 21 14.0 0.011~0.140
Fenpropathrin 2 1.3 0.013~0.043
Mecarbam 1 0.7 0.056
Phenthoate 1 0.7 0.009
Phosalon 2 1.3 0.204~0.227
Pyridaben 5 3.3 0.029~0.568
Tetradifon 10 6.7 0.026~0.144
Triazophos 1 0.7 0.057
Herbicide (2)
Alachlor 27 18.0 0.005~0.013
Metolachlor 1 0.7 0.055
Table 9. Number of pesticide detections, detection frequency, and concentrations observed in samples collected at the orchard soils in 2006 Pesticide No. of detections Detection frequency (%) Range of concentration (mg kg
−1)
Fungicide (7)
Chlorothalonil 9 6.0 0.007~0.086
Fenarimol 18 12.0 0.023~0.119
Hexaconazole 22 14.7 0.007~0.304
Myclobutanil 6 4.0 0.011~0.023
Penconazole 2 1.3 0.010~0.080
Procymidone 9 6.0 0.0035~0.132
Propiconazole 1 0.7 0.014
Insecticide (11)
Chlorofenapyr 23 15.3 0.005~0.080
Chlopyrifos 7 4.7 0.017~0.056
λ-cyhalothrin 1 0.7 0.029
Dicofol 11 7.3 0.027~0.494
Endosulfan 8 5.3 0.033~1.330
EPN 2 1.3 0.067~0.197
Fenpropathrin 1 0.7 0.107
Methidation 1 0.7 0.528
Prathion 2 1.3 0.156~0.636
Prothiofos 4 2.7 0.016~0.216
Tetradifon 12 8.0 0.012~0.307
Herbicide (2)
Butachlor 1 0.7 0.030
Oxyfluorfen 26 17.3 0.011~0.439
비하여 토양침식을 방지하기 위한 초생재배 등 재배법을 수 행함으로써 제초제 사용이 적었기 때문으로 추정된다.
2002년과 같은 지점이나 인근지역에서 2006년 150점의 토양을 채취하여 잔류농약성분에 대해 분석한 결과는 Table 9 에서와 같이 분석대상 농약 110종 성분 중 20성분이 검출 되었으며, 이는 2002년의 경우 26종 성분에 비하여 다소 낮 은 양상이었고, 2002년의 경우 endosulfan 성분은 45.3%로 높은 검출빈도를 보였으나 2006년에는 5.3%의 낮은 검출빈 도를 보였는데 이는 점차 소비자의 기호에 따라 친환경 농 업의 확대, 보급과 안전농산물 생산을 위한 농약안전사용기 준의 철저한 이행에 의한 것으로 인정된다. 또한 검출빈도 도 대체로 2002년에 비해 낮게 나타났으며 제초제의 경우 oxyfluorfen 성분은 잔류기간이 대체로 포장조건에서 16~31 일, 실내조건에서 43~134일로 약간 길기 때문에 나타난 것 으로 추정된다.
Acknowledgements
This study was carried out with the support of
“Cooperative Research Program for Agricultural Science &
Technology Development (PJ 009219)”, Rural Development Administration and “Research Program for Agricultural Science & Technology Development (PJ008468)”, National Academy of Agricultural Science, Rural Development Administration, Republic of Korea.
Literature Cited