서울 북부지역 유통 농산물의 농약 잔류실태
한성희* ・ 박성규 ・ 김욱희 ・ 최영희 ・ 승현정 ・ 이영주 ・ 정희정 ・ 김윤희 ・ 유인실 ・ 김유경 ・ 한기영 ・ 채영주 서울시보건환경연구원 강북농수산물검사소
(Received on May 2, 2012. Revised on May 20, 2012. Accepted on May 25, 2012)
Monitoring of pesticide residues in commercial agricultural products in the northern area of Seoul, Korea
Sung-Hee Han*, Sung-Kyu Park, Ouk-Hee Kim, Young-Hee Choi, Hyun-Jung Seoung, Young-Ju Lee, Jung-Hee Jung, Yun-Hee Kim, In-Sil Yu, Yoo-Kyung Kim, Ki-Young Han and Young-Zoo Chae
Kangbuk Agro-Fishery Products Inspection Center, Seoul Metropolitan Government Research Institute of Public Health and Environment, Seoul
This study was conducted to monitor 284 pesticides residue level in 2,914 commercial agricultural products in the northern area of Seoul in 2011 by the multi class pesticide multiresidue analysis methods in Korea Food Code using GC, HPLC, GC-MSD and, LC-MSD. The detection rate of pesticide residues were 14.8% (431/2,914).
The order of agricultural products in which the pesticide residues were detected was perilla leaves 40.0%
(28/70), chamnamul 35.5% (11/31), amaranth 30.0% (3/10) and spinach 27.7% (38/137) etc. The percentage of products that exceeded the MRLs (maximum residue limits) were 1.0% (31/431). Those products that exceeded MRLs were ginseng (6), perilla leaves (4), leek (4), welsh onion (3) and sedeum (3) etc. The 59 kinds of the pesticides were detected on this study, 21 pesticides of them were detected over MRLs. Detection rate of fungicides (56.4%) was higher than that of insecticides (42.1%). And procymidone was detected with considerable high frequency. Additionally, residual residual violates pesticides were in the order of tolclofos-methyl, endosulfan, dimethomorph, diniconazole and fludioxonil. According to the agricultural marketing channels, detection and excess rate of them were monitored. Detection and excess rate of samples circulated in agricultural traditional market were highest. The estimated daily intakes (EDI) of the pesticides were compared to personal acceptable daily intakes (PADI) in order to risk assessment by food consumption. Diazinon in Korean cabbage showed the highest %ADI, 2.9901 and others showed below 3.0 %ADI. Overall, these results indicate that residue levels of pesticides detected were evaluated as safe.
Key words Agricultural product, Pesticide residue, Monitoring Abstract
*Corresponding author: Tel. +82-2-968-5096 Fax. +82-2-964-8164, E-mail. [email protected]
서 론
농약은 현대농업에 있어서 농산물의 증산 및 품질향상을 위한 필수농업자재로서 농산물의 생산성 제고 및 품질향상에 크게 기여하여 오늘날 풍요로운 먹거리의 공급이 가능하도록
하였을 뿐만 아니라 농산물의 생력화를 통해 노동력과 농업 생산비 절감에 중요한 역할을 함으로써 농업인의 삶 향상에 도 큰 공헌을 하였다(Jang et al., 2010). 그러나 농약은 대부 분 유기합성물질로 극히 일부는 신속하게 분해되기도 하지만 대부분은 자체의 물리화학적 특성에 따라 농산물 및 토양에 잔류하여 작물의 약해는 물론 환경오염을 유발시킬 가능성도 있다(Lee et al., 2008a). 또한 농산물에 농약이 잔류하여 이 109
ORIGINAL ARTICLE / RESIDUE Open Access
를 섭취한 인간의 건강에 심각한 영향을 초래하므로 안전한 농산물의 생산과 소비자에게 믿을 수 있는 먹거리를 공급할 수 있도록 지속적인 농약 잔류량 조사 및 모니터링을 통한 안 전성 확보가 매우 중요하게 대두되고 있다.
실제로 우리나라뿐만 아니라 세계 각국은 지속적으로 농 산물 중 잔류농약 모니터링 검사 및 감시를 실시하여 잔류농 약 오염실태 및 그 추이 변화를 파악하고 그 결과를 식품정책 의 기초 자료로 활용하고 있으며, 농약이 최대잔류허용기준 이상으로 잔류하고 있는 농산물을 폐기시킴으로써 유통농산 물의 안전성을 보장하고 있다. 미국의 모니터링 사업은 FDA (Food and Drug Administration) 주관으로 1987년부터 현 재까지 운용되고 있으며 자국에서 생산되는 농산물과 가공식 품뿐만 아니라 수입품에 대해서도 모니터링을 실시하여 매년 보고서를 공개함으로써 유통 농산물의 안전성을 보장하고 있 다(KREI, 2010). EU (European Union)에서는 회원국에 서 자체적으로 농산물 중 잔류농약을 모니터링하여 최종 결 과를 EU에서 취합하고, 또한 회원국이 공동으로 대상 농산물 과 농약을 선정하여 공동연구를 진행하고 있다(Kim et al., 2008a). 일본은 국립의약품식품위생연구소 외에 지방위생 연구소 등 20여 기관의 협력을 얻어 전국적인 식품 중 잔류 농약 실태조사를 실시하여 농약의 안전성과 잔류농약허용기 준 설정 등의 일을 수행하고 있다(JMHW, 1999).
우리나라는 1968년 국립보건원(현 식품의약품안전청)에 서 최초로 잔류농약 모니터링을 시작하여 현재 식품의약품안 전청, 농촌진흥청 및 시・도 보건환경연구원에서 국내 유통 농 산물을 대상으로 농약 잔류실태를 조사, 파악하여 식품안전 정책수립의 기초 자료로 활용하고, 또한 국립농산물품질관리 원에서는 생산 및 출하단계의 농산물 중 잔류농약을 모니터 링 조사하여 부적합 농산물에 대한 규제를 하는 등 국민의 안 전한 먹거리를 위하여 국가적 차원에서 안전성을 평가하고 있다(Kim et al., 2009b).
따라서 본 연구는 2011년 서울 북부지역에서 유통되고 있 는 농산물의 농약잔류 실태를 조사하여 향후 농산물 안전성 관리 기준의 설정 및 잔류농약의 안전성 평가를 위한 기초자 료로 활용하고자 수행하였다.
재료 및 방법
재료 및 분석농약
2011년 1월부터 12월까지 서울 북부(강북, 광진, 노원, 도 봉, 동대문, 마포, 서대문구, 성동, 성북, 용산, 은평, 종로, 중
구, 중랑)지역 백화점, 대형매장 및 재래시장 등에서 유통되고 있는 농산물 115품목 2,914건을 대상으로 잔류농약을 검사하 였다. 분석농약은 Table 1과 같이 284종을 대상으로 하였다.
시약 및 기구
284종의 농약 표준품은 Riedel-de Haen사 (Germany), Chem Service (USA), Dr. Ehrenstorfer GmbH (Germany), 그리 고 Wako (Japan)등의 제품을 사용하였으며, 일반시약은 잔류 농약분석용 및 HPLC용을 사용하였다. 분석기기는 GC (6890 및 7890, Agilent, USA)와 HPLC (1100, Agilent, USA)를 사용하였으며, 검출된 농약의 최종 정성 확인을 위해 GC-MSD (5973, Agilent, USA), LC-MSD (6130, Agilent, USA)를 사용하였다.
분석방법
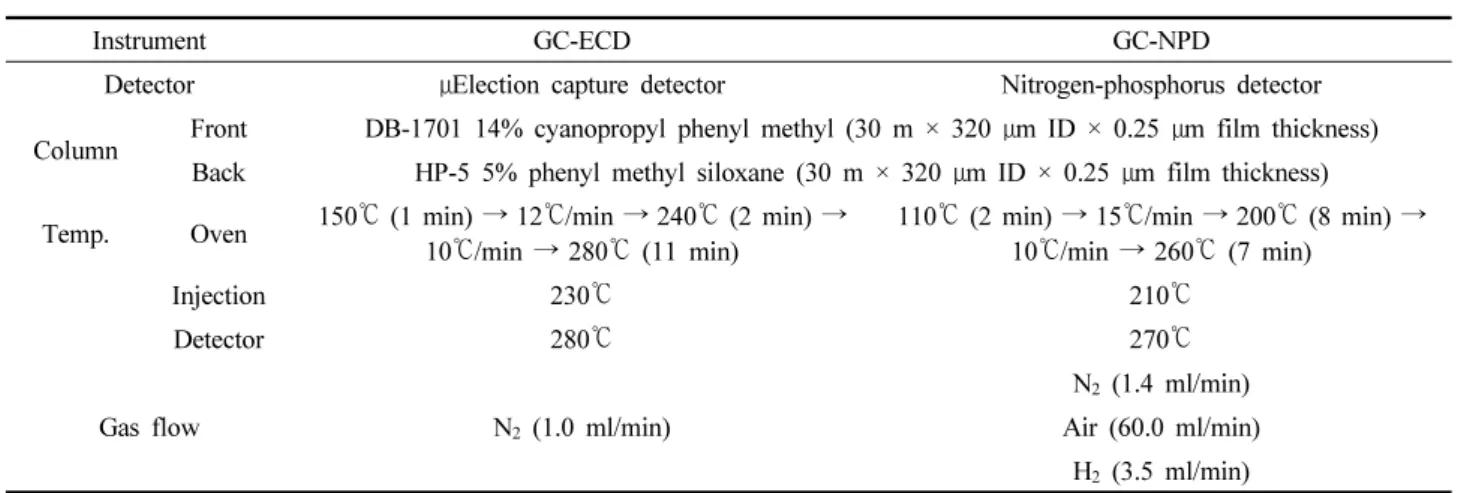
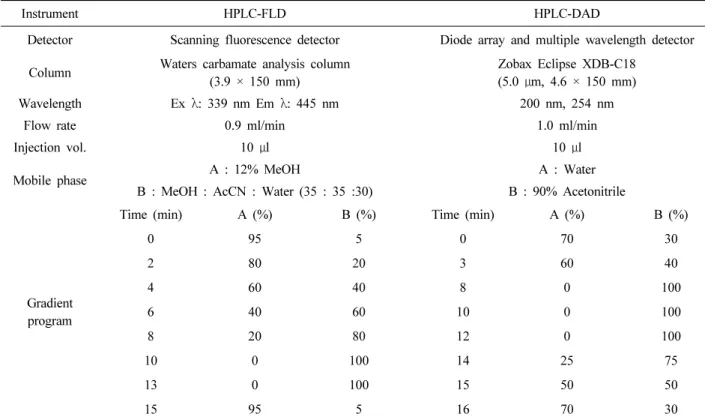
시료전처리 및 분석은 식품공전 중 식품 중 잔류농약 분석 법의 다종농약다성분분석법 제21법(KFDA, 2010)에 따라 전 처리하여 GC-ECD, GC-NPD, GC-MSD 및 HPLC-FLD, HPLC-DAD, LC-MSD로 분석하였으며 기기분석 조건은 Table 2, 및 Table 3, Table 4, Table 5에 나타내었다.
잔류농약의 안전성 평가
검출된 잔류농약의 안전성은 농산물 중 검출농약의 평균잔 류량을 기준으로 산출한 1인 일일섭취추정량(Estimated Daily Intake, EDI)을 1인 일일섭취허용량(Personal Acceptable Daily Intake, PADI)으로 나눈 PADI 대비 식이섭취율로 평 가하였다. 한국 성인 평균몸무게는 55 kg (KRISS, 2010)을 적용하였고 검출된 농약 성분의 ADI (Acceptable Daily Intake)는 식품의약품안전청 잔류농약데이터 베이스에서 설 정한 값을 적용하였으며, 농산물의 식이섭취량은 국민영양조 사보고서(MOHW, 2009)을 참고하였다. 잔류농약이 포함된 농산물 섭취가 안전한지의 여부는 최종적으로 산출한 PADI 대비 식이섭취율 값이 100보다 크면 클수록 일일허용가능 농 약섭취량을 초과하는 것이므로 위해하다고 판단할 수 있으 며, 100보다 작으면 작을수록 안전한 것으로 판정할 수 있다.
・ Personal Acceptable Daily Intake (PADI, mg/day/person) = ADI (mg/kg b.w./day) × Body Weight (kg)
・ Estimated Daily Intake amount (mg/day/person) = Average concentration (mg/kg) × Daily food intake
amount (kg/day/person)
Table 1. List of pesticides residue monitoring in agricultural products
Classification Pesticide
Insecticide (136)
Acephate, Acetamiprid, Acrinathrin, Alanycarb, Aldicarb, Aldrin, Azinphos-Methyl, Benfuracarb, Benzoximate, BHC, Bifenthrin, Bromopropylate, Buprofezin, Cadusafos, Carbaryl, Carbofuran, Carbophenothion, Carbosulfan, Carboxin, Chlorantraniliprole, Chlordane, Chlorfenapyr, Chlorfenvinphos, Chlorfluazuron, chlorobenzilate, Chlorpyrifos, Chlorpyrifos-methyl, Chromafenozide, Clothianidin, Cycloprothrin, Cyfluthrin, Cyhalothrin, Cypermethrin, DDT, Deltamethrin, Diazinon, Dichlorvos, Dicofol, Dieldrin, Diflubenzuron, Dimethoate, Dimethylvinphos, Disulfoton, Endosulfan, Endrin, EPN, Esprocarb, Ethiofencarb, Ethion, Ethoprophos, Etoxazole, Etrimfos, Fenamiphos, Fenazaquin, Fenitrothion, Fenobucarb, Fenothiocarb, Fenoxycarb, Fenpropathrin, Fenpyroxymate, Fensulfothion, Fenthion, Fenvalerate, Fipronil, Flonicamid, Fluacrypyrim, Flubendiamide, Flucythrinate, Flufenoxuron, Fluvalinate, Formothion, Fosthiazate, Heptachlor, Hexaflumuron, Imidacloprid, Indoxacarb, Isazofos, Isofenphos, Isoprocarb, Lufenuron, Malathion, Mecarbam, Metaflumizone, Metamidophos, Methidathion, Methiocarb, Methomyl, Methoxychlor, Methoxyfenozide, Metolcarb, Mevinphos, Monocrotophos, Novaluron, Omethoate, Oxamyl, Parathion, Parathion-methyl, Permethrin, Phenothrin, Phenthoate, Phorate, Phosalone, Phosmet, Phosphamidone, Phoxim, Pirimicarb, Pirimiphos-ethyl, Pirimiphos-methyl, Profenofos, Propoxur, Prothiofos, Pymetrozine, Pyraclofos, Pyrethrines, Pyridaben, Pyridaryl, Pyridaphenthion, Pyrimidifen, Pyriproxyfen, Quinalphos, Simeconazole, Spirodiclofen, Spiromecifen, Tebufenozide, Tebufenpyrad, Tebupirimfos, Teflubenzuron, Tefluthrin, Thiacloprid, Thiamethoxam, Thiodicarb, Thiometon, Tralomethrin, Triazamate, Triazophos, Vamidothion
Herbicide (57)
Acetochlor, Alachlor, Anilofos, Bendiocarb, Bifenox, Bromacil, Bromobutide, Butachlor, Cinosulfuron, Cyhalofop-butyl, Dichlobenil, Diclofop-methyl, Dimepiperate, Dimethenamid, Diphenamid, Dithiopyr, Diuron, Ethalfluralin, Fluazifop-p-butyl, Flufenacet, Flumioxazine, Indanofan, Linuron, Mefenacet, Metamifop, Methabenzthiazuron, Metobromuron, Metolachlor, Metribuzin, Molinate, Napropamide, Norflurazon, Oryzalin, Oxadiazon, Oxaziclomefone, Oxyfluorfen, Pendimethalin, Pentoxazone, Pretilachlor, Piperophos, Prometryne, Propanil, Propisochlor, Pyrazolate, Pyribenzoxim, Pyributicarb, Pyriminobac-methyl, Quinoclamine, Simazine, Simetryn, Tebutryne, Terbuthylazine, Thenylchlor, Thiazopyr, Thiobencarb, Tri-allate, Trifluralin
Fungicide (87)
Amisulbrom, Azoxystrobin, Benomyl, Benthiavalicarb-isopropyl, Bitertanol, Boscalid, Captafol, Captan, Carbendazim, Chinomethionat, Chlorothalonil, Cyazofamid, Cyflufenamid, Cymoxanil, Cyproconazole, Cyprodinil, Dichlofluanid, Dicloran, Diethofencarb, Dimetomorph, Diniconazole, Diphenylamine, Edifenphos, Ethaboxam, Fenamidone, Fenarimol, Fenbuconazole, Fenhexamid, Fenoxanil, Ferimzone, Fluazinam, Fludioxonil, Flu- quinconazole, Flusilazole, Flusulfamide, Flutolanil, Folpet, Fthalide, Furathiocarb, Imazalil, Imibenconazole, Iprobenfos, Iprodione, Iprovalicarb, Isoprothiolane, Kresoxim-methyl, Mepanipyrim, Mepronil, Metalaxyl, Metconazole, Metrafenone, Myclobutanil, Nitrapyrin, Nuarimol, Oxadixyl, Ofurace,Penconazole, Pencycuron, Probenazole, Prochloraz, Procymidone, Propamocarb, Propiconazole, Pyraclostrobin, Pyrazophos, Pyrimethanil, Pyroquilon, Quintozene, Tebuconazole, Tecnazene, Terbufos, Tetraconazole, Tetradifon, Thifluzamide, Thiophanate- methyl, Tiadinil, Tolclofos-methyl, Tolyfluanid, Tradimefon, Tradimenol, Trichlorfon, Tricyclazole, Trifloxystrobin, Triflumizole, Triflumuron, Vinclozolin, Zoxamide
Plant growth
regulator (4) Chlorpropham, Forchlorfenuron, Hexaconazole, Paclobutrazole
Table 2. Analytical conditions of GC-ECD and GC-NPD
Instrument GC-ECD GC-NPD
Detector μElection capture detector Nitrogen-phosphorus detector
Column Front DB-1701 14% cyanopropyl phenyl methyl (30 m × 320 μm ID × 0.25 μm film thickness) Back HP-5 5% phenyl methyl siloxane (30 m × 320 μm ID × 0.25 μm film thickness) Temp. Oven 150 ℃ (1 min) → 12℃/min → 240℃ (2 min) →
10 ℃/min → 280℃ (11 min)
110 ℃ (2 min) → 15℃/min → 200℃ (8 min) → 10 ℃/min → 260℃ (7 min)
Injection 230 ℃ 210 ℃
Detector 280 ℃ 270 ℃
Gas flow N
2(1.0 ml/min)
N
2(1.4 ml/min) Air (60.0 ml/min)
H
2(3.5 ml/min)
Table 3. Analytical conditions of GC-MSD
Instrument GC-MSD
Column HP-5MS 5% phenyl methyl siloxane (30 m × 250 μm ID × 0.25 μm film thickness) Temp. Oven 100 ℃ (2 min) → 10℃/min → 280℃ (15 min) → 10℃/min → 280℃ (11 min)
Injection 230 ℃
Carrier gas He (splitess, 1.0 ml/min)
MSD parameter
Ionization method Electron impact at 70 eV
Ion source temp. 230 ℃
Transfer line temp. 280 ℃
Scan rage 50-550 m/z (2.91 scan/sec)
Table 4. Analytical conditions of HPLC-FLD and HPLC-DAD
Instrument HPLC-FLD HPLC-DAD
Detector Scanning fluorescence detector Diode array and multiple wavelength detector Column Waters carbamate analysis column
(3.9 × 150 mm)
Zobax Eclipse XDB-C18 (5.0 μm, 4.6 × 150 mm)
Wavelength Ex λ: 339 nm Em λ: 445 nm 200 nm, 254 nm
Flow rate 0.9 ml/min 1.0 ml/min
Injection vol. 10 μl 10 μl
Mobile phase A : 12% MeOH A : Water
B : MeOH : AcCN : Water (35 : 35 :30) B : 90% Acetonitrile
Gradient program
Time (min) A (%) B (%) Time (min) A (%) B (%)
0 95 5 0 70 30
2 80 20 3 60 40
4 60 40 8 0 100
6 40 60 10 0 100
8 20 80 12 0 100
10 0 100 14 25 75
13 0 100 15 50 50
15 95 5 16 70 30
Table 5. Analytical conditions of LC-MSD
Instrument LC-MSD
Column Zobax Eclipse XDB-C18 (5.0 μm, 4.6 × 150 mm)
Flow rate 1.0 ml/min
Injection vol. 10 μl
Mobile phase A : Water, B : 90% Acetonitrile
MSD parameter
Ionization API/ES positive mode
Drying gas Flow 13.0 l/min
Temp. 350 ℃
Nebulizer pressure 60 Psig
Capillary voltage 3000V
Table 6. Agricultural products violated Maximum residue limits (MRLs) for pesticides
Type Group Commodity No. of sample No. of detection (%) No. of violation (%)
Total 2,914 431(14.8) 31(1.0)
Subtotal 2,484 399(16.1) 31(1.2)
Vegetables
Leafy vegetables
Perilla leaves 70 28(40.0) 4(5.7)
Spinach 137 38(27.7) 2(1.5)
Lettuce (leaf) 180 28(15.6) 2(1.1)
Amaranth 10 3(30.0) 1(10.0)
Chamnamul 31 11(35.5) 1(3.2)
Crown daisy 40 5(12.5) 1(2.5)
Lettuce (head) 209 12(5.7) 1(0.5)
other 541 65(12.0) 1(0.2)
Stalk and stem vegetables
Leek 91 45(49.5) 4(4.4)
Sedum 30 18(60.0) 3(10.0)
Welsh onion 177 30(16.9) 3(1.7)
Celery 32 5(15.6) 1(3.1)
Water dropwort 71 10(14.1) 1(1.4)
Other 42 5(11.9) 0(0.0)
Flowerhead brassicas
Korean cabbage 122 13(10.7) 0(0.0)
Broccoli 83 1(1.2) 0(0.0)
Head cabbage 105 1(1.0) 0(0.0)
Other 6 0(0.0) 0(0.0)
Root and tuber vegetables
Ginseng 35 13(37.1) 6(17.1)
Carrot 23 2(8.7) 0(0.0)
Balloon flower 12 1(8.3) 0(0.0)
Radish (root) 146 12(8.2) 0(0.0)
Other 64 0(0.0) 0(0.0)
Fruiting vegetables,
other than cucurbits
Cucumber 67 17(25.4) 0(0.0)
Koran Melon 13 2(15.4) 0(0.0)
Squash 52 8(15.4) 0(0.0)
Other 3 0(0.0) 0(0.0)
・ Average concentration (mg/kg)
={(Number of sample below LOD × 1/2 LOD) +
∑(detected concentration)} / number of sample
・ % ADI = EDI
× 100 PADI
결과 및 고찰
농산물별 잔류농약 분포
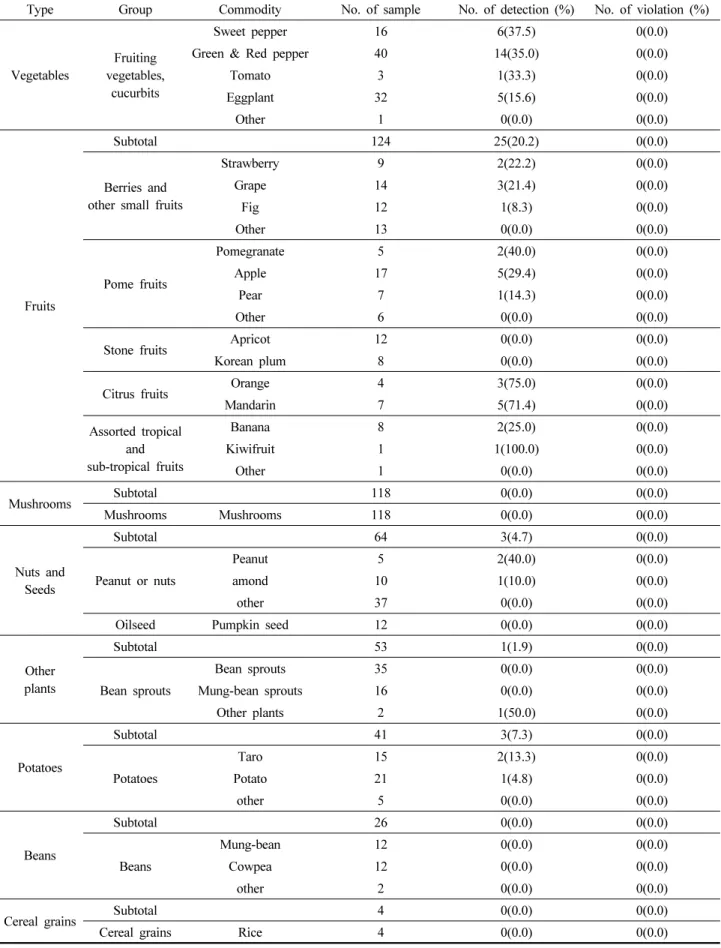
2011년 서울 북부지역에 유통된 농산물 2,914건(채소류 2,484건, 과실류 124건, 버섯류 118건, 견과 종실류 64건, 기 타 식물류 53건, 서류 41건, 콩류 26건, 곡류 4건)에 대하여
284종의 잔류농약 실태를 조사한 결과 Table 6과 같이, 전체 농산물 중 농약이 검출된 농산물은 431건으로 14.8%의 검출 률을 나타내었고, 이중에서 농약잔류허용기준을 초과한 농산 물은 31건으로 전체 농산물 중 1.0%를 차지하였다. 이러한 결과는 식품의약품안전청에서 국내 유통 농산물 중 잔류농약 모니터링 결과 검출률(3.2%)(Do et al., 2010)보다 높고, 국 립농산물품질관리원에서 2010년도 농산물 유해물질 잔류조 사 모니터링 결과의 부적합률(1.7%)(NAQS, 2010) 보다 조 금 낮은 것으로 나타났다. 이와 같이 서로 다른 결과를 나타 내는 것은 매년 잔류농약 모니터링 조사 시 농산물의 종류와 시료 수, 조사대상 농약의 종류 및 조사지역들이 차이가 있기 때문인 것으로 판단된다.
Table 6. Continued
Type Group Commodity No. of sample No. of detection (%) No. of violation (%)
Vegetables
Fruiting vegetables,
cucurbits
Sweet pepper 16 6(37.5) 0(0.0)
Green & Red pepper 40 14(35.0) 0(0.0)
Tomato 3 1(33.3) 0(0.0)
Eggplant 32 5(15.6) 0(0.0)
Other 1 0(0.0) 0(0.0)
Fruits
Subtotal 124 25(20.2) 0(0.0)
Berries and other small fruits
Strawberry 9 2(22.2) 0(0.0)
Grape 14 3(21.4) 0(0.0)
Fig 12 1(8.3) 0(0.0)
Other 13 0(0.0) 0(0.0)
Pome fruits
Pomegranate 5 2(40.0) 0(0.0)
Apple 17 5(29.4) 0(0.0)
Pear 7 1(14.3) 0(0.0)
Other 6 0(0.0) 0(0.0)
Stone fruits Apricot 12 0(0.0) 0(0.0)
Korean plum 8 0(0.0) 0(0.0)
Citrus fruits Orange 4 3(75.0) 0(0.0)
Mandarin 7 5(71.4) 0(0.0)
Assorted tropical and sub-tropical fruits
Banana 8 2(25.0) 0(0.0)
Kiwifruit 1 1(100.0) 0(0.0)
Other 1 0(0.0) 0(0.0)
Mushrooms Subtotal 118 0(0.0) 0(0.0)
Mushrooms Mushrooms 118 0(0.0) 0(0.0)
Nuts and Seeds
Subtotal 64 3(4.7) 0(0.0)
Peanut or nuts
Peanut 5 2(40.0) 0(0.0)
amond 10 1(10.0) 0(0.0)
other 37 0(0.0) 0(0.0)
Oilseed Pumpkin seed 12 0(0.0) 0(0.0)
Other plants
Subtotal 53 1(1.9) 0(0.0)
Bean sprouts
Bean sprouts 35 0(0.0) 0(0.0)
Mung-bean sprouts 16 0(0.0) 0(0.0)
Other plants 2 1(50.0) 0(0.0)
Potatoes
Subtotal 41 3(7.3) 0(0.0)
Potatoes
Taro 15 2(13.3) 0(0.0)
Potato 21 1(4.8) 0(0.0)
other 5 0(0.0) 0(0.0)
Beans
Subtotal 26 0(0.0) 0(0.0)
Beans
Mung-bean 12 0(0.0) 0(0.0)
Cowpea 12 0(0.0) 0(0.0)
other 2 0(0.0) 0(0.0)
Cereal grains Subtotal 4 0(0.0) 0(0.0)
Cereal grains Rice 4 0(0.0) 0(0.0)
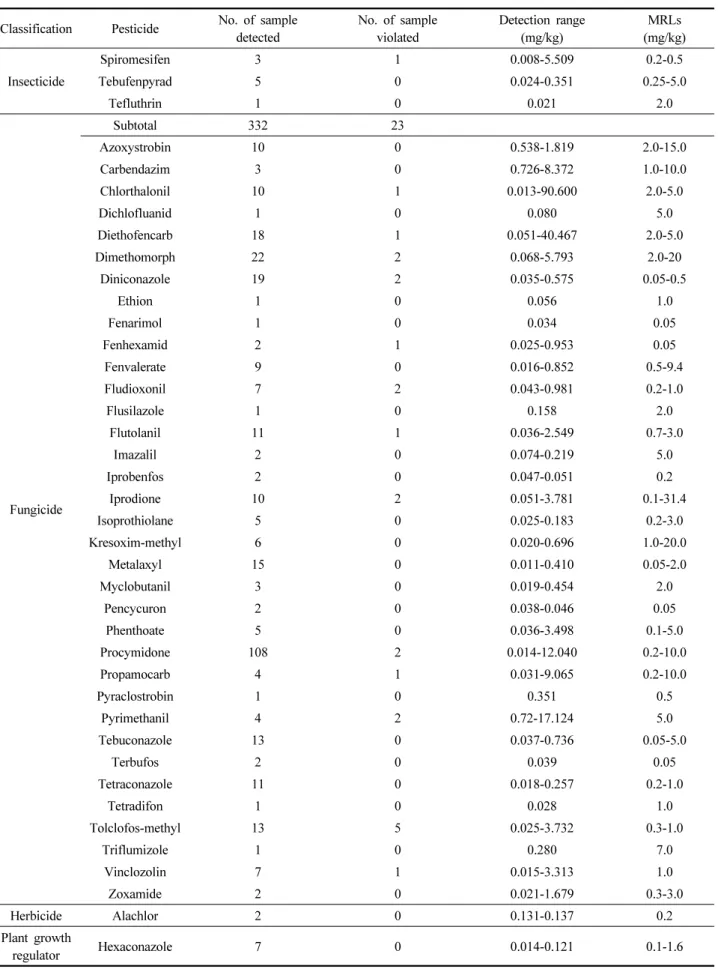
Table 7. Residues pesticides violated Maximum residue limits (MRLs)
Classification Pesticide No. of sample detected
No. of sample violated
Detection range (mg/kg)
MRLs (mg/kg)
Total 589 34
Insecticide
Subtotal 248 11
Bifenthrin 22 0 0.010-0.282 0.5-2.0
Cadusafos 2 1 0.352 0.02
Carbofuran 2 1 0.003-2.019 0.5
Chlorfenapyr 46 1 0.007-1.224 0.1-3.0
Chlorpyrifos 7 1 0.004-0.505 0.05-1.0
Cyhalothrin 1 0 0.028 0.5
Cypermethrin 42 0 0.019-0.948 0.5-6.3
Diazinon 14 0 0.013-0.130 0.1-0.5
Dimethoate 1 0 2.969 20.0
Endosulfan 79 4 0.010-1.202 0.05-0.3
EPN 2 1 0.089-0.402 0.05-0.27
Fenitrothion 2 0 0.030-0.221 2.0
Fenpropathrin 4 0 0.014-0.134 1.0-2.5
Flonicamid 4 0 0.012-0.080 0.5-2.0
Methidathion 3 0 0.160-0.845 5.0
Methomyl 1 0 0.105 0.2
Permethrin 1 0 1.400 2.0
Pyridaben 3 1 0.683-5.502 2.0
Pyridalyl 3 0 0.141-1.005 5.0
농약이 검출된 농산물을 유형별로 살펴보면 엽채류가 190 건(44.1%)으로 가장 높은 비율을 차지하였으며 엽경채류 113건(26.2%), 근채류 28건(6.5%)순이었다. 전체 채소류 중 농약 검출률은 16.1%이었고, 돌나물 60.0%(18/30), 부추 49.5%(45/91), 들깻잎 40.0%(28/70), 피망 37.5%(6/16), 인 삼 37.1%(13/35) 등에서 잔류농약 검출률이 높았다. 이는 Jang et al. (2010)의 연구에서 보여준 채소류의 농약 검출률 12.7%보다는 높았다. 채소류에서 농약이 많이 검출되는 이 유는 곡류나 과실류에 비하여 제한된 면적에서 집단화된 시 설재배가 대부분이어서 재배환경 악화에 따른 병해충 발생률 이 높아 농약 사용이 증가하기 때문으로 사료된다.
한편 농약잔류허용기준을 초과한 농산물은 인삼 6건(19.4%), 들깻잎, 부추 각각 4건(12.9%), 파, 돌나물 각각 3건(9.7%), 시금치, 상추, 각각 2건(6.5%), 쑥갓, 참나물, 엇갈이배추, 비 름나물, 샐러리, 미나리 등에서 각각 1건(3.2%)으로 총 31건 이었다. 특히 기준초과 농산물 중 엽채류가 41.9%(13/31)로 높았는데 이는 단위 중량당 표면적이 크고 비닐하우스 재배 가 많아 비나 바람 등에 의한 손실이 적고, 잔류허용기준이
설정되지 않은 농약들이 주로 검출되어 생산자들이 미등록 농약을 사용하였기 때문으로 판단된다.
따라서 소면적으로 재배되는 작물에 많은 농약이 신속하 게 등록되도록 노력하고 있으며, 식탁에서 쉽게 접할 수 있고 신선한 상태로 섭취하는 특성을 고려할 때 엽채류로부터 농 약의 섭취를 최소한으로 줄이기 위한 세척 등 효과적인 방법 들이 연구보고(Kwon et al., 2009b) 되고 있으며, 이러한 방 법들을 통해 가정이나 급식시설에서 보다 더 안전하게 채소 류를 즐겨 먹을 수 있을 것으로 권장된다.
농약별 분포
조사대상 농산물에 있어서 잔류농약별 검출현황은 분석대 상 284종 중 총 59종의 농약이 589회 검출되었으며 검출빈도 가 가장 높은 농약은 procymidone으로 108회(18.3%) 검출되 었고, 그 다음으로 endosulfan이 79회(13.4%), chlorfenapyr 46회(7.8%), cypermethrin 42회(7.1%), bifenthrin 22회 (3.7%), dimethomorph 22회(3.7%)등의 순으로 나타났다.
이는 Nam et al. (2006)의 유통중인 농산물의 잔류농약 모니
Table 7. Continued
Classification Pesticide No. of sample detected
No. of sample violated
Detection range (mg/kg)
MRLs (mg/kg)
Insecticide
Spiromesifen 3 1 0.008-5.509 0.2-0.5
Tebufenpyrad 5 0 0.024-0.351 0.25-5.0
Tefluthrin 1 0 0.021 2.0
Fungicide
Subtotal 332 23
Azoxystrobin 10 0 0.538-1.819 2.0-15.0
Carbendazim 3 0 0.726-8.372 1.0-10.0
Chlorthalonil 10 1 0.013-90.600 2.0-5.0
Dichlofluanid 1 0 0.080 5.0
Diethofencarb 18 1 0.051-40.467 2.0-5.0
Dimethomorph 22 2 0.068-5.793 2.0-20
Diniconazole 19 2 0.035-0.575 0.05-0.5
Ethion 1 0 0.056 1.0
Fenarimol 1 0 0.034 0.05
Fenhexamid 2 1 0.025-0.953 0.05
Fenvalerate 9 0 0.016-0.852 0.5-9.4
Fludioxonil 7 2 0.043-0.981 0.2-1.0
Flusilazole 1 0 0.158 2.0
Flutolanil 11 1 0.036-2.549 0.7-3.0
Imazalil 2 0 0.074-0.219 5.0
Iprobenfos 2 0 0.047-0.051 0.2
Iprodione 10 2 0.051-3.781 0.1-31.4
Isoprothiolane 5 0 0.025-0.183 0.2-3.0
Kresoxim-methyl 6 0 0.020-0.696 1.0-20.0
Metalaxyl 15 0 0.011-0.410 0.05-2.0
Myclobutanil 3 0 0.019-0.454 2.0
Pencycuron 2 0 0.038-0.046 0.05
Phenthoate 5 0 0.036-3.498 0.1-5.0
Procymidone 108 2 0.014-12.040 0.2-10.0
Propamocarb 4 1 0.031-9.065 0.2-10.0
Pyraclostrobin 1 0 0.351 0.5
Pyrimethanil 4 2 0.72-17.124 5.0
Tebuconazole 13 0 0.037-0.736 0.05-5.0
Terbufos 2 0 0.039 0.05
Tetraconazole 11 0 0.018-0.257 0.2-1.0
Tetradifon 1 0 0.028 1.0
Tolclofos-methyl 13 5 0.025-3.732 0.3-1.0
Triflumizole 1 0 0.280 7.0
Vinclozolin 7 1 0.015-3.313 1.0
Zoxamide 2 0 0.021-1.679 0.3-3.0
Herbicide Alachlor 2 0 0.131-0.137 0.2
Plant growth
regulator Hexaconazole 7 0 0.014-0.121 0.1-1.6
Fig. 1. Distribution of detected pesticide in sampling places of the Northern Area in Seoul.
터링과 Kwon et al. (2010c)의 2006~2008년 부산지역 잔 류농약 실태조사 보고와도 유사하였다.
검출농약 59종에 대해 농약의 용도별 분포를 살펴보면 크 게 살균제, 살충제, 제초제 및 식물 생장 조절제로 구분하여 조사하였는데(Table 7) 검출빈도는 살균제(332회, 56.4%)가 살충제(248회, 42.1%)에 비해 높고 식물 생장 조절제(7회, 1.3%), 제초제(2회, 0.4%)가 검출되는 양상을 보였다.
한편 잔류허용기준을 초과한 농약은 21종 이었으며, tolclofos- methyl 5회, endosulfan 4회, dimethomorph, diniconazole, fludioxonil, iprodione, procymidone, pyrimethanil이 각각 2회, cadusafos, carbofuran, chlorfenapyr, chlorpyrifos, EPN, pyridaben, spiromesifen, chlorothalonil, diethofencarb, fenhexamid, flutolanil, propamocarb, vinclozolin이 각각 1 회로 총 34회였다. 이 중 9회를 제외한 25회는 농약잔류허용 기준이 설정되어 있지 않은 농산물에서 검출되었다. 해당 농 산물에 사용등록이 되어있지 않은 농약을 사용할 경우 그 농 약의 최저기준을 적용하게 되어 부적합 판정을 받을 가능성 이 매우 높아지므로 농민들의 농약안전사용기준 준수에 대한 지도가 더욱 강화되어야겠다.
농약잔류허용기준을 초과한 농약성분 중 가장 높은 부적 합률을 나타낸 tolclofos-methyl은 인삼에서 가장 문제가 되 는 모잘룩병 방제농약으로 35건 중 13건 검출, 5건 기준초과 를 나타내었다. 이것은 2011년 시중에 나물용으로 유통되고 있는 종삼(1년생 이식용 인삼)과 여름철 삼계탕 재료 등으로 유통되는 수삼을 집중적으로 잔류농약을 검사한 결과로 보인 다. Seung et al. (2010)의 2009년도 인삼 12건을 검사하여 11건 검출, 10건에서 잔류허용기준을 초과한 연구결과와도 유사하다. 다음으로 부적률이 높은 endosulfan은 1956년 Hoechst사에서 개발되어 1971년 국내에 소개된 이후 사이크
로디엔계 농약으로 담배나방 및 토양해충 방제용으로 사용되 는데, 작용기작은 접촉독 및 식독작용에 의해서 살충효과를 발 휘하는 비침투성 살충제로 유럽에서는 사용이 금지된 농약 (Hwang et al., 2008)이고, 우리나라에서도 지난 2005년도 이후에는 식용작물에 사용 금지된 농약으로서 전문적인 잔류 농약관리가 필요하여 농약관리당국에서 2011년도 말에 등록 취소하여 앞으로는 검출률 및 부적합률이 많이 감소될 것으로 기대된다.
판매점별 분포
서울 북부지역 유통 농산물을 판매점별로 농약의 검출양 상을 파악하기 위해 판매점을 중대형 유통점(중대형 할인점, 백화점 포함), 재래시장, 및 직거래 장터로 분류하여 각각의 잔류농약 검출률을 비교하였다(Fig. 1). 유통되는 농산물의 총 2,914건 중 중대형 유통점이 2,532건으로 가장 많았고, 기 타 재래시장 및 직거래 장터가 각각 291건과 91건이었다. 잔 류농약 검출률은 직거래 장터가 19.8%로 가장 높았고, 재래 시장이 17.2%, 중대형 유통점이 14.3%로 나타났다. 또한 농 약잔류허용기준 초과율은 재래시장이 2.1%로 가장 높게 나 타났고 직거래장터, 중대형 유통점 순으로 나타났다.
판매점별 검출 결과에서 보는 바와 같이 표본수가 상대적 으로 적은 것에 비하여 재래시장과 직거래 장터 농산물이 중 대형 유통점의 농산물에 비해 높은 검출률과 부적합률을 보 였다. 이것은 중대형 유통점에서는 농산물의 품질관리 및 사 전검사가 실시되고, 생산자의 추적이 확실한 친환경 농산물 이 주로 판매되고 있는데 반면 재래시장과 직거래장터에서는 소규모 영세상으로 비 GAP 농산물이 주로 유입되고 있는 것 도 부적합률이 높은 원인으로 판단된다.
이와 결과는 Song et al. (2000)의 유통 경로별 농약 잔류
Table 8. Risk assessment of pesticides residues by Korean cabbage consumption
Agricultural
product Pesticide
Average concentration
(mg/kg)
EDI (mg/day/person)
PADI
(mg/day/person) %ADI
Korean cabbage
Bifenthrin 0.103 0.006559 0.55 1.0925
Chlorfenpyr 0.103 0.006559 1.43 0.4587
Cypermethrin 0.075 0.004767 1.1 0.4334
Diazinon 0.129 0.008223 0.275 2.9901
Diniconazole 0.111 0.007087 1.1 0.6443
Endosulfan 0.069 0.004415 0.33 1.3380
Fevalerate 0.375 0.023964 1.1 2.1786
Iprodion 1.124 0.071925 3.3 2.1795
Metalaxyl 1.222 0.078196 4.4 1.7772
Pyridaryl 0.324 0.020701 1.54 1.3442
Tebuconazole 0.308 0.019688 1.65 1.1932
량에 관한 연구에서 재래시장>경매시장>중대형 유통점의 순 으로 검출빈도가 높고, 경매시장=재래시장>중대형 유통점의 순으로 부적합률이 높게 나타난 것과 유사하였다. 또한 Kwon et al. (2003a)의 연구에서 도매시장>재래시장>중대형 유통점의 순으로 검출빈도가 높게 나타난 결과와도 유사하였 다. 이 같은 연구 결과로 볼 때 재래시장과 직거래장터 유통 농산물의 잔류농약 안전성 확보를 위하여 향후 지속적인 안 전관리가 이루어져야 할 것으로 생각된다.
농산물의 잔류농약 안전성 평가
안전성 평가를 위한 연구 대상 농산물은 우리나라에서 가 장 즐겨먹는 김치의 주재료인 배추로 선정하였다. 배추는 가 식부위인 잎이 넓어 농약 부착량이 많고 잔류량 또한 높아 국 립농산물품질관리원에서 안전성 취약품목으로 관리하고 있 는 작물이다(Lee et al., 2009b). 배추에 대한 검출농약의 1 인 일일섭취추정량(EDI)와 1인 일일섭취허용량(PADI)을 기 준으로 식이섭취율을 산출하였다. Table 8에 제시한 바와 같이 배추에서 검출된 농약 중 PADI가 상대적으로 낮은 diazinon의 위해도는 2.9901%로 가장 높게 나타났고, 다른 모든 농약도 3.0% 미만으로 나타나 모두 PADI 대비 위해도가 낮은 것으로 확인되었다. 뿐만 아니라 식품 중 세척 및 요리 등을 통한 조리 과정을 거쳤을 경우 위해도는 더욱 낮아져 매우 안전한 수준인 것으로 판단된다. Do et al. (2010)이 보고한 국내 유통 농산 물 중 잔류농약 모니터링 결과 chlorpyrifos, fenobucarb등 7 종 농약 모두 PADI 대비 위해도가 아주 낮은 결과로 안전하 다고 보고하였고, 또한 Jang et al. (2010)은 서울지역 유통 채 소류 섭취에 따른 잔류농약의 위해성 평가 연구결과 diethofencarb
7.33%, indoxacarb 5.13%, EPN 3.96%, diniconazole 3.92%, chlorothalonil 3.09%로 나타났고 기타농약은 모두 3.0% 이 하로 나타나 농약의 영향이 매우 낮은 것으로 판단된다고 보고 하였다. 이와 같은 PADI와의 비교를 통한 위해도 평가는 위해 물질의 허용량 결정과 안전 사용기준 설정을 위한 기본자료로 매우 중요하므로, 농약의 위해성 평가는 향후 국가차원의 잔류 농약 모니터링 사업 및 식이섭취량을 활용한 평가로 장기간 에 걸쳐 체계적으로 이루어져야 할 것으로 생각된다.
Literature Cited
Do J. A., H. J. Lee, Y. W. Shin, W. J. Choe, K. R. Chae, K.
C. Soon and W. S. Kim (2010) Monitoring of pesticide residues in domestic agricultural products. Journal of Food Science and Nutrition. 39(6):902 ~908.
Hwang Y. S., T. R. Kim, S. J. Jeon, B. C. Choe, J. S. Ahn, Y.
J. Lee, M. S. Hong, N. W. Park and S. G. Park (2008) Current status of pesticide residues in commercial agricultural products in the gangseo area of Seoul (2008). Report of Seoul Institute of Health & Environment. 44:58 ~69.
Jang M. R., H. K. Moon, T. R. Kim, D. H. Yuk, J. H. Kim and S. G. Park (2010) Dietary risk assessment for pesticide residues of vegetable Seoul, Korea. The Korea Journal of Nutrition Society. 43(4):404 ~412.
JMHW Good Sanitation Division and Food Chemistry Division (1999) Pesticide Residues in Food. Ministry of Health and Welfare Tokyo. Japan.
KFDA (2010) Korean Food Code. 58 Multi class pesticide multi-
residue methods. Korea Food and Drug Administration.
Korea.
KFDA (2011) Pesticide Residue Database. Available from: http://
fse.foodnara.go.kr/residue/pesticides/pesticides_info.jsp.
Korea Food & Drug Administration
Kim M. R., M. A. Na, W. Y. Jung, C. S. Kim, N. K. Sun, E.
C. Seo, E. M. Lee, Y. G. Park, J. A. Byun, J. H. Eom, R. S.
Jung and J. H. Lee (2008a) Monitoring of pesticide residues in special products. The Korean Journal of Pesticide Science.
12(4): 323 ~334.
Kim T. R., D. H. Yuk, C. K. Hong, K. H. Hwang, S. A. Jo, E. S. Lee, C. M Choi, E. H. Kim, S. H. Han, E. J. Choi, J.
H. Kim, and S. G. Park (2009b) Characteristics of pesticide residues in agricultural products collected from the southern area of Seoul in 2009. Report of Seoul Institute of Health
& Environment. 45:21 ~33.
KREI (2010) Global agricultural. 119:3 ~13. Korea Rural Economic Institute. Korea.
KRISS (2010) Report of 6th Size Korea. Korea Research Institute of Standard and Science. Korea.
Kwon H. D. and J. H. Lee (2003a) A study on the pesticide residues of circulating agricultural products in Busan Area (IV). Report of Busan Institute of Health & Environment.
13:97 ~117.
Kwon H. Y., H. D. Lee, J. B. Kim, Y. D. Jin, B. C. Moon, B.
J. Park, K. A. Son, O. K. Kwon and M. K. Hong (2009b) Reduction of pesticide residues in field-sprayed leafy vegetables by washing and boiling. Journal of Food Hygiene and Safety. 24(2):182 ~187.
Kwon S. M., E. H. Park, J. M. Kang, H. C. Jo, S. H. Jin, P. J.
Yu, B. S. Ryu and G. H. Jeong (2010c) Pesticide residues survey on agricultural products before auction at whole market in Busan Area during 2006 ~2008. The Korean
Journal of Pesticide Science. 14(2):86 ~94.
Lee E. Y., H. H. Noh, Y. S. Park, K. W. Kang, J. K. Kim, T. D.
Jin, S. S. Yun, C. W. Jin, S. K. Han and K. S. Kyung (2009b) Residual characteristics of Etofenprox and Methoxyfenozide in Chinese Cabbage. The Korean Journal of Pesticide Science. 13(1):13 ~20.
Lee E. Y., H. H. Noh, Y. S. Park, K. W. Kang, S. Y. Jo, S.
R. Lee, I. Y. Park, T. H. Kim, Y. D. Jin and K. S. Kyung (2008a) Monitoring of pesticide residues in agricultural products collected from market in Cheongju and Jeonju.
The Korean Journal of Pesticide Science. 12(4):357 ~362.
MOHW (2009) The Korea National Health & Nutrition Exami- nation Survey. Ministry of Health and Welfare. Korea Nam H. S., Y. H. Choi, S. H. Yoon, H. M. Hong, Y. C. Park,
J. H. Lee, Y. S. Kang, J. O. Lee, Y. P. Hong and H. Y.
Kim (2006) Monitoring of residual pesticides in commercial agricultural products. The Korean Journal of Food Science and technology. 30(3):317 ~324.
NAQS (2010) A Survey on Pesticide Residues of Agricultural Products (2010). National Agricultural Products Quality Management Service. Korea
Seung H. J. S. K. Park, K. T. Ha, O. H. Kim, Y. H. Choi, S.
J. Kim, K. A. Lee, J. I. Jang, H. B. Jo and B. H. Choi (2010) Survey on pesticide residues in commercial agricultural products in the northern area of Seoul. Journal of Food Hygiene and Safety. 25(2):106 ~117.
Song N. S., M. Y. Lee, S. M. Park, J. D. Kim, H. K. Kang, I. S. Park, C. Y. Lee and G. B. Yoo (2000) A study on the residual pesticide of agricultural production in Chungcheongnam- Do. Report of Chungnam Institute of Health & Environment.
11.
서울 북부지역 유통 농산물의 농약 잔류실태
한성희* ・ 박성규 ・ 김욱희 ・ 최영희 ・ 승현정 ・ 이영주 ・ 정희정 ・ 김윤희 ・ 유인실 ・ 김유경 ・ 한기영 ・ 채영주
서울시보건환경연구원 강북농수산물검사소
요 약 본 연구는 2011년 서울 북부지역에서 유통되고 있는 농산물 2,914건을 대상으로 GC, HPLC, GC-MSD 및 LC-MSD을 이용한 다종농약다성분분석법에 따라 284종 대한 잔류농약 실태를 조사하였다. 농산물 중 431건에서 농약이 검출되어 14.8%의 검출률을 나타냈으며, 농약 검출빈도가 높은 농산물은 들깻잎 40.0%(28/70), 참나물 35.5%(11/31), 비 름나물 30.0%(3/10), 시금치 27.7%(38/137) 순이었다. 이 중 농약잔류허용기준을 초과한 농산물은 31건으로 부적합률은 1.0% 였으며 인삼 6건(19.4%), 들깻잎, 부추 각각 4건(12.9%), 파, 돌나물 각각 3건(9.7%), 시금치, 상추 각각 1건(3.2%) 등이었다. 분석대상 농약 284종 중에서 검출된 농약 성분은 59종으로 이 중 잔류허용기준을 초과한 농약은 21종이었다.
농약의 용도별 분포를 보면 살균제(56.4%)가 살충제(42.1%)에 비해 검출빈도가 높았다. Procymidone의 검출빈도가 가장 높았고 이 중 잔류허용기준을 초과한 농약은 tolclofos-methyl, endosulfan, dimethomorph, diniconazole, fludioxonil이였 다. 판매점별 분포를 살펴보면 유통되는 농산물의 잔류농약 검출률은 직거래 장터가, 잔류농약기준 초과률은 전통시장이 가장 높았다. 배추에서 검출된 각 농약의 안전성 평가를 위한 PADI 대비 식이섭취율은 diazinon에서 2.9901 %로 가장 높게 나타났고 다른 모든 농약도 3.0% 미만으로 나타나 모두 PADI 대비 위해도가 낮은 것으로 확인되어 안전한 것으로 나타났다.
색인어 농산물, 잔류농약, 모니터링