ABSTRACT
Background and Objectives: Although anticoagulation with warfarin is recommended as an international normalized ratio (INR) of prothrombin time between 2.0 and 3.0 and mean time in the therapeutic range (TTR) ≥70%, little has been proven that universal criteria might be suitable in Korean atrial fibrillation (AF) patients.
Methods: We analyzed 710 patients with non-valvular AF who took warfarin. INR value and clinical outcomes were assessed during 2-year follow-up. Intensity of anticoagulation was assessed as mean INR value and TTR according to target INR range. Primary net-clinical outcome was defined as the composite of new-onset stroke and major bleeding. Secondary net- clinical outcome was defined as the composite of new-onset stroke, major bleeding and death.
Results: Thromboembolism was significantly decreased when mean INR was over 1.6. Major bleeding was significantly decreased when TTR was over 70% and mean INR was less than 2.6. Mean INR 1.6–2.6 significantly reduced thromboembolism (adjusted hazard ratio [HR], 0.40; 95% confidence interval [CI], 0.19–0.85), major bleeding (HR, 0.43; 95% CI, 0.23–
0.81), primary (HR, 0.50; 95% CI, 0.29–0.84) and secondary (HR, 0.45; 95% CI, 0.28–0.74) net-clinical outcomes, whereas mean INR 2.0–3.0 did not. Simultaneous satisfaction of mean INR 1.6–2.6 and TTR ≥70% was associated with significant risk reduction of major bleeding, primary and secondary net-clinical outcomes.
Conclusions: Mean INR 1.6–2.6 was better than mean INR 2.0–3.0 for the prevention of thromboembolism and major bleeding. However, INR 1.6–2.6 and TTR ≥70% had similar clinical outcomes to INR 2.0–3.0 and TTR ≥70% in Korean patients with non-valvular AF.
Keywords: Warfarin; Prothrombin time; Atrial fibrillation; Thromboembolism; Safety
Original Article
Received: Mar 22, 2019 Revised: Jul 30, 2019 Accepted: Sep 11, 2019 Correspondence to
Jeong Gwan Cho, MD, PhD, FACC Department of Cardiovascular Medicine, The Heart Center of Chonnam National University Hospital, 42, Jebong-ro, Dong-gu, Gwangju 61469, Korea.
E-mail: [email protected]
Copyright © 2020. The Korean Society of Cardiology
This is an Open Access article distributed under the terms of the Creative Commons Attribution Non-Commercial License (https://
creativecommons.org/licenses/by-nc/4.0) which permits unrestricted noncommercial use, distribution, and reproduction in any medium, provided the original work is properly cited.
ORCID iDs
Ki Hong Lee
https://orcid.org/0000-0002-9938-3464 Jeong Gwan Cho
https://orcid.org/0000-0001-7855-4490 Nuri Lee
https://orcid.org/0000-0003-4591-7157 Kyung Hoon Cho
https://orcid.org/0000-0002-0377-6352 Hyung Ki Jeong
https://orcid.org/0000-0001-5749-9525 Hyukjin Park
https://orcid.org/0000-0001-6832-9716 Yongcheol Kim
https://orcid.org/0000-0001-5568-4161 Jae Yeong Cho
https://orcid.org/0000-0002-9393-2821
Ki Hong Lee , MD, PhD, Jeong Gwan Cho , MD, PhD, FACC, Nuri Lee , MD, Kyung Hoon Cho , MD, Hyung Ki Jeong , MD, Hyukjin Park , MD,
Yongcheol Kim , MD, Jae Yeong Cho , MD, PhD, Min Chul Kim , MD, PhD, Doo Sun Sim , MD, PhD, Hyun Ju Yoon , MD, PhD, Namsik Yoon , MD, PhD, Kye Hun Kim , MD, PhD, Young Joon Hong , MD, PhD,
Hyung Wook Park , MD, PhD, Youngkeun Ahn , MD, PhD, Myung Ho Jeong , MD, PhD, and Jong Chun Park , MD, PhD
Department of Cardiovascular Medicine, The Heart Center of Chonnam National University Hospital, Gwangju, Korea
Impact of Anticoagulation Intensity in Korean Patients with Atrial
Fibrillation: Is It Different from
Western Population?
Min Chul Kim
https://orcid.org/0000-0001-6026-1702 Doo Sun Sim
https://orcid.org/0000-0003-4162-7902 Hyun Ju Yoon
https://orcid.org/0000-0003-1285-3660 Namsik Yoon
https://orcid.org/0000-0001-9112-150X Kye Hun Kim
https://orcid.org/0000-0002-6885-1501 Young Joon Hong
https://orcid.org/0000-0003-0192-8161 Hyung Wook Park
https://orcid.org/0000-0002-9630-0467 Youngkeun Ahn
https://orcid.org/0000-0003-2022-9366 Myung Ho Jeong
https://orcid.org/0000-0003-2424-810X Jong Chun Park
https://orcid.org/0000-0002-1637-7991
FundingThis study was supported by a grant of the Korean Society of Cardiology (201703-05).
Conflict of Interest
The authors have no financial conflicts of interest.
Author Contributions
Conceptualization: Jeong MH. Data curation:
Lee N, Hong YJ. Formal analysis: Lee KH, Sim DS. Funding acquisition: Cho JY. Investigation:
Park HW. Methodology: Lee KH, Lee N, Cho KH, Jeong KH, Kim Y, Hong YJ. Project administration: Cho KH, Cho JY, Yoon N, Kim KH. Resources: Jeong KH, Park H, Kim Y, Kim MC, Kim KH. Software: Kim MC, Sim DS.
Supervision: Cho JG, Yoon HJ, Ahn Y, Park JC. Validation: Jeong KH, Yoon HJ, Yoon N.
Visualization: Park H. Writing - original draft:
Lee KH. Writing - review & editing: Cho JG, Park HW.
INTRODUCTION
Oral anticoagulants (OACs) is the mainstream therapy for the prevention of thromboembolism (TE) in patients with atrial fibrillation (AF).
1)2)Although use of non-vitamin K antagonist oral anticoagulants (NOACs) have been increasing, warfarin is the most important and fundamental OACs, because of its easy availability and cost-effectiveness. In patients with non-valvular AF, most guidelines recommend warfarin titration with an international normalized ratio (INR) 2.0 to 3.0 to maintain maximal efficacy for the prevention of TE and safety for the prevention of major bleeding. Also, mean time in the therapeutic range (TTR) should be kept high as possible.
However, Japanese pharmacotherapy guidelines for AF recommend different warfarin INR target range with 2.0 to 3.0 in patients younger than 70-year-old, 1.6 to 2.6 in patients older than 70-year-old, which reflect Japanese clinical results comparing lower intensity warfarin (INR 1.6–2.6) and standard intensity warfarin (INR 2.0–3.0).
3)Also, clinical trials at Hongkong and China suggested that lower intensity warfarin dose adjustment was suitable for Asian AF patients.
4-7)Those studies raised question that universal criteria with warfarin titration to INR 2.0 to 3.0 is ideal intensity in Asian AF patients, because universal criteria were almost drawn from western population, and did not consider ethnic difference. Asian patients have been known to be more vulnerable to major bleeding with OACs compared with western population.
8)9)Impact if anticoagulation intensity of warfarin in Korean AF patients remains unclear, because of limited data and population size. To identify impact of anticoagulation intensity of warfarin in Korean population, efficacy and safety were analyzed according to sub-divided warfarin INR and TTR groups in Korean non-valvular AF patients.
METHODS
Study population
A total of 2,971 patients with AF who had taken warfarin to prevent TE from January 2012 to December 2013 were initially included in a cross-sectional analysis at the Department of Neurology and Cardiology, Chonnam National University Hospital, Gwangju, Korea. A total of 710 patients (64.9±9.8 years old, 467 males) comprised the study population met both inclusion and exclusion criteria. The inclusion criteria were as follows: ≥18-year-old, CHA
2DS
2- VASc score ≥1, and warfarin medication as antithrombotic treatment. The criteria for exclusion included patients with valvular heart disease (mitral stenosis with more than moderate severity, prosthetic mitral valve replacement or repair), any OACs class change (from warfarin to NOACs, from NOACs to warfarin). The patients were followed for 2 years or until the first occurrence of any study outcome from the date of enrollment. Patients with follow-up loss were included in the analysis until the last follow-up period within 2 years or until the first occurrence of any study outcome from the date of enrollment. The study was approved by the ethics committee at Chonnam National University Hospital, Gwangju, Korea (CNUH-2017-078), where exempted informed consent from enrolled patients because of retrospective study protocol.
Definition
Primary efficacy end-point was TE, the composite of new-onset stroke and systemic
embolism (SE). New-onset stroke was defined as the sudden onset of a focal neurologic
deficit in a location consistent with the territory of a major cerebral artery and categorized as ischemic, hemorrhagic, or transient ischemic attack (TIA). SE was defined as an acute vascular occlusion of an extremity or organ, documented by means of imaging or surgery.
Primary safety end-point was major bleeding, defined according to the International Society on Thrombosis and Haemostasis criteria, as clinically overt bleeding accompanied by a decrease in the hemoglobin level 2 g/dL or transfusion of at least 2 units of packed red cells, occurring at a critical site, or resulting in death. Minor bleeding was defined as clinically overt bleeding which did not meet major bleeding criteria. Primary net-clinical outcome was defined as the composite of new-onset stroke and major bleeding. Secondary net-clinical outcome was defined as the composite of new-onset stroke, major bleeding, and death.
The degree of anticoagulation was measured as INR. The intensity of anticoagulation was calculated as the mean INR value and the mean time in TTR by a modified Rosendaal method of linear interpolation between each pair of measured INR values.
10)Median frequency of INR measurement was 12 (10–14) times with 49.7 days interval. The TTR1 was calculated as the portion of days with INR values between 2 and 3. The TTR2 was calculated as the portion of days with INR values between 1.6 and 2.6. The TTR3 was calculated as the portion of days with INR values between 1.6 and 2.6 in patients older than 70-year-old and between 2.0 and 3.0 in patients younger than 70-year-old. Optimal anticoagulation was defined as TTR
≥60%.
11)Chronic kidney disease (CKD) was defined as an estimated glomerular filtration rate
<60 mL/min obtained by using Chronic Kidney Disease Epidemiology Collaboration (CKD- EPI) equation.
Statistical analysis
For continuous variables, differences between groups were evaluated using an unpaired t-test or Mann-Whitney rank-sum test. For discrete variables, differences were expressed as counts and percentages, and were analyzed using a χ
2test or Fisher's exact between groups as appropriate. Crude incidence rate was calculated as the number of events divided by 100 person-years (percentage/year). Clinical outcomes were assessed according to TTR classified into 6 groups (<30%, 30–39.9%, 40–49.9%, 50–59.9%, 60–69.9%, ≥70%) and mean INR value classified into 5 groups (<1.6, 1.6–2.99, 2.0–2.59, 2.6–2.99, ≥3.0). Also, clinical outcomes were assessed according to dichtomous TTR and INR values. We constructed Kaplan-Meier curves for clinical outcomes and difference among the groups was assessed by log-rank test.
Overall statistical difference was measured by pooled over strata method, whereas statistical difference between each group was analyzed by pairwise over-strata method. Cox proportional hazards regression was used to analyze hazard ratios (HRs) as estimates for clinical outcomes.
We controlled for baseline clinical characteristics and CHA
2DS
2-VASc score in regression analysis. All potentially relevant variables included: age, sex, hypertension, diabetes mellitus, previous history of myocardial infarction (MI), heart failure, and stroke or TIA, malignancy, CKD and CHA
2DS
2-VASc score. All statistical analyses were performed using SPSS 21.0 (Statistical Package for the Social Sciences; SPSS-PC Inc, Chicago, IL, USA). All analyses were 2-tailed, with clinical significance defined as values of p<0.05.
RESULTS
Baseline clinical characteristics
There was no difference in gender, age, prevalence of hypertension, smoking, previous
history of malignancy, MI, HF, TIA/stroke, and CKD among the 5 INR groups. Also, mean
value of CHA
2DS
2-VASc score and creatinine clearance were not different among the 5 INR groups. However, the prevalence of diabetes mellitus was different among the 5 INR groups (34.9% vs. 18.0% vs. 19.6% vs. 6.8% vs. 19.0%, p=0.011) (Table 1).
Clinical outcomes according to international normalized ratio groups Annual incidence of TE was 1.8%, whereas that of major bleeding was 2.2%. Incidence rate of TE (12.9%/yr vs. 2.1%/yr vs. 3.0%/yr vs. 3.4%/yr vs. 0%/yr, p<0.001), new-onset stroke (12.9%/yr vs. 1.4%/yr vs. 3.0%/yr vs. 3.4%/yr vs. 0%/yr, p<0.001) and embolic stroke (11.3%/
yr vs. 1.1%/yr vs. 2.6%/yr vs. 1.1%/yr vs. 0%/yr, p<0.001) were gradually decreased as higher INR groups. In contrast, incidence of major bleeding was gradually increased as higher INR groups (7.0%/yr vs. 3.7%/yr vs. 4.3% vs. 9.4% vs. 16.3%, p=0.035, Table 2, Figure 1). In dichotomous analysis, incidence of TE was significantly decreased when mean INR value was over 1.6 (18.6% vs. 4.0%, p<0.001). Also, incidence of major bleeding was significantly increased when mean INR value was over 2.6 (5.7% vs. 13.8%, p=0.006). Primary and (16.8%/
yr vs. 5.9%/yr vs. 6.8%/yr vs. 9.6%/yr vs. 13.1%/yr, p=0.037) secondary net-clinical outcome (20.5%/yr vs. 6.7%/yr vs. 7.1%/yr vs. 10.8%/yr vs. 16.3%/yr, p=0.037) were significantly different among the 5 groups (Table 2). Kaplan-Meier estimation demonstrated that
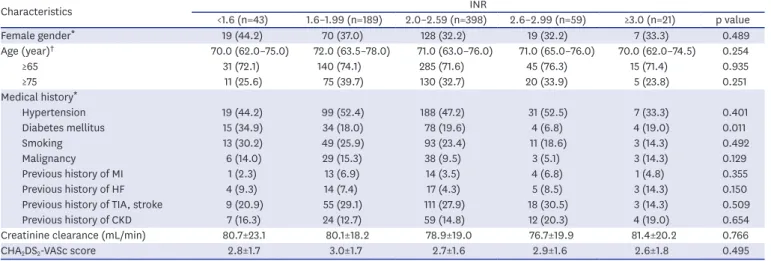
Table 1. Baseline clinical characteristicsCharacteristics INR
<1.6 (n=43) 1.6–1.99 (n=189) 2.0–2.59 (n=398) 2.6–2.99 (n=59) ≥3.0 (n=21) p value
Female gender
*19 (44.2) 70 (37.0) 128 (32.2) 19 (32.2) 7 (33.3) 0.489
Age (year)
†70.0 (62.0–75.0) 72.0 (63.5–78.0) 71.0 (63.0–76.0) 71.0 (65.0–76.0) 70.0 (62.0–74.5) 0.254
≥65 31 (72.1) 140 (74.1) 285 (71.6) 45 (76.3) 15 (71.4) 0.935
≥75 11 (25.6) 75 (39.7) 130 (32.7) 20 (33.9) 5 (23.8) 0.251
Medical history
*Hypertension 19 (44.2) 99 (52.4) 188 (47.2) 31 (52.5) 7 (33.3) 0.401
Diabetes mellitus 15 (34.9) 34 (18.0) 78 (19.6) 4 (6.8) 4 (19.0) 0.011
Smoking 13 (30.2) 49 (25.9) 93 (23.4) 11 (18.6) 3 (14.3) 0.492
Malignancy 6 (14.0) 29 (15.3) 38 (9.5) 3 (5.1) 3 (14.3) 0.129
Previous history of MI 1 (2.3) 13 (6.9) 14 (3.5) 4 (6.8) 1 (4.8) 0.355
Previous history of HF 4 (9.3) 14 (7.4) 17 (4.3) 5 (8.5) 3 (14.3) 0.150
Previous history of TIA, stroke 9 (20.9) 55 (29.1) 111 (27.9) 18 (30.5) 3 (14.3) 0.509
Previous history of CKD 7 (16.3) 24 (12.7) 59 (14.8) 12 (20.3) 4 (19.0) 0.654
Creatinine clearance (mL/min) 80.7±23.1 80.1±18.2 78.9±19.0 76.7±19.9 81.4±20.2 0.766
CHA
2DS
2-VASc score 2.8±1.7 3.0±1.7 2.7±1.6 2.9±1.6 2.6±1.8 0.495
Values are presented as number (%) or mean±standard deviation.
CKD = chronic kidney disease; HF = heart failure; INR = international normalized ratio; MI = myocardial infarction; TIA = transient ischemic attack.
*
Comparison made using χ
2test;
†Median (25% to 75% percentiles), comparison made using Mann-Whitney test.
Table 2. Clinical outcomes according to INR groups
Clinical outcomes INR
<1.6 (n=43) 1.6–1.99 (n=189) 2.0–2.59 (n=398) 2.6–2.99 (n=59) ≥3.0 (n=21) p value
‡Thromboembolism 8 (12.9)
§6 (2.1) 18 (3.0) 3 (3.4) 0 <0.001
Systemic embolism 0 2 (0.7) 0 0 0 0.230
New-onset stroke 8 (12.9)
§4 (1.4) 18 (3.0) 3 (3.4) 0 <0.001
Embolic stroke 7 (11.3)
§3 (1.1) 16 (2.6) 1 (1.1) 0 <0.001
Hemorrhagic stroke 1 (1.6) 1 (0.4) 3 (0.5) 2 (2.2) 0 0.273
Major bleeding 4 (7.0) 9 (3.7) 23 (4.3) 7 (9.4) 4 (16.3)
§0.035
Mortality 3 (5.6) 4 (1.6) 9 (1.6) 2 (2.4) 2 (6.5) 0.107
Primary net-clinical outcome
*9 (16.8)
§15 (5.9) 38 (6.8) 8 (9.6) 4 (13.1) 0.037
Secondary net-clinical outcome
†11 (20.5)
§17 (6.7) 40 (7.1) 9 (10.8) 5 (16.3) 0.003
Values are presented as number (%/yr).
INR = international normalized ratio.
*
Primary net-clinical outcome was defined as the composite of new-onset stroke and major bleeding;
†Secondary net-clinical outcome was defined as the
composite of new-onset stroke, major bleeding and death;
‡p value by log-rank test;
§p<0.01 by log-rank test, reference group as INR 1.6–1.99.
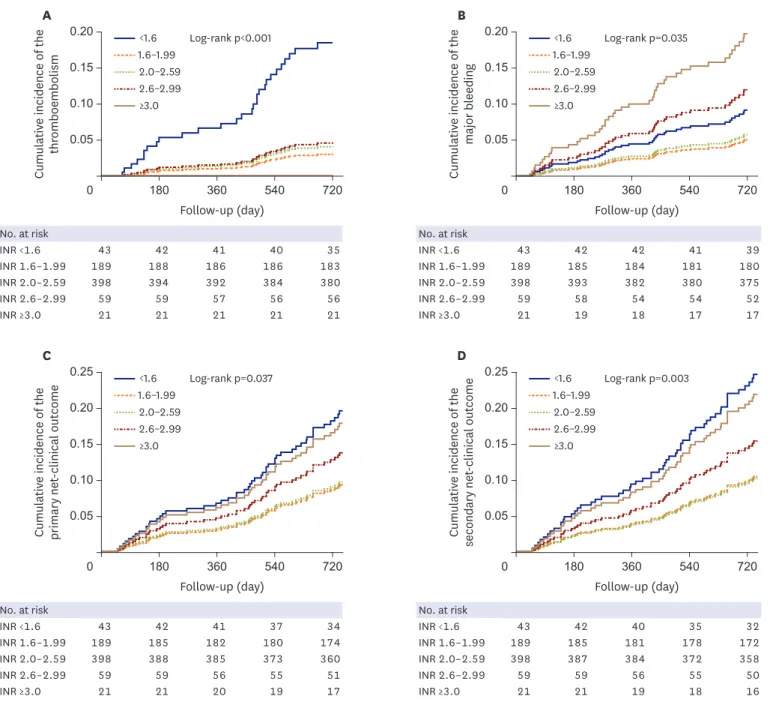
cumulative incidences of the TE (log-rank p<0.001; Figure 2A), major bleeding (log-rank p=0.035; Figure 2B), primary (log-rank p=0.037, Figure 2C) and secondary net-clinical outcome (log-rank p=0.003, Figure 2D) were significantly different among the 5 different INR groups. Cumulative incidence of TE was significantly higher in patients with INR <1.6.
Cumulative incidences of major bleeding, primary net-clinical outcome and secondary net-clinical outcome were lowest in patient with INR 1.6–1.99 and INR 2.0–2.59. Because cumulative incidences of major bleeding, primary net-clinical outcome and secondary net-clinical outcome between the patients with INR 1.6–1.99 and INR 2.0–2.59 was almost similar, both groups were entered into dichotomous group analysis as one group.
Clinical outcomes according to international normalized ratio dichotomous groups
Baseline characteristics and clinical outcomes were analyzed by the dichotomous INR groups. There was no difference in gender, age, prevalence of hypertension, diabetes mellitus, smoking, previous history of malignancy, MI, TIA/stroke, and CKD between the patients with INR 1.6–2.6 and patients with INR <1.6 or >2.6. However, previous history of HF was more common in patients with INR 1.6–2.6. There was no difference in gender, age, prevalence of hypertension, diabetes mellitus, smoking, previous history of MI, HF, TIA/
stroke, and CKD between the patients with INR 2.0–3.0 and patients with INR <2.0 or >3.0.
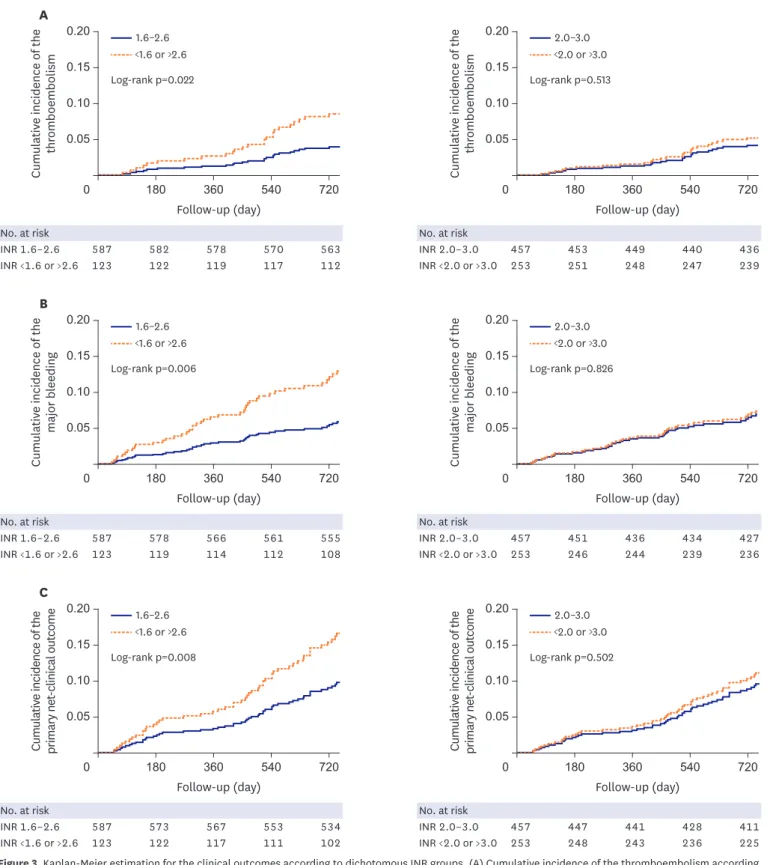
However, previous history of malignancy was more common in patients with INR 2.0–3.0 (Supplementary Table 1). When patients were divided into the 2 groups as mean INR 1.6 to 2.6 and INR less than 1.6 or more than 2.6, patients with INR 1.6 to 2.6 had significantly lower incidence of TE (2.7%/yr vs. 6.0%/yr, log-rank p=0.022; Figure 3A), new-onset stroke (2.5%/yr vs. 6.0%, log-rank p=0.012), major bleeding (4.2%/yr vs. 9.6%/yr, log-rank p=0.006;
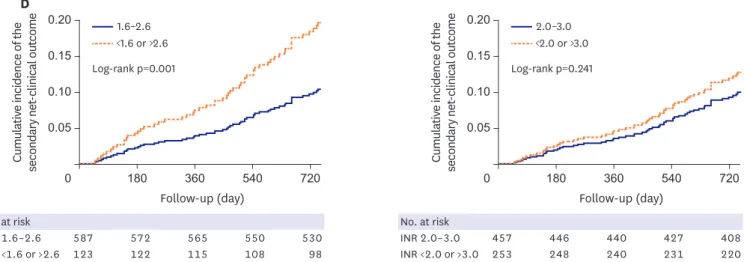
Figure 3B), mortality (1.6%/yr vs. 4.2%/yr, log-rank p=0.029), primary net-clinical outcome (6.5%/yr vs. 12.6%/yr, log rank p=0.008; Figure 3C) and secondary net-clinical outcome (7.0%/
yr vs. 14.9%/yr, log-rank p=0.001; Figure 3D) compared with patients with mean INR less than 1.6 or more than 2.6 (Table 3). When patients were divided into the 2 groups as mean INR 2.0 to 3.0 and INR less than 2.0 or more than 3.0, there was no difference in the incidence of TE, SE, new-onset stroke, embolic stroke, hemorrhagic stroke, major bleeding, mortality, primary net-clinical outcome and secondary net-clinical outcome (Figure 3, Table 3).
HR
0
INR
Thromboembolism Major bleeding
>3.0 14
2.6–2.99 2.0–2.59
<1.6 2.6
1.5
3.0
1.6
8.4
1.3 0 12.0
1.0 12
10 8 6 4 2
1.6–1.99
Figure 1. Adjusted HR for thromboembolism and major bleeding in relation to INR. HR of thromboembolism and
major bleeding were analyzed by comparison with INR 1.6–1.99 and adjusted by CHA
2DS
2-VASc score, age, sex, previous history of hypertension, diabetes mellitus, myocardial infarction, stroke or transient ischemic stroke, heart failure, malignancy, and chronic kidney disease.
HR = hazard ratio; INR = international normalized ratio.
Independent impact of INR intensity as 1.6–2.6 and 2.0–3.0 on the clinical outcomes were analyzed after co-variate adjustment in Cox model. Mean INR 1.6 to 2.6 was significantly associated with the reduced risk of TE (adjusted HR, 0.40; 95% confidence interval [CI], 0.19–0.85), new-onset stroke (HR, 0.36; 95% CI, 0.17–0.77), major bleeding (HR, 0.43;
95% CI, 0.23–0.81), mortality (HR, 0.35; 95% CI, 0.14–0.92), primary (HR, 0.50; 95% CI, 0.29–0.84) and secondary net-clinical outcome (HR, 0.45; 95% CI, 0.28–0.74). However, mean INR 2.0 to 3.0 was not associated with the risk reduction of TE, new-onset stroke, major bleeding, mortality, primary and secondary net-clinical outcome (Table 3).
Cumulativ e incidence of the major bl eeding 0
B
Follow-up (day) A
0 720
Cumulativ e incidence of the thr omboembolism
360
Follow-up (day) 0.20
0.15
0.10
0.05
720 540
180 0.20
0.15
0.10
0.05
540
180 360
Cumulativ e incidence of the secondary net -clinical out come 0
D
Follow-up (day) C
0 720
Cumulativ e incidence of the primary net -clinical out come 0.25
360
Follow-up (day) 0.20
0.15
0.10
0.05
720 0.25
540 180
0.20
0.15
0.10
0.05
540
180 360
<1.6 1.6–1.99 2.0–2.59 2.6–2.99
≥3.0
<1.6 1.6–1.99
2.0–2.59 2.6–2.99
≥3.0
<1.6 1.6–1.99 2.0–2.59 2.6–2.99
≥3.0
<1.6 1.6–1.99
2.0–2.59 2.6–2.99
≥3.0
Log-rank p<0.001 Log-rank p=0.035
Log-rank p=0.037 Log-rank p=0.003
No. at risk
INR <1.6 43 42 41 40 35
INR 1.6–1.99 189 188 186 186 183
INR 2.0–2.59 398 394 392 384 380
INR 2.6–2.99 59 59 57 56 56
INR ≥3.0 21 21 21 21 21
No. at risk
INR <1.6 43 42 41 37 34
INR 1.6–1.99 189 185 182 180 174
INR 2.0–2.59 398 388 385 373 360
INR 2.6–2.99 59 59 56 55 51
INR ≥3.0 21 21 20 19 17
No. at risk
INR <1.6 43 42 42 41 39
INR 1.6–1.99 189 185 184 181 180
INR 2.0–2.59 398 393 382 380 375
INR 2.6–2.99 59 58 54 54 52
INR ≥3.0 21 19 18 17 17
No. at risk
INR <1.6 43 42 40 35 32
INR 1.6–1.99 189 185 181 178 172
INR 2.0–2.59 398 387 384 372 358
INR 2.6–2.99 59 59 56 55 50
INR ≥3.0 21 21 19 18 16
Figure 2. Kaplan-Meier estimation for the clinical outcomes according to mean INR groups. (A) Cumulative incidence of the thromboembolism according to 5
INR groups. (B) Cumulative incidence of the major bleeding according to 5 INR groups. (C) Cumulative incidence of the primary net-clinical outcome according to 5 INR groups. (D) Cumulative incidence of the secondary net-clinical outcome according to 5 INR groups.
INR = international normalized ratio.
Cumulativ e incidence of the thr omboembolism 0 Follow-up (day)
A
0 720
Cumulativ e incidence of the thr omboembolism
360
Follow-up (day) 0.20
0.15
0.10
0.05
720 540
180 0.20
0.15
0.10
0.05
540
180 360
2.0–3.0
<2.0 or >3.0
Log-rank p=0.022 Log-rank p=0.513
1.6–2.6
<1.6 or >2.6
Cumulativ e incidence of the major bl eeding 0 Follow-up (day)
B
0 720
Cumulativ e incidence of the major bl eeding
360
Follow-up (day) 0.20
0.15
0.10
0.05
720 540
180 0.20
0.15
0.10
0.05
540
180 360
1.6–2.6
<1.6 or >2.6
2.0–3.0
<2.0 or >3.0
Log-rank p=0.006 Log-rank p=0.826
Cumulativ e incidence of the primary net -clinical out come 0 Follow-up (day)
C
0 720
Cumulativ e incidence of the primary net -clinical out come
360
Follow-up (day) 0.20
0.15
0.10
0.05
720 540
180 0.20
0.15
0.10
0.05
540
180 360
1.6–2.6
<1.6 or >2.6
2.0–3.0
<2.0 or >3.0
Log-rank p=0.008 Log-rank p=0.502
No. at risk
INR 2.0–3.0 457 453 449 440 436
INR <2.0 or >3.0 253 251 248 247 239
No. at risk
INR 2.0–3.0 457 451 436 434 427
INR <2.0 or >3.0 253 246 244 239 236
No. at risk
INR 2.0–3.0 457 447 441 428 411
INR <2.0 or >3.0 253 248 243 236 225
No. at risk
INR 1.6–2.6 587 578 566 561 555
INR <1.6 or >2.6 123 119 114 112 108
No. at risk
INR 1.6–2.6 587 582 578 570 563
INR <1.6 or >2.6 123 122 119 117 112
No. at risk
INR 1.6–2.6 587 573 567 553 534
INR <1.6 or >2.6 123 122 117 111 102
Figure 3. Kaplan-Meier estimation for the clinical outcomes according to dichotomous INR groups. (A) Cumulative incidence of the thromboembolism according
to dichotomous INR groups. (B) Cumulative incidence of the major bleeding according to dichotomous INR groups. (C) Cumulative incidence of the primary net- clinical outcome according to dichotomous INR groups. (D) Cumulative incidence of the secondary net-clinical outcome according to dichotomous INR groups.
INR = international normalized ratio. (continued to the next page)
Clinical outcomes according to therapeutic range
Clinical outcomes were analyzed by the 6 different TTR groups. By the analysis based on TTR1, there was no difference in the incidence of TE, SE, new-onset stroke, embolic stroke, hemorrhagic stroke, major bleeding, mortality, primary net-clinical outcome and secondary net-clinical outcome among the 6 different TTR groups. By the analysis based on TTR2 and TTR 3, there was no difference in the incidence of TE, SE, new-onset stroke, embolic stroke, hemorrhagic stroke, major bleeding, mortality and primary net-clinical outcome among the 6 different TTR groups. However, incidence of the secondary net-clinical outcome was significantly different among the 6 different TTR2 groups (9.3%/yr vs. 15.9%/yr vs. 7.5%/yr vs.
9.9%/yr vs. 7.6%/yr vs. 4.9%/yr, p=0.012) and TTR 3 groups (10.8%/yr vs. 12.5%/yr vs. 6.9%/yr vs. 8.6%/yr vs. 6.6%/yr vs. 3.8%/yr, p=0.031) (Supplementary Table 2).
Clinical outcomes according to therapeutic range dichotomous groups Adjusted clinical outcomes were analyzed by the dichotomous TTR groups as 70%. All of 3 TTR system with ≥70% was not associated with the risk reduction of TE. However, all of TTR
Table 3. Clinical outcomes according to INR dichotomous groupsClinical outcomes INR
1.6–2.6
(n=587) <1.6 or >2.6
(n=123) p value
‡Adjusted HR
§(95% CI) p value 2.0–3.0
(n=457) <2.0 or >3.0
(n=253) p value
‡Adjusted HR
§(95% CI) p value Thromboembolism 24 (2.7) 11 (6.0) 0.022 0.40 (0.19–0.85) 0.017 21 (3.0) 14 (3.7) 0.513 0.86 (0.43–1.74) 0.676
Systemic embolism 2 (0.2) 0 0.522 - - 0 2 (0.5) 0.053 - -
New-onset stroke 22 (2.5) 11 (6.0) 0.012 0.36 (0.17–0.77) 0.009 21 (3.0) 12 (3.2) 0.845 0.98 (0.47–2.06) 0.957 Embolic stroke 19 (2.1) 8 (4.4) 0.078 0.42 (0.18–1.02) 0.055 17 (2.4) 10 (2.7) 0.803 0.91 (0.40–2.08) 0.829 Hemorrhagic stroke 4 (0.5) 3 (1.6) 0.068 0.28 (0.06–1.30) 0.103 5 (0.7) 2 (0.5) 0.729 1.24 (0.21–7.34) 0.816 Major bleeding 32 (4.2) 15 (9.6) 0.006 0.43 (0.23–0.81) 0.009 30 (5.0) 17 (5.3) 0.826 0.90 (0.49–1.67) 0.742
Mortality 13 (1.6) 7 (4.2) 0.029 0.35 (0.14–0.92) 0.033 11 (1.7) 9 (2.7) 0.299 0.75 (0.30–1.84) 0.526
Primary net-clinical outcome
*53 (6.5) 21 (12.6) 0.008 0.50 (0.29–0.84) 0.008 46 (7.1) 28 (8.3) 0.502 0.95 (0.59–1.54) 0.831 Secondary net-clinical outcome
†57 (7.0) 25 (14.9) 0.001 0.45 (0.28–0.74) 0.001 49 (7.6) 33 (9.8) 0.241 0.87 (0.55–1.36) 0.531 Values are presented as number (%/yr).
CI = confidence interval; HR = hazard ratio; INR = international normalized ratio.
*
Primary net-clinical outcome was defined as the composite of new-onset stroke and major bleeding;
†Secondary net-clinical outcome was defined as the composite of new-onset stroke, major bleeding and death;
‡p value by log-rank test;
§Each clinical outcome was adjusted by CHA
2DS
2-VASc score, age, sex, previous history of hypertension, diabetes mellitus, myocardial infarction, stroke or transient ischemic stroke, heart failure, malignancy, and chronic kidney disease.
Cumulativ e incidence of the secondary net -clinical out come 0 Follow-up (day)
D
0 720
Cumulativ e incidence of the secondary net -clinical out come
360
Follow-up (day) 0.20
0.15
0.10
0.05
720 540
180 0.20
0.15
0.10
0.05
540
180 360
1.6–2.6
<1.6 or >2.6
2.0–3.0
<2.0 or >3.0
Log-rank p=0.001 Log-rank p=0.241
No. at risk
INR 1.6–2.6 587 572 565 550 530
INR <1.6 or >2.6 123 122 115 108 98
No. at risk
INR 2.0–3.0 457 446 440 427 408
INR <2.0 or >3.0 253 248 240 231 220
Figure 3. (Continued) Kaplan-Meier estimation for the clinical outcomes according to dichotomous INR groups. (A) Cumulative incidence of the
thromboembolism according to dichotomous INR groups. (B) Cumulative incidence of the major bleeding according to dichotomous INR groups. (C) Cumulative incidence of the primary net-clinical outcome according to dichotomous INR groups. (D) Cumulative incidence of the secondary net-clinical outcome according to dichotomous INR groups.
INR = international normalized ratio.
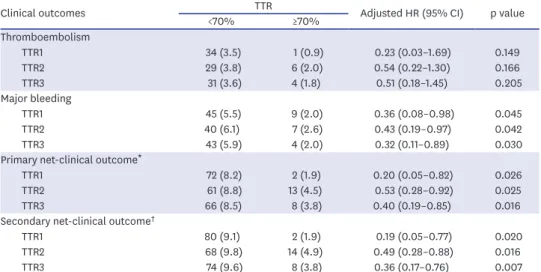
system with ≥70% was associated with the reduced risk of major bleeding (TTR1: HR, 0.36, 95% CI, 0.08–0.98; TTR2: HR, 0.43, 95% CI, 0.19–0.97; TTR3: HR, 0.32, 95% CI, 0.11–0.89).
All of TTR system with ≥70% was associated with the reduced risk of primary net-clinical outcome (TTR1: HR, 0.20, 95% CI, 0.05–0.82; TTR2: HR, 0.53, 95% CI, 0.28–0.92; TTR3:
HR, 0.40, 95% CI, 0.19–0.85). All of TTR system with ≥70% was associated with the reduced risk of secondary net-clinical outcome (TTR1: HR, 0.19, 95% CI, 0.05–0.77; TTR2: HR, 0.49, 95% CI, 0.28–0.88; TTR3: HR, 0.36, 95% CI, 0.17–0.76) (Table 4).
Clinical outcomes according to combined anticoagulation intensity with international normalized ratio and therapeutic range
Clinical outcomes satisfying both INR and TTR or not was analyzed. Satisfied INR was defined as mean INR 1.6–2.6 or mean INR 2.0–3.0. Satisfied TTR was defined as TTR
≥70%. Combined anticoagulation intensity with mean INR 1.6–2.6 or mean INR 2.0–3.0 and TTR ≥70% was classified as satisfied anticoagulation intensity. If any of above criteria is not met, they were classified as non-satisfied anticoagulation intensity. Satisfying anticoagulation intensity with mean INR 1.6–2.6 and TTR ≥70% was associated with significantly reduced risk of major bleeding (2.6% vs. 6.1%, HR, 0.43, 95% CI, 0.19–0.96, p=0.039), primary (4.6% vs. 8.7%, HR, 0.53, 95% CI, 0.29–0.96, p=0.037) and secondary net-clinical outcomes (4.9% vs. 9.7%, HR, 0.51, 95% CI, 0.29–0.91, p=0.022). However, satisfying anticoagulation intensity with mean INR 1.6–2.6 and TTR ≥70% was not associated with the risk reduction of TE. Satisfying anticoagulation intensity with mean INR 2.0–3.0 and TTR ≥70% was associated with significantly reduced risk of primary (1.9%
vs. 8.2%, HR, 0.20, 95% CI, 0.05–0.83, p=0.026) and secondary net-clinical outcomes (1.9% vs. 9.1%, HR, 0.19, 95% CI, 0.05–0.77, p=0.020). However, satisfying anticoagulation intensity with mean INR 2.0–3.0 and TTR ≥70% was not associated with the risk reduction of TE and major bleeding (Table 5).
Table 4. Clinical outcomes according to the time in the TTR 70%
Clinical outcomes <70% TTR ≥70% Adjusted HR (95% CI) p value
Thromboembolism
TTR1 34 (3.5) 1 (0.9) 0.23 (0.03–1.69) 0.149
TTR2 29 (3.8) 6 (2.0) 0.54 (0.22–1.30) 0.166
TTR3 31 (3.6) 4 (1.8) 0.51 (0.18–1.45) 0.205
Major bleeding
TTR1 45 (5.5) 9 (2.0) 0.36 (0.08–0.98) 0.045
TTR2 40 (6.1) 7 (2.6) 0.43 (0.19–0.97) 0.042
TTR3 43 (5.9) 4 (2.0) 0.32 (0.11–0.89) 0.030
Primary net-clinical outcome
*TTR1 72 (8.2) 2 (1.9) 0.20 (0.05–0.82) 0.026
TTR2 61 (8.8) 13 (4.5) 0.53 (0.28–0.92) 0.025
TTR3 66 (8.5) 8 (3.8) 0.40 (0.19–0.85) 0.016
Secondary net-clinical outcome
†TTR1 80 (9.1) 2 (1.9) 0.19 (0.05–0.77) 0.020
TTR2 68 (9.8) 14 (4.9) 0.49 (0.28–0.88) 0.016
TTR3 74 (9.6) 8 (3.8) 0.36 (0.17–0.76) 0.007
Each clinical outcome was adjusted by CHA
2DS
2-VASc score, age, sex, previous history of hypertension, diabetes mellitus, myocardial infarction, stroke or transient ischemic stroke, heart failure, malignancy, and chronic kidney disease. Values are presented as number (%/yr).
CI = confidence interval; HR = hazard ratio; TTR = therapeutic range.
*
Primary net-clinical outcome was defined as the composite of new-onset stroke and major bleeding;
†Secondary
net-clinical outcome was defined as the composite of new-onset stroke, major bleeding and death.
DISCUSSION
Optimal intensity of anticoagulation with warfarin has been recommended from clinical trials conducted in Caucasian population, and adopted for all ethnic groups without verification at different ethnic groups.
12-16)There is only one recommendation with the intensity of anticoagulation with warfarin for Asian population, which recommends lower anticoagulation intensity of warfarin (INR 1.6–2.6).
3)However, this recommendation was derived from clinical trials which used baseline or mean INR before and after index events for analysis, which could not reflect whole status of anticoagulation.
17)18)J-RHYTHM registry, newly initiated in Japan is expected to identify optimal intensity of anticoagulation.
19)Therefore, this recommendation needs consolidation with more data in Asian population. To overcome those pitfalls in Asian anticoagulation guideline with warfarin, we analyzed events rates according to mean INR values and TTR during 2-year follow-up to evaluate optimal intensity of anticoagulation with warfarin in Korean population.
Most guidelines suggest INR 2.0 to 3.0 as optimal anticoagulation intensity with warfarin in non-valvular AF patients. Lowest effective TTR of warfarin INR 2.0 need re-consideration.
The European Atrial Fibrillation Trial Study (EAFT) group indicated no treatment effect with warfarin INR lower than 2.0.
20)However, those trials did not consider sub-specific range of warfarin INR below 2.0. They compared events rate between INR 1.0 to 1.9 and INR above 2.0. The third Stroke Prevention in Atrial Fibrillation (SPAF III) trial analyzed efficacy of warfarin in sub-divided group below 2.0, and demonstrated that patients with INR 1.5 to 1.9 had lower TE events than patients with INR below 1.5.
21)Also, fundamental studies consisting current recommendation evaluated efficacy and safety of low intensity anticoagulation with warfarin INR 1.2 to 1.5, both concluded that low-intensity warfarin is highly effective for the prevention of TE without an excess risk of major bleeding.
13)16)Most of clinical trials conducted in Asia suggested lowest effective TTR of warfarin INR less than 2.0. Optimal lowest effective warfarin INR was 1.6 in Japanese trials, and 1.8 in Chinese and Hongkong trials.
4)5)17)18)The present study also demonstrated consistent results with Asian studies, with lowest effective anticoagulation intensity with warfarin INR as 1.6. Therefore, lowest effective TTR of warfarin INR 2.0 should be reconsidered in Korean population.
Asians have inherited increased risk of major bleeding with double risk of intracranial hemorrhage after warfarin medication compared with Caucasian.
6)8)9)It had been explained by the polymorphism of certain genes, cytochrome P450 complex subunit 2C9 (CYP2C9),
Table 5. Clinical outcomes according to international normalized ratio (INR) dichotomous groups and time in the TTRClinical outcomes INR 1.6–2.6 &
TTR ≥70% (n=198) INR <1.6 or >2.6 or
TTR <70% (n=512) Adjusted HR
(95% CI) p value INR 2.0–3.0 &
TTR ≥70% (n=69) INR <2.0 or >3.0 or
TTR <70% (n=641) Adjusted HR (95% CI) p value
Thromboembolism 6 (2.0) 29 (3.8) 0.54 (0.22–1.32) 0.177 1 (0.9) 34 (3.5) 0.23 (0.03–1.72) 0.154
Systemic embolism 0 2 (0.3) - - 0 2 (0.2) - -
New-onset stroke 6 (2.0) 27 (3.6) 0.59 (0.24–1.43) 0.240 1 (0.9) 32 (3.3) 0.25 (0.03–1.80) 0.167
Embolic stroke 5 (1.7) 22 (2.9) 0.60 (0.22–1.60) 0.305 0 27 (2.8) - -
Hemorrhagic stroke 1 (0.3) 6 (0.8) 0.63 (0.07–5.62) 0.681 1 (0.9) 6 (0.6) 2.28 (0.23–22.48) 0.481
Major bleeding 7 (2.6) 40 (6.1) 0.43 (0.19–0.96) 0.039 2 (2.0) 45 (5.5) 0.31 (0.07–1.27) 0.103
Mortality 1 (0.4) 19 (2.7) 0.14 (0.02–1.01) 0.051 1 (1.0) 19 (2.2) 0.45 (0.06–3.44) 0.444
Primary net-clinical outcome
*13 (4.6) 61 (8.7) 0.53 (0.29–0.96) 0.037 2 (1.9) 72 (8.2) 0.20 (0.05–0.83) 0.026 Secondary net-clinical outcome
†14 (4.9) 68 (9.7) 0.51 (0.29–0.91) 0.022 2 (1.9) 80 (9.1) 0.19 (0.05–0.77) 0.020 Each clinical outcome was adjusted by CHA
2DS
2-VASc score, age, sex, previous history of hypertension, diabetes mellitus, myocardial infarction, stroke or transient ischemic stroke, heart failure, malignancy, and chronic kidney disease. Values are presented as number (%/yr).
*
Primary net-clinical outcome was defined as the composite of new-onset stroke and major bleeding;
†Secondary net-clinical outcome was defined as the
composite of new-onset stroke, major bleeding and death.
vitamin K epoxide reductase complex subunit 1 (VKORC1) and gamma-glutamyl carboxylase (GGCX).
22)Recently, genetic differences was found between Korean and Western AF patients through genome-wide association study, which is expected to explain increased risk of bleeding with warfarin in Korean AF patients.
23)According to those studies, Korean AF patients appear to require lower intensity anticoagulation with warfarin.
Risk of major bleeding significantly increased with INR more than 2.6 in the present study. A prospective trial conducted in Japan demonstrated that average prothrombin time-INR more than 2.27 was an independent risk factor for major bleeding with warfarin medication.
24)A retrospective study conducted in Hongkong revealed upper effective TTR of warfarin INR as 2.4.
4)A J-RHYTHM registry analysis showed that risk of major bleeding was significantly increased when warfarin INR was over 2.6.
25)Another J-RHYTHM registry analysis included 7,516 non-valvular AF patient also demonstrated that effective TTR of warfarin was INR 1.6 to 2.6, which reflect different point of view from Japanese AF medication guideline.
26)Those results were consistent when the analysis was confined to patients older than 70-year-old. Also, subgroup analysis from J-RHYTHM registry consisted of 407 valvular AF patients, optimal anticoagulation range with warfarin was INR 1.6 to 2.6.
27)However, major bleeding in patients with INR <1.6 was higher than patients with INR 1.6–1.99 or INR 2.0–2.59 in the present study.
It is possible that patients with bleeding risk maintained low INR. Actually, patients with INR
<2.0 had higher prevalence of malignancy (15.1% vs. 9.2%, p=0.019), gastrointestinal cancer (5.6% vs. 2.5%, p=0.036) without differences in the prevalence of hepatobiliary tract cancer, solid organ cancer, genitourinary cancer and hematologic malignancy. Therefore, all possible risk factors including malignancy, CKD as well as age, hypertension, diabetes mellitus, previous history of stroke were entered into logistric regression analysis. Nevertheless, major bleeding was still significantly lower in patients with INR 1.6–2.6 than INR <1.6 or >2.6.
Synthesis of all of above results conducted in Asia suggest optimal anticoagulation intensity with warfarin as INR 1.6 to 2.6, consistent with the result of the present study. However, above studies did not consider mean INR values and TTR, which reflect whole status and change of anticoagulation intensity.
19)25-27)To overcome above pitfalls, we utilized mean INR values and TTR. Then, combined anticoagulation intensity composed of mean INR and TTR was evaluated. Although satisfying mean INR 1.6–2.6 and TTR ≥70% was better to predict major bleeding than satisfying mean INR 2.0–3.0 and TTR ≥70%, the other clinical outcomes including TE, primary and secondary net-clinical outcomes were not different between the 2 groups. Therefore, it is hard to conclude that mean INR 1.6–2.6 is better than 2.0–3.0, because combined anticoagulation intensity with TTR ≥70% was similar between the 2 groups. At most, the present study can suggest that mean INR 1.6–2.6 was not inferior to mean INR 2.0–3.0. Hopefully, nationwide multicenter multi-center, prospective study comparing low intensity warfarin (INR 1.6–2.6) and standard intensity warfarin (INR 2.0–
3.0) is now ongoing. After completion of prospective study, we can know that low intensity warfarin can be potential alternative to standard intensity warfarin.
Some limitations of the present study need to be addressed. First, the present study was analyzed retrospectively. Also, sample size was relatively small, which limited statistical power among each INR groups. Therefore, it could not clearly conclude what is optimal anticoagulation intensity with warfarin in Korean population. The results of the present study only suggest that mean INR 1.6–2.6 was not inferior to mean INR 2.0–3.0 in Korean population.
Nonetheless, no difference of baseline clinical characteristics among INR groups, co-variate
adjustment and utilization of 3 different TTR values strengthened the result of the present
study. To overcome inherited pitfalls of retrospective study design, prospective, randomized trial is ongoing in Korea including 22 representing centers. Second, time interval between each INR check was relatively long. It might influence accurate estimation of TTR.
In conclusions, mean INR 1.6–2.6 was better than mean INR 2.0–3.0 for the prevention of TE and major bleeding. TTR ≥70% was associated with the reduced risk of major bleeding, primary net-clinical outcome and secondary net-clinical outcome with no difference in the risk of TE. Combined anticoagulation intensity with INR 1.6–2.6 and TTR ≥70% had similar clinical outcomes to INR 2.0–3.0 and TTR ≥70% in Korean patients with non-valvular AF.
SUPPLEMENTARY MATERIALS
Supplementary Table 1 Baseline clinical characteristics Click here to view
Supplementary Table 2
Clinical outcomes according to the time in TTR Click here to view
REFERENCES
1. Kirchhof P, Benussi S, Kotecha D, et al. 2016 ESC guidelines for the management of atrial fibrillation developed in collaboration with EACTS. Eur Heart J 2016;37:2893-962.
PUBMED | CROSSREF
2. January CT, Wann LS, Alpert JS, et al. 2014 AHA/ACC/HRS guideline for the management of patients with atrial fibrillation: a report of the American College of Cardiology/American Heart Association Task Force on practice guidelines and the Heart Rhythm Society. Circulation 2014;130:e199-267.
PUBMED
3. JCS Joint Working Group. Guidelines for pharmacotherapy of atrial fibrillation (JCS 2013). Circ J 2014;78:1997-2021.
PUBMED | CROSSREF
4. You JH, Chan FW, Wong RS, Cheng G. Is INR between 2.0 and 3.0 the optimal level for Chinese patients on warfarin therapy for moderate-intensity anticoagulation? Br J Clin Pharmacol 2005;59:582-7.
PUBMED | CROSSREF
5. Chenhsu RY, Chiang SC, Chou MH, Lin MF. Long-term treatment with warfarin in Chinese population.
Ann Pharmacother 2000;34:1395-401.
PUBMED | CROSSREF
6. Poller L, Taberner DA. Dosage and control of oral anticoagulants: an international collaborative survey. Br J Haematol 1982;51:479-85.
PUBMED | CROSSREF
7. Gan GG, Teh A, Goh KY, Chong HT, Pang KW. Racial background is a determinant factor in the maintenance dosage of warfarin. Int J Hematol 2003;78:84-6.
PUBMED | CROSSREF
8. Capodanno D, Angiolillo DJ. Impact of race and gender on antithrombotic therapy. Thromb Haemost 2010;104:471-84.
PUBMED | CROSSREF
9. Lip GY, Wang KL, Chiang CE. Non-vitamin K antagonist oral anticoagulants (NOACs) for stroke prevention in Asian patients with atrial fibrillation: time for a reappraisal. Int J Cardiol 2015;180:246-54.
PUBMED | CROSSREF
10. Rosendaal FR, Cannegieter SC, van der Meer FJ, Briët E. A method to determine the optimal intensity of oral anticoagulant therapy. Thromb Haemost 1993;69:236-9.
PUBMED | CROSSREF
11. Cabral KP, Ansell J, Hylek EM. Future directions of stroke prevention in atrial fibrillation: the potential impact of novel anticoagulants and stroke risk stratification. J Thromb Haemost 2011;9:441-9.
PUBMED | CROSSREF
12. Petersen P, Godtfredsen J, Boysen G, Andersen ED, Andersen B. Placebo-controlled, randomised trial of warfarin and aspirin for prevention of thromboembolic complications in chronic atrial fibrillation. The Copenhagen AFASAK study. Lancet 1989;1:175-9.
PUBMED | CROSSREF
13. Boston Area Anticoagulation Trial for Atrial Fibrillation Investigators, Singer DE, Hughes RA, et al. The effect of low-dose warfarin on the risk of stroke in patients with nonrheumatic atrial fibrillation. N Engl J Med 1990;323:1505-11.
PUBMED | CROSSREF
14. Stroke prevention in atrial fibrillation study. Final results. Circulation 1991;84:527-39.
PUBMED | CROSSREF
15. Connolly SJ, Laupacis A, Gent M, Roberts RS, Cairns JA, Joyner C. Canadian Atrial Fibrillation Anticoagulation (CAFA) study. J Am Coll Cardiol 1991;18:349-55.
PUBMED | CROSSREF
16. Ezekowitz MD, Bridgers SL, James KE, et al. Warfarin in the prevention of stroke associated with nonrheumatic atrial fibrillation. N Engl J Med 1992;327:1406-12.
PUBMED | CROSSREF
17. Yamaguchi T; Japanese Nonvalvular Atrial Fibrillation-Embolism Secondary Prevention Cooperative Study Group. Optimal intensity of warfarin therapy for secondary prevention of stroke in patients with nonvalvular atrial fibrillation: a multicenter, prospective, randomized trial. Stroke 2000;31:817-21.
PUBMED | CROSSREF
18. Yasaka M, Minematsu K, Yamaguchi T. Optimal intensity of international normalized ratio in warfarin therapy for secondary prevention of stroke in patients with non-valvular atrial fibrillation. Intern Med 2001;40:1183-8.
PUBMED | CROSSREF
19. Atarashi H, Inoue H, Okumura K, Yamashita T, Origasa H; J-RHYTHM Registry Investigators.
Investigation of optimal anticoagulation strategy for stroke prevention in Japanese patients with atrial fibrillation--the J-RHYTHM Registry study design. J Cardiol 2011;57:95-9.
PUBMED | CROSSREF
20. European Atrial Fibrillation Trial Study Group. Optimal oral anticoagulant therapy in patients with nonrheumatic atrial fibrillation and recent cerebral ischemia. N Engl J Med 1995;333:5-10.
PUBMED | CROSSREF
21. Adjusted-dose warfarin versus low-intensity, fixed-dose warfarin plus aspirin for high-risk patients with atrial fibrillation: stroke prevention in atrial fibrillation III randomised clinical trial. Lancet 1996;348:633-8.
PUBMED | CROSSREF
22. Marín F, González-Conejero R, Capranzano P, Bass TA, Roldán V, Angiolillo DJ. Pharmacogenetics in cardiovascular antithrombotic therapy. J Am Coll Cardiol 2009;54:1041-57.
PUBMED | CROSSREF
23. Lee JY, Kim TH, Yang PS, et al. Korean atrial fibrillation network genome-wide association study for early- onset atrial fibrillation identifies novel susceptibility loci. Eur Heart J 2017;38:2586-94.
PUBMED | CROSSREF
24. Suzuki S, Yamashita T, Kato T, et al. Incidence of major bleeding complication of warfarin therapy in Japanese patients with atrial fibrillation. Circ J 2007;71:761-5.
PUBMED | CROSSREF
25. Yamashita T, Inoue H, Okumura K, Atarashi H, Origasa H; J-RHYTHM Registry Investigators. Warfarin anticoagulation intensity in Japanese nonvalvular atrial fibrillation patients: a J-RHYTHM Registry analysis. J Cardiol 2015;65:175-7.
PUBMED | CROSSREF
26. Inoue H, Okumura K, Atarashi H, et al. Target international normalized ratio values for preventing thromboembolic and hemorrhagic events in Japanese patients with non-valvular atrial fibrillation: results of the J-RHYTHM Registry. Circ J 2013;77:2264-70.
PUBMED | CROSSREF
27. Kodani E, Atarashi H, Inoue H, Okumura K, Yamashita T; J-RHYTHM Registry Investigators. Target intensity of anticoagulation with warfarin in Japanese patients with valvular atrial fibrillation – subanalysis of the J-RHYTHM Registry. Circ J 2015;79:325-30.
PUBMED | CROSSREF