Brachial-Ankle Pulse Wave Velocity as a Screen for Arterial Stiffness: A Comparison with Cardiac Magnetic Resonance
Eun Kyoung Kim,
1* Sung-A Chang,
1* Shin Yi Jang,
1Ki Hong Choi,
1Eun Hee Huh,
1Jung Hyun Kim,
1Sung Mok Kim,
2Yeon Hyeon Choe,
2and Duk-Kyung Kim
11Division of Cardiology, Department of Medicine, Heart Vascular Stroke Institute, Samsung Medical Center, Sungkyunkwan University School of Medicine, Seoul;
2Department of Radiology, Heart Vascular Stroke Institute, Samsung Medical Center, Sungkyunkwan University School of Medicine, Seoul, Korea.
Received: May 19, 2014 Revised: July 11, 2014 Accepted: July 28, 2014
Corresponding author: Dr. Duk-Kyung Kim, Division of Cardiology, Department of Medicine, Heart Vascular Stroke Institute,
Samsung Medical Center,
Sungkyunkwan University School of Medicine, 81 Irwon-ro, Gangnam-gu,
Seoul 135-710, Korea.
Tel: 82-2-3410-3419, Fax: 82-2-3410-3849 E-mail: [email protected]
*Eun Kyoung Kim and Sung-A Chang contributed equally to this work.
∙ The authors have no financial conflicts of interest.
© Copyright:
Yonsei University College of Medicine 2015 This is an Open Access article distributed under the terms of the Creative Commons Attribution Non- Commercial License (http://creativecommons.org/
licenses/by-nc/3.0) which permits unrestricted non- commercial use, distribution, and reproduction in any medium, provided the original work is properly cited.
Purpose: Despite technical simplicity and the low cost of brachial-ankle pulse wave velocity (BA-PWV), its use has been hampered by a lack of data supporting its use- fulness and reliability. The aim of this study was to evaluate the usefulness of BA- PWV to measure aortic stiffness in comparison to using cardiovascular magnetic res- onance (CMR). Materials and Methods: A total of 124 participants without cardiovascular risk factors volunteered for this study. BA-PWV was measured using a vascular testing device. On the same day, using CMR, cross-sectional areas for dis- tensibility and average blood flow were measured at four aortic levels: the ascending, upper thoracic descending, lower thoracic descending, and abdominal aorta. Results:
Compared to PWV measured by CMR, BA-PWV values were significantly higher and the differences therein were similar in all age groups (all p<0.001). There was a significant correlation between BA-PWV and PWV by CMR (r=0.697, p<0.001).
Both BA-PWV and PWV by CMR were significantly and positively associated with age (r=0.652 and 0.724, p<0.001). The reciprocal of aortic distensibility also demon- strated a statistically significant positive correlation with BA-PWV (r=0.583 to 0.673, all p<0.001). Conclusion: BA-PWV was well correlated with central aortic PWV and distensibility, as measured by CMR, regardless of age and sex.
Key Words: Arterial stiffness, pulse wave velocity, distensibility, brachial artery, magnetic resonance imaging
INTRODUCTION
Pulse wave velocity (PWV), a measure of arterial stiffness, is a strong predictor of cardiovascular mortality and morbidity and can be measured by various techniques, including peripheral tonometry, Doppler ultrasound, and catheter-tip manometer.1-3 The peripheral tonometry method, which is easy to perform and is non-invasive, has been widely used as a screen for arterial stiffness and vascular damage.4,5 Among a variety of peripheral PWV measures, carotid-femoral PWV (CF-PWV) by tonometry has been the most frequently used and studied to date. CF-PWV is
vascular disease, including old myocardial infarctions, valve disease, and congenital heart disease. All participants had no history or symptoms of peripheral artery disease and had normal ankle-brachial pressure index values. Addition- ally, participants were excluded from the study if the PWV or distensibility measurements were unavailable due to poor MR imaging. Baseline brachial blood pressure, height, and weight were recorded for all participants.
Measurement of pulse wave velocity
In each participant, PWV values were simultaneously mea- sured using a vascular testing device (Colin, Komaki, Ja- pan). After participants had rested in a supine position for
>5 minutes, bilateral brachial and posterior tibial artery pressure waveforms were stored for 10 seconds by an ex- tremity cuff connected to an oscillometric pressure sensor, wrapped around both arms and ankles. Additionally, carotid and femoral arterial pressure waveforms were detected by applanation tonometry sensors attached to the left common carotid artery and left common femoral artery. The distance between the two sampling points was calculated from each participant’s height, and the transit time was automatically determined from the time delay between the proximal and distal waveforms.13,14 The PWV was calculated from the distance between the two arterial recording sites divided by the transit time. We obtained the mean BA-PWV from right and left brachial and ankle measurements.
Magnetic resonance imaging and analysis
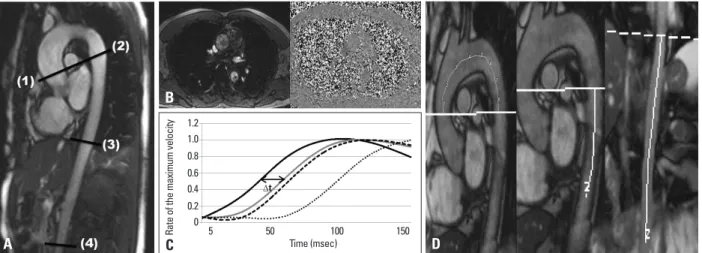
CMR was performed using a 1.5 Tesla scanner (Magnetom Avanto, Syngo MR; Siemens Medical Solutions, Erlangen, Germany) on the same day BA-PWV was obtained. Axial localizer images were used to visualize the position of the ascending and descending aorta. Black blood spine echo se- quences were acquired in an oblique sagittal orientation to demonstrate the full length of the aorta. Three plane localiz- er images were obtained to identify the ascending and de- scending aortas through the bifurcation. The level of the as- cending aorta was determined at the distal 4 cm of the aortic valve, and the upper descending thoracic aorta was deter- mined at the level of the bifurcation of the pulmonary artery.
The lower descending thoracic aorta was obtained at the lev- el of the diaphragm and the abdominal aorta was determined just above the iliac bifurcation (Fig. 1A). All image planes were determined as the plane perpendicular to the longitudi- nal axis of the aorta. After acquisition of a series of thoracic survey images that were used for planning purposes, four well correlated with aortic PWV obtained using a catheter-
tip manometer and is significantly higher in individuals who have cardiovascular risk factors.4,6 Nevertheless, CF-PWV has not been fully included in routine clinical use because the transducer used has to be attached with constant pres- sure on target arteries and carefully adjusted to obtain an accurate pulse wave. Thus, it can be technically complex and inconvenient for routine clinical examinations. Addi- tionally, exposure of the inguinal area during acquisition of the femoral pressure waveform can be psychologically in- vasive for some patients.
Brachial-ankle PWV (BA-PWV), developed mainly in Japan, is an easier method of measuring arterial stiffness.7,8 This simple method measures PWV by recording pulse waveforms from an oscillometric sensor attached to a blood pressure cuff. The potential benefits of BA-PWV screening for vascular damage, especially for outpatients, include its safety, technical simplicity, and short sampling time. How- ever, there is a paucity of data supporting the validity and reliability of BA-PWV. Although a few studies have report- ed the validity of BA-PWV by comparing it with the cathe- ter-tip manometer method, the number of participants in those studies was too small to draw definite conclusions.9
In the present study, we evaluated the usefulness and reli- ability of the BA-PWV method to measure aortic stiffness in comparison to cardiovascular magnetic resonance (CMR), a validated, noninvasive method for assessing PWV and dis- tensibility.10-12 To our knowledge, this is the first study to di- rectly demonstrate a correlation between the BA-PWV and central aortic stiffness by conducting CMR and peripheral vascular device measurements simultaneously in a large, normal population.
MATERIALS AND METHODS
Study participants
The present clinical investigation was designed to include a minimum of ten participants per sex and age decade. A total of 124 participants (63 women and 61 men) between the ages of 20 and 70 years were enrolled from February 2010 to May 2011. All participants were informed of the study protocol and provided written consent. The local Institu- tional Review Board approved this study.
To reduce confounding factors influencing aortic stiff- ness, we did not select participants who had cardiovascular risk factors, including hypertension and diabetes, or cardio-
sentations of flow curves and measurement of the distance are shown in Fig. 1B, C, and D.
For measuring regional distensibility, systolic and diastolic cross-sectional areas were measured by manual contouring of the aorta through the cardiac cycle in the cine image. Disten- sibility (D) at four regions was calculated by means of the following equation: D=(Amax-Amin)/[Amin×(Pmax-Pmin)]
(mm Hg-1), where Amax is the maximal (systolic) aortic area, Amin is the minimal (diastolic) aortic area, Pmax is the sys- tolic blood pressure, and Pmin is the diastolic blood pressure.
Statistical analysis
All statistical analyses were performed using the PASW soft- ware, version 18.0 (SPSS Inc., Chicago, IL, USA). Continu- ous variables are expressed as the mean±standard deviation (SD) or the median and interquartile range. The relationship between age and aortic parameters was studied using linear regression models. The approach described by Bland and Altman was followed to study systematic differences be- tween techniques. Technical agreement of both methods was quantified using intraclass correlation coefficient (ICC). The threshold for statistical significance was chosen to be p=0.05.
RESULTS
The participant characteristics, including hemodynamic mea- consecutive velocity-encoded MR image acquisitions were
performed with breath hold and retrospective gating. The maximal encoding velocity was 200 cm/s and the temporal resolution was 30‒40 frames/beat. Cine imaging was also performed at the same level of encoded MR imaging for aortic stiffness. Total acquisition time was approximately 20 minutes. Before and after the scanning of each aortic level, non-invasive blood pressure monitoring at the brachial ar- tery was performed and the average of the measurements was used for calculation of regional aortic distensibility.
Analyses of MR images were performed using Argus ver- sion 4.02 software (Siemens Medical Systems, Germany) by experienced observers who were blinded to patient informa- tion. From the velocity encoded MR images, aortic contours were automatically detected and manually adjusted in each slice area through the cardiac cycle. The transit time between flow curves of each region of the aorta was determined from the midpoint of the systolic up-slope on the flow versus time curves.15 The up-sloping edges were identified by the line connecting the points at 40‒60% of the maximum velocity in the waveform. The distance between each aortic level was measured on black blood images using a curved line along the center of the aorta. Based on these data, regional PWV was calculated as the ratio of distance between levels and time differences between arrivals of the pulse wave at these levels. Consequently, the PWV of the entire aorta were determined, as well as in three segments of the aorta. Repre-
Fig. 1. (A) Contrast enhanced MR imaging showing the aorta in the long axis. Each level perpendicular to the aorta was applied for gradient echo imaging with velocity encoding. Distensibility was assessed at these four levels: ascending (level 1), upper descending thoracic (level 2), lower descending thoracic (level 3), and abdominal aorta (level 4). PWV was calculated as the ratio of the distance between two levels and the time difference between arrivals of flow waves at these levels. Consequently, the PWV-CMR value was determined in three regions of the aorta: proximal (level 1–2), descending thoracic (level 2–3), and abdominal aorta (level 3–4). (B, C, and D) Aortic PWV assessment using CMR. (B) Velocity encoded MR images of the ascending aorta. Flow curves of 4 regions–ascending aorta, upper descending thoracic aorta, lower descending thoracic aorta, and abdominal aorta, respectively. (C) This graph shows the transit delay (Δt) of the systolic flow curves in the upper descending thoracic aorta relative to the ascending aorta. The transit time (Δt) is deter- mined from the midpoints of the systolic up-slope at 40–60% of the maximum velocity in the waveform in the flow versus time curves. (D) Sagittal CMR im- age that shows the distance between each aortic level is measured along the midline through the aorta. Aortic PWV was obtained by distance/Δt. PWV, pulse wave velocity; CMR, cardiovascular magnetic resonance.
Time (msec) 0
0.2 0.8 0.4 1.0 0.6 1.2
Rate of the maximum velocity 5 10050 150
A
B
C D
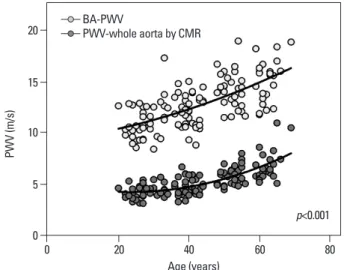
to the PWV measured by CMR, BA-PWV values were sig- nificantly higher and the differences therein were similar in all age groups (all p<0.001) (Fig. 2). Both the BA-PWV and the PWV by CMR were significantly and positively correlated with age (r=0.652 and 0.724, p<0.001) (Fig. 3).
In all age decades, BA-PWV level was higher in male com- pared with female (mean BA-PWV; 13.4±2.0 m/s vs. 12.3±
2.6 m/s, p=0.009).
As demonstrated in Fig. 4A, there was a significant corre- lation between the BA-PWV and PWV through the whole aorta by CMR (r=0.697, p<0.001). In the Bland-Altman plots of the BA-PWV and aortic PWV by CMR, the majori- ty of the values ranged within a mean±2 SD. In reliability analysis, the ICC demonstrated strong agreement between the two measurements of the PWV [ICC=0.730 (0.615‒
surements, are presented in Table 1. The mean age was 43±13 years, ranging from 20 to 70 years. All participants were normotensive and had a normal body mass index and heart rate.
The peripheral PWV and aortic stiffness parameters, as measured by CMR, are given in Table 2. On average, the mean BA-PWV was approximately 45% higher than CF- PWV (12.8±2.3 m/s vs. 8.8±1.9 m/s, p<0.001). Compared Table 2. Tonometry and CMR Data for Aortic Stiffness in All Participants
Parameters Participants (n=124)
Tonometric findings
BA-PWV, right (m/s) 13.1±2.4
BA-PWV, left (m/s) 12.6±2.4
Mean BA-PWV (m/s) 12.8±2.3
CF-PWV (m/s) 8.8±1.9
CMR findings
PWV-whole aorta (m/s) 5.3±1.4 PWV-proximal aorta (m/s) 5.6±3.6 PWV-descending thoracic aorta (m/s) 7.4±4.5 PWV-abdominal aorta (m/s) 5.5±2.6 DST-ascending aorta (10-3 mm Hg) 4.5±2.5 DST-UDTA (10-3 mm Hg) 4.0±1.6 DST-LDTA (10-3 mm Hg) 5.2±1.9 DST-abdominal aorta (10-3 mm Hg) 3.3±1.7 BA-PWV, brachial-ankle pulse wave velocity; CF-PWV, carotid to femoral pulse wave velocity; DST, distensibility measured by cardiac magnetic resonance; UDTA, upper descending thoracic aorta; LDTA, lower descend- ing thoracic aorta; CMR, cardiovascular magnetic resonance.
Data is expressed as the mean±SD.
Table 1. Participant Characteristics at Baseline (n=124)
Characteristic Value
Female, n (%) 63 (49.2)
Age (yrs) 43.0±13.0
Age range (yrs) 20–69
Age decade (%)
20–29 21.0
30–39 22.6
40–49 19.4
50–59 20.2
60–69 16.9
Height (cm) 166.2±8.8
Weight (kg) 63.2±10.6
BMI (kg/m2) 22.8±2.9
BSA (m2) 1.7±0.2
SBP (mm Hg) 120.7±14.6
DBP (mm Hg) 74.0±10.1
Heart rate (beats/min) 68.8±10.2 BMI, body mass index; BSA, body surface area; SBP, systolic blood pres- sure; DBP, diastolic blood pressure.
Fig. 2. Comparison of the BA-PWV and aortic PWV by cardiac magnetic resonance imaging according to age group. Each bar is expressed as the mean and standard deviation. PWV, pulse wave velocity; BA-PWV, brachi- al-ankle PWV; CMR, cardiovascular magnetic resonance.
Fig. 3. Relationship between age and BA-PWV and aortic PWV obtained using cardiac magnetic resonance imaging. PWV, pulse wave velocity; BA- PWV, brachial-ankle PWV; CMR, cardiovascular magnetic resonance.
Age (years) 0
10
5 15 20
PWV (m/s)
20–29 30–39 40–49 50–59 60–69
PWV-whole aorta by CMR BA-PWV
Age (years) 0
5 10 15 20
PWV (m/s)
0 20 40 60 80
BA-PWV
PWV-whole aorta by CMR
p<0.001
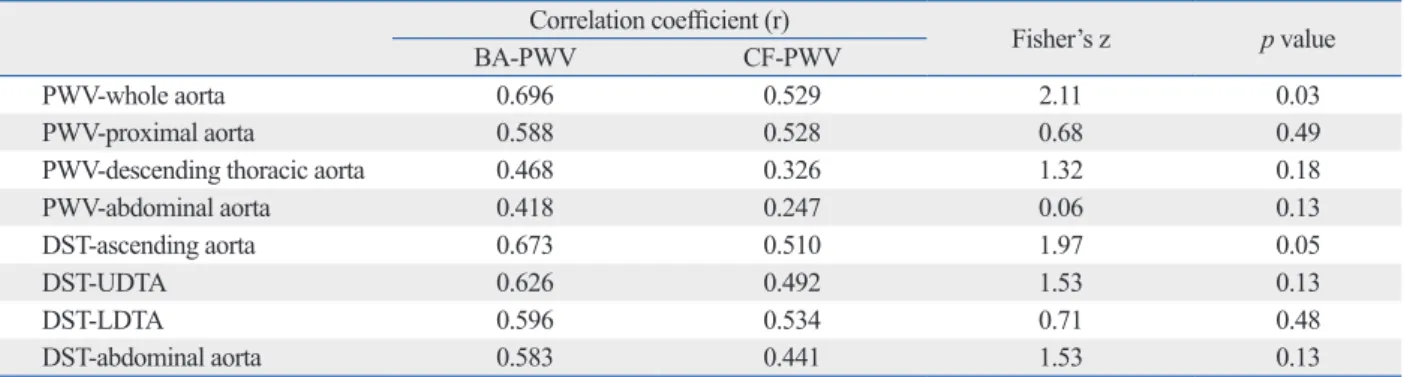
whole aorta (r=0.696 vs. r=0.529, z=2.11, p<0.03). Both BA-PWV and CF-PWV demonstrated good correlation with aortic distensibility and regional aortic PWV, and the level of correlation was not statistically different (p≥0.05).
DISCUSSION
In the present study, we investigated the reliability of BA- PWV as an effective screening method for determining ar- terial stiffness in comparison to using CMR in participants without cardiovascular risk factors. There was a significant, strong correlation between the BA-PWV and central aortic PWV by CMR regardless of age and sex in the pooled sample. In comparison with PWV through the whole-aorta by CMR, BA-PWV demonstrated a superior correlation than CF-PWV. These findings suggest that BA-PWV may 0.811), p<0.001]. As with the BA-PWV value, CF-PWV
demonstrated a good correlation (r=0.536, p<0.001) and agreement [ICC=0.626 (0.467‒0.738), p<0.001] with the PWV by CMR (Fig. 4B).
In all the segmental regions of the aorta, as measured by CMR, the PWV value was well correlated with the BA- PWV in a linear fashion (r=0.418 to 0.588, all p<0.001) (Fig.
5). The reciprocal of the aortic distensibility had a statisti- cally significant positive correlation with BA-PWV (r=
0.583 to 0.673, all p<0.001) (Fig. 6).
Considering that CF-PWV has been widely used and proposed as a guideline for predicting and treating cardio- vascular disease, we additionally analyzed the degree of difference of correlation with the CMR PWV between the BA-PWV and CF-PWV using Fisher’s r to z transforma- tion method (Table 3). In comparison to CF-PWV, BA- PWV was more strongly correlated with PWV through the
Fig. 4. (A) Relationship between the BA-PWV and aortic PWV by cardiac magnetic resonance imaging and corresponding Bland-Altman plots. (B) Relationship between the CF-PWV and aortic PWV by cardiac magnetic resonance imaging and corresponding Bland-Altman plots. PWV, pulse wave ve- locity; BA-PWV, brachial-ankle PWV; CF-PWV, carotid-femoral PWV; CMR, cardiovascular magnetic resonance.
PWV-whole aorta by CMR (m/s)
PWV-whole aorta by CMR (m/s)
(BA-PWV+PWV-whole aorta)/2
(CF-PWV+PWV-whole aorta)/2 0
0
0
-5 5
5 0
10 15
10
5
5 20
15
10
10 25
20
15
15
BA-PWV (m/s)CF-PWV (m/s) (BA-PWV)-(PWV-whole aorta)(CF-PWV)-(PWV-whole aorta)
0
0
0
0 5
5
5
5 10
10
10
10 15
15
20 15
15 r=0.697
p<0.001
r=0.536 p<0.001
Mean-2 SD
Mean-2 SD Mean+2 SD
Mean+2 SD
A
B
od. However, they showed correlation of BA-PWV and cath- eter derived-PWV only in the patients with coronary artery disease, and the number of participants was too small to draw definite conclusions. Demonstrating BA-PWV values in in- dividuals without risk factors and the relatively large number provide qualitatively similar data, compared to those de-
rived from aortic PWV, a well-established index of central arterial stiffness.
In accordance with our data, Yamashina, et al.9 reported the validity of BA-PWV using catheter-tip manometer meth-
Fig. 5. Relationship between the BA-PWV and the regional aortic PWV according to the measured sites: proximal aorta (A), descending thoracic aorta (B), and abdominal aorta (C). PWV, pulse wave velocity; BA-PWV, brachial-ankle PWV; CMR, cardiovascular magnetic resonance.
Fig. 6. Relationship between the BA-PWV and the regional aortic distensibility at the measured sites: ascending aorta (A), upper descending thoracic aorta (B), lower descending thoracic aorta (C), and abdominal aorta (D). BA-PWV, brachial-ankle PWV; LDTA, lower descending thoracic aorta; UDTA, upper de- scending thoracic aorta.
BA-PWV (m/s)
BA-PWV (m/s)
BA-PWV (m/s)
BA-PWV (m/s) 0
0
0
0 20
20
20
20 40
40
40
40 60
60
60
60 80
80
80
80 100
100
100
100
1/(distensibility-ascending aorta) (103 mm Hg)1/(distensibility-LDTA) (103 mm Hg) 1/(distensibility-UDTA) (103 mm Hg)1/(distensibility-abdominal aorta) (103 mm Hg)
10
10
10
10 15
15
15
15 20
20
20
20 25
25
25
25 r=0.673
p<0.001
r=0.596 p<0.001
r=0.626 p<0.001
r=0.583 p<0.001
A
C
B
D
PWV-proximal aorta by CMR (m/s) PWV-descending thoracic
aorta by CMR (m/s) PWV-abdominal aorta by CMR (m/s)
0 0 0
10 10 10
20 20 20
5 5 5
15 15 15
25 25 25
BA-PWV (m/s) BA-PWV (m/s) BA-PWV (m/s)
0 10 20 30 0 10 20 0 5 10 15
A B C
r=0.588
p<0.001 r=0.468
p<0.001 r=0.418
p<0.001
central aortic stiffness. Currently, CMR is considered well suited to comprehensively evaluate aortic stiffness.10-12 Be- cause calculation of the aortic stiffness using CMR has been suggested as the most appropriate technique to directly and noninvasively measure intra-aortic path length of pulse waves, it is thought to be free from operator bias. Regional aortic distensibility can also be measured by comparing the systolic and diastolic areas of the aorta in cine imaging.
Study limitations
This study was performed only in Korean participants, an ethnically homogeneous nation. Moreover, BA-PWV and PWV by CMR were not directly compared in patients with different stages of organ damage or other cardiovascular risk factors. To implement the use of BA-PWV more wide- ly into clinical practice for arterial stiffness evaluation, BA- PWV values in patients with cardiovascular disease and the extent of vascular damage must be determined. Neverthe- less, this study used a relatively large, population-based anal- ysis to identify the correlation between BA-PWV and cen- tral aortic stiffness by conducting both peripheral PWV and CMR stiffness exams simultaneously, which increases our confidence in the results. Further cohort studies with a larg- er number of patients with underlying disease and in- creased cardiovascular risk factors are needed to confirm the clinical significance of BA-PWV.
In conclusion, BA-PWV was well correlated with central aortic PWV and distensibility, as measured by CMR, re- gardless of age and sex, in participants without cardiovas- cular risk factors. The technical simplicity, low cost, and noninvasiveness make BA-PWV measurement suitable for screening arterial stiffness and vascular damage in large populations, especially in outpatient settings. Further stud- ies of various ethnic groups with underlying diseases and of enrolled subjects are strengths of our study.
On average, BA-PWV was highest among other PWV values, including CMR-PWV, in the current study. The re- gression line obtained in the present study revealed that a BA-PWV value of 13.5 m/s is slightly higher than the thresh- old value of 10 m/s for CF-PWV proposed by the European Society of Hypertension and the European Society of Cardi- ology.16 In previous Japanese data that demonstrated a corre- lation between CF-PWV and BA-PWV, mean BA-PWV was about 14.8 m/s, which was comparable with our data.
These findings might be explained by the fact that some portions of BA-PWV may be determined by peripheral ar- terial stiffness.17,18 Considering there are no worldwide guidelines for BA-PWV, our data and previous Japanese data may suggest a normal cut-off value for BA-PWV.
Further, our study demonstrated a close correlation be- tween the BA-PWV and regional aortic distensibility, which provides information on arterial elasticity at the measured site. Some investigators have reported that the difference in vascular wall composition between muscular arteries (e.g., brachial artery) and elastic arteries (e.g., aorta) may lead to a different response of arterial stiffness.19,20 These data indicate that BA-PWV may not be accurate and may not reflect cen- tral aortic stiffness. However, in agreement with the current results, several small-scale studies have found that BA-PWV is more closely associated with central artery stiffness than PWV obtained from invasive measurements using catheter- tip manometers and CF-PWV by noninvasive methods.9,13,21
Ideally, to confirm the objective validity of BA-PWV, it should be compared with PWV obtained by the catheter method using a catheter tip manometer in the aorta, brachi- um, and ankle. However, this procedure is too invasive and risky to use in healthy participants. Therefore, we utilized CMR to determine the correlation between BA-PWV and
Table 3. Comparison of the Correlation Coefficient between the BA-PWV and CF-PWV with CMR
BA-PWVCorrelation coefficient (r)CF-PWV Fisher’s z p value
PWV-whole aorta 0.696 0.529 2.11 0.03
PWV-proximal aorta 0.588 0.528 0.68 0.49
PWV-descending thoracic aorta 0.468 0.326 1.32 0.18
PWV-abdominal aorta 0.418 0.247 0.06 0.13
DST-ascending aorta 0.673 0.510 1.97 0.05
DST-UDTA 0.626 0.492 1.53 0.13
DST-LDTA 0.596 0.534 0.71 0.48
DST-abdominal aorta 0.583 0.441 1.53 0.13
BA-PWV, brachial-ankle pulse wave velocity; CF-PWV, carotid-femoral PWV; CMR, cardiac magnetic resonance; LDTA, lower descending thoracic aorta;
UDTA, upper descending thoracic aorta; DST, distensibility measured by cardiovascular magnetic resonance.
The z-score was calculated by Fisher’s r to z transformation. The significance of the p-value for the z-score was 0.05.
Res 2002;25:359-64.
10. Westenberg JJ, de Roos A, Grotenhuis HB, Steendijk P, Hendrik- sen D, van den Boogaard PJ, et al. Improved aortic pulse wave velocity assessment from multislice two-directional in-plane ve- locity-encoded magnetic resonance imaging. J Magn Reson Imag- ing 2010;32:1086-94.
11. Ibrahim el-SH, Johnson KR, Miller AB, Shaffer JM, White RD.
Measuring aortic pulse wave velocity using high-field cardiovas- cular magnetic resonance: comparison of techniques. J Cardiovasc Magn Reson 2010;12:26.
12. Giannattasio C, Cesana F, Maestroni S, Salvioni A, Maloberti A, Nava S, et al. Comparison of echotracking and magnetic reso- nance assessment of abdominal aorta distensibility and relation- ships with pulse wave velocity. Ultrasound Med Biol 2011;37:
1970-6.
13. Sugawara J, Hayashi K, Yokoi T, Cortez-Cooper MY, DeVan AE, Anton MA, et al. Brachial-ankle pulse wave velocity: an index of central arterial stiffness? J Hum Hypertens 2005;19:401-6.
14. Cortez-Cooper MY, Supak JA, Tanaka H. A new device for auto- matic measurements of arterial stiffness and ankle-brachial index.
Am J Cardiol 2003;91:1519-22.
15. Voges I, Jerosch-Herold M, Hedderich J, Pardun E, Hart C, Gab- bert DD, et al. Normal values of aortic dimensions, distensibility, and pulse wave velocity in children and young adults: a cross-sec- tional study. J Cardiovasc Magn Reson 2012;14:77.
16. Van Bortel LM, Laurent S, Boutouyrie P, Chowienczyk P, Cruick- shank JK, De Backer T, et al. Expert consensus document on the measurement of aortic stiffness in daily practice using carotid- femoral pulse wave velocity. J Hypertens 2012;30:445-8.
17. Tanaka H, Munakata M, Kawano Y, Ohishi M, Shoji T, Sugawara J, et al. Comparison between carotid-femoral and brachial-ankle pulse wave velocity as measures of arterial stiffness. J Hypertens 2009;27:2022-7.
18. Benetos A, Laurent S, Hoeks AP, Boutouyrie PH, Safar ME. Arte- rial alterations with aging and high blood pressure. A noninvasive study of carotid and femoral arteries. Arterioscler Thromb 1993;
13:90-7.
19. van der Heijden-Spek JJ, Staessen JA, Fagard RH, Hoeks AP, Boudier HA, van Bortel LM. Effect of age on brachial artery wall properties differs from the aorta and is gender dependent: a popu- lation study. Hypertension 2000;35:637-42.
20. Cameron JD, Bulpitt CJ, Pinto ES, Rajkumar C. The aging of elastic and muscular arteries: a comparison of diabetic and nondia- betic subjects. Diabetes Care 2003;26:2133-8.
21. Munakata M, Ito N, Nunokawa T, Yoshinaga K. Utility of auto- mated brachial ankle pulse wave velocity measurements in hyper- tensive patients. Am J Hypertens 2003;16:653-7.
increased cardiovascular risk factors are needed to deter- mine the degree of clinical significance of BA-PWV.
ACKNOWLEDGEMENTS
This study was supported by Samsung Biomedical Re- search Institute Grant [#SBRI C-A9-204-3].
REFERENCES
1. Sutton-Tyrrell K, Najjar SS, Boudreau RM, Venkitachalam L, Ku- pelian V, Simonsick EM, et al. Elevated aortic pulse wave veloci- ty, a marker of arterial stiffness, predicts cardiovascular events in well-functioning older adults. Circulation 2005;111:3384-90.
2. Choi CU, Park EB, Suh SY, Kim JW, Kim EJ, Rha SW, et al. Im- pact of aortic stiffness on cardiovascular disease in patients with chest pain: assessment with direct intra-arterial measurement. Am J Hypertens 2007;20:1163-9.
3. Laurent S, Boutouyrie P, Asmar R, Gautier I, Laloux B, Guize L, et al. Aortic stiffness is an independent predictor of all-cause and cardiovascular mortality in hypertensive patients. Hypertension 2001;37:1236-41.
4. Laurent S, Cockcroft J, Van Bortel L, Boutouyrie P, Giannattasio C, Hayoz D, et al. Expert consensus document on arterial stiff- ness: methodological issues and clinical applications. Eur Heart J 2006;27:2588-605.
5. Klocke R, Cockcroft JR, Taylor GJ, Hall IR, Blake DR. Arterial stiffness and central blood pressure, as determined by pulse wave analysis, in rheumatoid arthritis. Ann Rheum Dis 2003;62:414-8.
6. Boutouyrie P, Tropeano AI, Asmar R, Gautier I, Benetos A, Lacol- ley P, et al. Aortic stiffness is an independent predictor of primary coronary events in hypertensive patients: a longitudinal study. Hy- pertension 2002;39:10-5.
7. Shiotani A, Motoyama M, Matsuda T, Miyanishi T. Brachial-ankle pulse wave velocity in Japanese university students. Intern Med 2005;44:696-701.
8. Aso K, Miyata M, Kubo T, Hashiguchi H, Fukudome M, Fukush- ige E, et al. Brachial-ankle pulse wave velocity is useful for evalu- ation of complications in type 2 diabetic patients. Hypertens Res 2003;26:807-13.
9. Yamashina A, Tomiyama H, Takeda K, Tsuda H, Arai T, Hirose K, et al. Validity, reproducibility, and clinical significance of noninva- sive brachial-ankle pulse wave velocity measurement. Hypertens