Korean Circulation Journal
Introduction
Aortic stiffness is known to be associated with cardiovascular outcomes. Pulse wave velocity (PWV) is one of the best ways to mea-
Print ISSN 1738-5520 • On-line ISSN 1738-5555
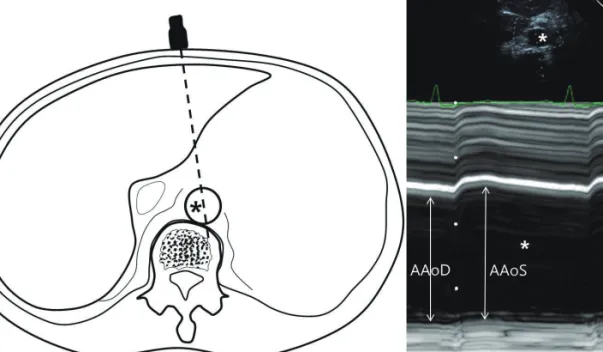
Correlation between Proximal Abdominal Aortic Stiffness
Measured by Ultrasound and Brachial-Ankle Pulse Wave Velocity
Young-Hyo Lim, MD 1 , Rentsendorj Enkhdorj, MD 2 , Bae Keun Kim, MD 1 , Soon Gil Kim, MD 1 , Jeong Hyun Kim, MD 1 , and Jinho Shin, MD 1
1
Division of Cardiology, Department of Internal Medicine, Hanyang University College of Medicine, Seoul, Korea
2