I. Introduction
Analysis of fingertip photoplethysmogram (PPG) signals is an important tool for assessing pulse wave components and their relation to vascular health. PPG is an optical measure- ment technique that uses a red or invisible infrared light that penetrates into the tissue and then measures changes in light absorption, which reflects variations in blood perfusion.
Several studies have demonstrated that the PPG waveform can provide clinical information on the activity of the left ventricle, the dynamics of the autonomic nervous system, vascular aging, and arterial stiffness [1,2]. However, a simple vascular checkup using PPG analysis has not become popu-
Aging Index using Photoplethysmography for a
Healthcare Device: Comparison with Brachial-Ankle Pulse Wave Velocity
Kyung Soon Hong, MD, PhD1, Kyu Tae Park, MD1, Jae Mok Ahn, PhD2
1Division of Cardiology, Department of Internal Medicine, Hallym University College of Medicine, Chuncheon; 2Department of Electronics Engineering, Col- lege of Information and Electronics Engineering, Hallym University, Chuncheon, Korea
Objectives: Recent studies have emphasized the potential information embedded in peripheral fingertip photoplethysmo- gram (PPG) signals for the assessment of arterial wall stiffening during aging. For the discrimination of arterial stiffness with age, the brachial-ankle pulse wave velocity (baPWV) has been widely used in clinical applications. The second derivative of the PPG (acceleration photoplethysmogram [APG]) has been reported to correlate with the presence of atherosclerotic disor- ders. In this study, we investigated the association among age, the baPWV, and the APG and found a new aging index reflect- ing arterial stiffness for a healthcare device. Methods: The APG and the baPWV were simultaneously applied to assess the accuracy of the APG in measuring arterial stiffness in association with age. A preamplifier and motion artifact removal algo- rithm were newly developed to obtain a high quality PPG signal. In total, 168 subjects with a mean ± SD age of 58.1 ± 12.6 years were followed for two months to obtain a set of complete data using baPWV and APG analysis. Results: The baPWV and the B ratio of the APG indices were correlated significantly with age (r = 0.6685, p < 0.0001 and r = –0.4025, p < 0.0001, respectively). A regression analysis revealed that the c and d peaks were independent of age (r = –0.3553, p < 0.0001 and r = –0.3191, p < 0.0001, respectively). Conclusions: We determined the B ratio, which represents an improved aging index and suggest that the APG may provide qualitatively similar information for arterial stiffness.
Keywords: Photoplethysmography, Acceleration Plethysmogram, Arterial Stiffness, Pulse Wave Velocity, Motion Artifact
Healthc Inform Res. 2015 January;21(1):30-34.
http://dx.doi.org/10.4258/hir.2015.21.1.30 pISSN 2093-3681 • eISSN 2093-369X
Submitted: November 6, 2014 Revised: January 21, 2015 Accepted: January 26, 2015 Corresponding Author Jae Mok Ahn, PhD
Department of Electronics Engineering, College of Information and Electronics Engineering, Hallym University, 1 Hallymdaehak-gil, Chuncheon 200-702, Korea. Tel: +82-33-248-2347, Fax: +82-33- 241-4183, E-mail: [email protected]
This is an Open Access article distributed under the terms of the Creative Com- mons Attribution Non-Commercial License (http://creativecommons.org/licenses/by- nc/3.0/) which permits unrestricted non-commercial use, distribution, and reproduc- tion in any medium, provided the original work is properly cited.
ⓒ 2015 The Korean Society of Medical Informatics
lar because the readings are largely influenced by the quality of the measured PPG signal. These factors include the loca- tion of measurement, properties of the skin, blood oxygen saturation, flow rate, skin temperatures, and measurement environment [3,4]. The systolic peak amplitude required for blood flow evaluation by PPG is critically affected by the various factors mentioned above as well [3]. The brachial- ankle pulse wave velocity (baPWV) has been recognized as a marker that reflects arterial stiffness [5,6]. The baPWV has been shown to increase with aging and hypertension [7,8], and it is measured using an automatic volume plethysmo- gram apparatus for calculating the velocity of the propagat- ing pulse wave over a given distance between two sites of the arterial system. However, for healthcare applications at home or elsewhere, baPWV measurement is difficult because it requires the placement of blood pressure cuffs on the four extremities. PPG is easy to set up, convenient, simple, and relatively inexpensive as it requires only a single fingertip sensor. However, a full understanding of the diagnostic value of various features of the APG signal is still lacking and more research is needed. Therefore, in this study, we developed a new preamplifier that can obtain a high-quality PPG signal to extract the inflection points of the wave changes. A mo- tion artifact removal algorithm and a finite impulse response (FIR) digital filter were incorporated into a signal pream- plifier. Second, we evaluated whether the accelerated PPG (APG) was associated with aging by comparing the results with well-established baPWV indices for various age groups.
Direct comparison of baPWV to APG is not meaningful be- cause baPWV cannot be an absolute reference that provides a completely linear relationship with age. In conclusion, this newly developed aging index using the APG indices and the single PPG sensor may be easily applied in a future health- care device.
II. Methods
1. Subjects
We studied 195 patients who exhibited normal blood pres- sures, i.e., <150 mmHg systolic or <90 mmHg diastolic re- gardless of any drug administration. Patients with peripheral arterial disease with an ankle brachial index below 0.9 were excluded because precise measurements of the tibial arte- rial pressure wave would have been difficult. Additionally, patients with heart rates higher than 100 bpm were excluded because the resultant wave inflections on APG signals would have been unclear. Finally, 168 patients were included in the study. Table 1 shows the clinical information.
2. Brachial-Ankle Pulse Wave Velocity
Pulse volume waveforms at the brachium and ankle were recorded using the baPWV with a semiconductor pressure sensor (OMRON Co. Ltd., Tokyo, Japan). The subjects were examined while resting in the supine position. Fingertip PPG and baPWV were simultaneously used to assess arterial stiff- ness. The bilateral brachial and ankle blood pressures and arterial pulse waves were also simultaneously measured us- ing the baPWV device. All waveforms were recorded for 20 to 40 seconds. The pulse wave velocity was calculated from the distance between two arterial recording sites divided by the transit time. The transit time was determined from the time delay between the proximal and distal ‘foot’ waveforms.
The foot of the wave was identified as the commencement of the sharp systolic upstroke. The results obtained with the right-side and the left-side baPWV were almost identical (r
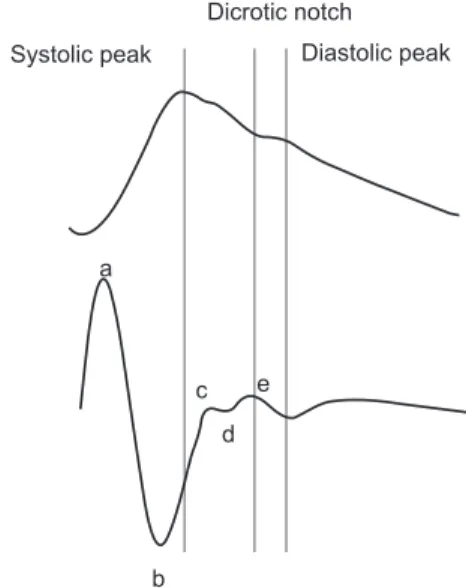
Figure 1. (Top) Original fingertip photoplethysmogram waveform.
(Bottom) Second derivative of the photoplethysmogram (i.e., acceleration photoplethysmogram).
Dicrotic notch Diastolic peak Systolic peak
a
b c
d e Table 1. Characteristics of subjects (n = 168)
Variable Mean ± SD Min–Max
Age (yr) 58.1 ± 12.6 22.0–86.0
Height (cm) 162.4 ± 9.1 136.0–184.0
Body mass (kg) 66.3 ± 11.8 37.5–106.0
Body mass index (kg/m2) 25.0 ± 3.6 16.7–35.8 Heart rate (beat/min) 65.6 ± 11.3 43.0–100.0 Systolic blood pressure (mmHg) 125.5 ± 14.0 100.0–159.0 Diastolic blood pressure (mmHg) 74.6 ± 8.8 55.0–98.0 Mean arterial pressure (mmHg) 95.1 ± 11.8 54.0–124.0 Pulse pressure (mmHg) 51.2 ± 10.3 30.0–85.0
= 0.9502). The mean baPWV of the right and left sides was reported in the present study.
3. Photoplethysmogram
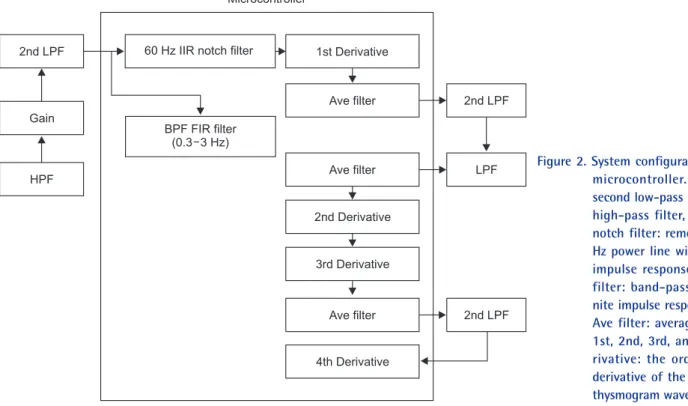
PPG measurements were obtained from the index finger to analyze the vascular status while the baPWV was being measured. PPG recording was performed for a duration of 20 to 60 seconds, and the APG signal (the 2nd derivative of the PPG) was obtained at the same time. As shown in Figure 1, the APG waveform enables a more accurate recognition of the inflection points than the original PPG waveform, and it can show anacrotic or dicrotic notches. However, PPG signals are often distorted by poor peripheral perfusion or motion artifacts. A preamplifier was applied using a TAS9 VIEW (IEMBIO Co. Ltd., Chuncheon, Korea) device to lo- cally digitize the signals, and the signals were subsequently filtered digitally using an FIR filter to remove motion arti- facts. The APG features were thus automatically processed for statistical analyses. PPG signals, obtained with a pream- plifier based on a microcontroller (MSP430F6638, Texas In- struments, Dallas, TX, USA), were band-pass filtered (0.6–15 Hz) to remove the effects of the respiratory rhythm and higher-frequency disturbances. Figure 2 shows the system configuration, including both peripheral circuits and em- bedded software. The 1st through 4th derivative algorithms of the PPG signal and its automatic detection algorithm for APG features were programmed into the microcontroller.
The auto-gain control algorithm was embedded to adjust
for sudden amplitude changes to obtain a limited peak-to- peak signal for the APG analysis. Although the PPG signal contains clinical information that can provide the vascular status, it is still difficult to process because it is sensitive to artifacts. For this reason, the PPG signal has not been widely used in healthcare devices or mobile systems beyond oxim- etry. The APG waveform can discern four systolic waves and one diastolic wave, namely, the a-wave (i.e., early systolic positive wave), b-wave (i.e., early systolic negative wave), c- wave (i.e., late systolic re-increasing wave), d-wave (i.e., late systolic re-decreasing wave), and e-wave (i.e., early diastolic positive wave) at the dicrotic notch (Figure 1). The e-wave location corresponds to the closure of the aortic valve and subsequent retrograde blood flow, and it can be used to monitor cardiac function [9]. The 4th differentiation of the PPG waveform in the software was programmed to detect the zero slope of the 3rd differentiated waveform to detect the peaks of the 2nd derivative (i.e., APG features). The sig- nals were band-pass filtered in the peripheral circuit via the pulse width modulation (PWM) port of the microcontroller to improve the quality of the PPG signal. A low-pass 80-tap FIR digital filter to reduce noise and artifacts operates at the microcontroller clock frequency of 16 MHz to obtain the desired frequency response with the passband frequency and stopband frequency of 20 Hz and 30 Hz at -60 dB, respec- tively. Three direct memory access (DMA) channels for an FIR are applied for data transfer to proceed in parallel with minimum delay because the CPU operates other subroutine
Figure 2. System configuration using microcontroller. 2nd LPF:
second low-pass filter, HPF:
high-pass filter, 60 Hz IIR notch filter: removal of 60 Hz power line with infinite impulse response, BPF FIR filter: band-pass filter fi- nite impulse response filter, Ave filter: averaging filter, 1st, 2nd, 3rd, and 4th de- rivative: the order of the derivative of the photople- thysmogram waveform.
2nd LPF
LPF
2nd LPF 60 Hz IIR notch filter 1st Derivative
Ave filter
Ave filter
2nd Derivative
3rd Derivative
Ave filter
4th Derivative BPF FIR filter
(0.3 3 Hz) 2nd LPF
Gain
HPF
Microcontroller
functions while the transfer is in progress compared to a conventional design without the use of DMA.
4. Statistics
Statistical analyses were performed using MedCalc ver. 11.2 (MedCalc, Ostend, Belgium). Pearson correlation coef- ficients were calculated to evaluate the associations of the baPWV and the APG indices with age. A 95% confidence interval for the correlation coefficient (r) was calculated cor- responding to the range of values that contains the true cor- relation coefficient with 95% probability. Multiple regression analyses were used to assess independent associations be- tween one dependent variable and two or more independent variables. We evaluated whether a particular APG index was best associated with arterial stiffness, independent of other related indices. Statistical significance was defined as p < 0.05.
III. Results
The simple correlation analysis of the baPWV and APG demonstrated that the baPWV and APG were significantly correlated with age (r = 0.6685, p < 0.0001 and r = -0.4025, p < 0.0001, respectively). Age was significantly correlated
with systolic blood pressure (r = 0.2903, p < 0.0001) and pulse pressure in the baPWV analysis (r = 0.486, p < 0.0001).
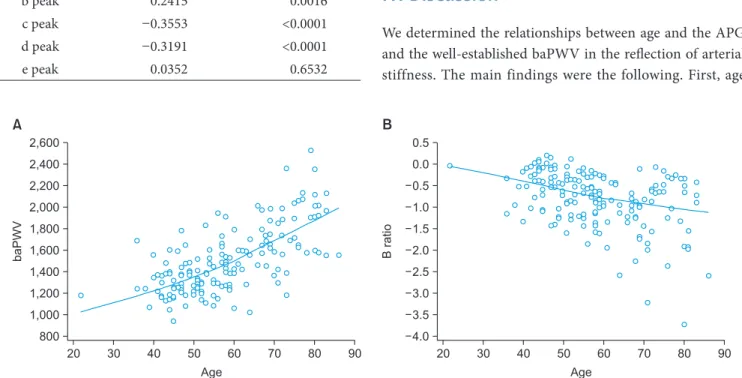
However, in the APG analysis, age was significantly cor- related with the c peak (r = -0.3553, p < 0.0001) and the d peak (r = -0.3191, p < 0.0001). There were no close correla- tions between age, the a peak, and the b peak. These results are summarized in Table 2. Multiple regression analyses were performed with age as the dependent variable and the a, b, c, and d peaks as the independent variables. The c and d peaks were independent contributors to the effect of vascular age representing the elasticity of blood vessels, and the a and b peaks were not included in the model. With the c and d peaks, new dependent factors associated with age were found with the b peak. From this meaningful result, the B ratio is calculated by dividing the summation of the c and d peaks by the b peak. A widely used index, i.e., ( b - c - d - e ) / b, was found to be correlated with age (r = 0.3817, p < 0.0001) with a 95% confidence interval of 0.2444 to 0.5040. The B ratio was also confirmed to reflect aging well (r = -0.4025, p < 0.0001) with a 95% confidence interval of -0.5221 to -0.2674. In the multiple regression analysis, the c and d peaks of the independent variables were important indica- tors of vascular status (F-ratio = 14.48, p < 0.0001). Figure 3 shows a scatter diagram of the relationship between two variables. The top figure shows the correlation between age and the baPWV, and the bottom figure shows the correlation diagram between age and the B ratio.
IV. Discussion
We determined the relationships between age and the APG and the well-established baPWV in the reflection of arterial stiffness. The main findings were the following. First, age Table 2. Pearson correlation of the a, b, c, d, and e peaks with age
Correlation coefficient (r) p-value
a peak -0.0041 0.9627
b peak 0.2415 0.0016
c peak -0.3553 <0.0001
d peak -0.3191 <0.0001
e peak 0.0352 0.6532
Figure 3. Scatter diagrams of the relationship between the brachial-ankle pulse wave velocity (baPWV) and age (A) and the relation- ship between the B ratio of the acceleration photoplethysmogram and age (B).
A
90
baPWV
Age
20 30 40 50 60 70 80
2,600 2,400 2,200 2,000 1,800 1,600 1,400 1,200 1,000 800
90
Bratio
Age
20 30 40 50 60 70 80
0.5 0.0 0.5 1.0 1.5 2.0 2.5 3.0 3.5 4.0
B
was significantly and independently associated with specific indices of the APG, such as the B ratio, the c peak, and the d peak. The APG may be used to provide clinical data re- garding the progress of arterial stiffness. A novel algorithm that was newly developed for real-time extraction of APG features could be embedded as a simple diagnostic tool in a ubiquitous healthcare device, even though the APG may only actually measure peripheral arterial stiffness. As the baPWV is also considered to contain portions that are in- fluenced by peripheral arterial stiffness, the present results suggest that the APG may provide information that is quali- tatively similar to that derived from the baPWV. This study shows that the B ratio based on that APG analysis of arterial stiffness is a promising technique for the simple monitoring of atherosclerosis for a mobile healthcare device. The baP- WV provides a convenient assessment of arterial stiffness, but analysis of the baPWV is more time-consuming and complex than that of the APG. Therefore, APG analysis is a more suitable prescreening method because of its technical simplicity and shorter measurement time. Recently, the de- mand for a simple, economic, convenient, and noninvasive assessment technique in ubiquitous healthcare devices has increased. However, a clear interpretation of the PPG signal to provide diagnostic value is still lacking. The preamplifier system of the present study was robust due to the application of an FIR digital filter and removal of digitized PPG signal using an analog filter outside the microcontroller, and it overcame artifacts even in cases where the inflection points of the PPG signal were not strongly identifiable.
Conflict of Interest
No potential conflict of interest relevant to this article was reported.
Acknowledgments
This research was supported by the Hallym University Re- search Fund (No. HRF-201312-022).
References
1. Nitzan M, Babchenko A, Khanokh B, Landau D. The variability of the photoplethysmographic signal: a po- tential method for the evaluation of the autonomic ner- vous system. Physiol Meas 1998;19(1):93-102.
2. Huotari M, Vehkaoja A, Maatta K, Kostamovaara J.
Photoplethysmography and its detailed pulse waveform analysis for arterial stiffness. J Struct Mech 2011;44(4):
345-62.
3. Elgendi M. On the analysis of fingertip photoplethys- mogram signals. Curr Cardiol Rev 2012;8(1):14-25.
4. Yousef Q, Reaz MB, Ali MA. The analysis of PPG mor- phology: investigating the effects of aging on arterial compliance. Meas Sci Rev 2012;12(6):266-71.
5. Sugawara J, Hayashi K, Yokoi T, Cortez-Cooper MY, DeVan AE, Anton MA, et al. Brachial-ankle pulse wave velocity: an index of central arterial stiffness? J Hum Hypertens 2005;19(5):401-6.
6. Kang S, Fan HM, Li J, Fan LY, Miao AY, Bao Y, et al.
Relationship of arterial stiffness and early mild diastolic heart failure in general middle and aged population. Eur Heart J 2010;31(22):2799-807.
7. Yamashina A, Tomiyama H, Takeda K, Tsuda H, Arai T, Hirose K, et al. Validity, reproducibility, and clinical significance of noninvasive brachial-ankle pulse wave velocity measurement. Hypertens Res 2002;25(3):359- 64.
8. Tomiyama H, Yamashina A, Arai T, Hirose K, Koji Y, Chikamori T, et al. Influences of age and gender on re- sults of noninvasive brachial-ankle pulse wave velocity measurement: a survey of 12517 subjects. Atherosclero- sis 2003;166(2):303-9.
9. Blazek R, Lee C. Multi-resolution linear model compari- son for detection of dicrotic notch and peak in blood volume pulse signals. Anal Biomed Signals Images 2010;
20:378-86.