Determinants of Brachial-Ankle Pulse Wave Velocity in Normotensive Young Adults with Type 2 Diabetes Mellitus
Brachial–ankle pulse wave velocity (baPWV) is simple, noninvasive method which correlates well with arterial stiffness. Herein, we assessed the determinants of baPWV in
normotensive young adults with type 2 diabetes. We retrospectively enrolled 103 consecutive type 2 diabetic patients aged between 30 and 39 yr who measured baPWV with noninvasive pulse wave analyzer. The anthropometric parameters, blood pressure, pulse rate, fasting plasma glucose, fasting insulin, fasting C-peptide, HbA1c, lipid profile, hs-CRP, albuminuria status, AST/ALT, γ-GTP were checked concurrently. Also, we investigated history of smoking, alcohol drinking and medications by questionnaire. We found that maximal baPWV was positively correlated with mean blood pressure (r = 0.404, P < 0.001), heart rate (r = 0.285, P = 0.004), AST (r = 0.409, P < 0.001), ALT (r = 0.329, P = 0.001), γ-GTP (r = 0.273, P = 0.006), Urine albumin/creatinine ratio (r = 0.321, P = 0.003). By multiple linear regression, mean blood pressure and heart rate were significantly associated with maximal baPWV in male and total group. In female group, mean blood pressure was the only variable associated with maximal baPWV. These factors can be surrogate markers of arterial stiffness in this population.
Key Words: Pulse Wave Velocity; Type 2 Diabetes; Normotension Bo Gwang Choi1, Ji Hyun Kang2,
Yun Kyung Jeon3, Sang Soo Kim3, Chang Won Lee4, In Joo Kim3,5, Yong Ki Kim1, and Bo Hyun Kim3,5
1Kim Yong Ki Internal Medicine Clinic, Busan;
2Department of Internal Medicine, Dong Eui Medical Center, Busan; 3Department of Internal Medicine, Pusan National University School of Medicine, Busan; 4Department of Internal Medicine, Busan St. Mary’s Hospital, Busan; 5Biomedical Research Institute, Pusan National University, Busan, Korea Received: 23 April 2012
Accepted: 14 August 2012 Address for Correspondence:
Bo Hyun Kim, MD
Division of Endocrinology and Metabolism, Department of Internal Medicine, Pusan National University School of Medicine, 305 Gudeok-ro, Seo-gu, Busan 602-739, Korea Tel: +82.51-240-7983, Fax: +82.51-254-3237 E-mail: [email protected]
This study was supported by a grant of the Korean Health Technology R&D Project, Ministry of Health and Welfare, Republic of Korea (A070001).
http://dx.doi.org/10.3346/jkms.2012.27.11.1359 • J Korean Med Sci 2012; 27: 1359-1363 Endocrinology, Nutrition & Metabolism
INTRODUCTION
Epidemiological studies have reported that patients with type 2 diabetes mellitus (DM) have increased mortality and morbidity from cardiovascular diseases, independent of other risk factors (1, 2). Therefore, early detection of risk factors related to athero- sclerosis is necessary to decrease these risk in patients with type 2 DM. A number of methods have been applied for assessment of cardiovascular risk and subclinical atherosclerosis. Especial- ly, non-invasive modalities such as flow-mediated dilatation (FMD) of brachial artery, pulse wave velocity (PWV) and carotid intima-media thickness (IMT) have been widely used in clini- cal settings, because they have been shown to be good surro- gate markers of atherosclerosis (3-5).
Arterial stiffness has been shown to be an independent pre- dictor of cardiovascular mortality and become a useful index in the prevention and early detection of cardiovascular disease.
PWV reflects arterial stiffness, and it is a marker of both the se- verity of vascular damage and the prognosis of cardiovascular diseases in patients with hypertension or with diabetes (6-8).
Therefore, PWV is currently considered optimal, as recently de-
scribed in the consensus statement on arterial stiffness (9). Re- cently, brachial–ankle pulse wave velocity (baPWV) using a vol- ume rendering method is simple, noninvasive method which correlates well with arterial stiffness. And it is a useful tool for identifying a subgroup in the population that are at increased risk for cardiovascular events (10).
Many factors such as age, smoking, dyslipidemia, hyperten- sion , microalbuminuria, waist hip ratio, HbA1c, γGTP, C-reac- tive protein, duration of diabetes and metabolic syndrome are the known factors to affect arterial stiffness (11-17). So far, these factors affecting baPWV have been reported in various popula- tion such as patients with type 2 diabetes, hypertensive patients and metabolic syndrome. However, determinants of baPWV in normotensive young adults with type 2 diabetes have not been examined yet. This population is relatively in early stage of DM, and there is less concern about diabetic complications. So, to evaluate which factors are related to arterial stiffness in this pop- ulation can be meaningful. Herein, the purpose of this study was to assess major factors affecting baPWV in normotensive young adults with type 2 DM.
MATERIALS AND METHODS Patients
We measured baPWV with a noninvasive pulse wave analyzer (form PWV/ABI, Colin Co., Komaki, Japan) in 2,728 consecu- tive type 2 diabetic patients in Department of Endocrinology and Metabolism, Pusan National University Hospital, between January 2008 to January 2011. Among these, we retrospectively included patients aged between 30 and 39 yr (n = 145). Those who had hypertension, current antihypertensive medication, atherosclerotic vascular disease, chronic kidney disease (eGFR
< 60 mL/min/1.73 m2), moderate to severe heart disease (pre- vious coronary artery disease and heart failure with NYHA class II-IV) and low ankle brachial index (< 0.9) were excluded. Pres- ence of hypertension was defined when the subject was taking anti-hypertensive medication or measured systolic or diastolic blood pressures were same or above 130/80 mmHg. A total of 103 patients with type 2 DM were finally included in this study.
Laboratory assessment
Blood pressures (BP) were taken with a standardized sphygmo- manometer after at least 5 min of rest. The height and weight of the subjects were measured just before examining baPWV. The body mass index (BMI) was expressed as the weight in kilograms divided by squared height in meters (kg/m2). The waist circum- ference was measured in the standing position, at the level of umbilicus by a single examiner. Blood samples were collected after at least 8 hr of fasting. Plasma glucose, serum insulin, C- peptide, lipid profile, high sensitive-C-reactive protein (hs-CRP), aspartate aminotransferase (AST), alanine aminotransferase (ALT), gamma glutamyl transpeptidase (γ-GTP) were checked concurrently in study day. HbA1c was measured by high per- formance liquid chromatography using the Variant TM II Turbo (Bio-Rad Laboratories, Hercules, CA, USA). Also, we investigat- ed history of smoking, alcohol intake and medication by ques- tionnaire.
Assessment of arterial stiffness
After the subject had rested in a supine position for more than 5 min, the measurement of baPWV was conducted using a wave- form analyzer (VP-2000; Colin Co Ltd, Komaki, Japan). Electro- cardiographic electrodes were placed on both wrists, a micro- phone was placed on the left edge of the sternum to detect heart sounds, and pneumatic cuffs were placed on both arms and ankles. The cuffs were connected to a sensor that determined volume pulse form and an oscillometric pressure sensor that measured blood pressure. The characteristic points of wave- forms were determined automatically according to the pulse velocity theory. The components over 5 Hz were stored using a pass filter and the wave front was determined. The time interval between the wave front of brachial waveform and that of ankle
waveform was defined as the time interval between brachium and ankle (ΔTba). The distance between sampling points of baPWV was calculated automatically according to the subject’s height. The path length from the heart to the brachium (Lb) was measured externally and was expressed using the following equation: Lb = 0.2195 × height of the patient (cm) - 2.0734. The path length from the heart to the ankle (La) was expressed us- ing the following equation: La = 0.8129 × height of the patient (cm) + 12.328. Finally, baPWV was calculated from the follow- ing equation: baPWV = (La-Lb)/ΔTba (18).
Statistical analysis
The statistical analysis was performed using the SPSS (SPSS ver 17.0 for Windows, Chicago, IL, USA) software package. All data were expressed by mean ± S.D. for normally distributed values and median (interquartile range) for nonparametric values.
Pearson chi-square test was used to assess differences in cate- gorical data between male and female. And Student t-test and Mann Whitney U test were used to assess numerical data as ap- propriate. Bivariate correlation (Pearson’s correlation coeffi- cient) analyses were performed to analyze the relationships be- tween maximal baPWV and other numerical data. To approxi- mate normal distribution, natural log transformed value for Urine Albumin/Creatinine ratio (microalbuminuria) was used in this analysis. Linear regression analysis was performed to evaluate the association between maximal baPWV and other clinical data. And step-wise multiple regression analysis was performed to determine the correlation and independent vari- ables for maximal baPWV. A value of P < 0.05 was considered to be statistically significant.
Ethics statement
The study was approved by the institutional review board of the Pusan National University Hospital, Busan, Korea (No. 2009041).
According to this, we obtained all patients’ informed consent.
RESULTS
Clinical characteristics of the patients
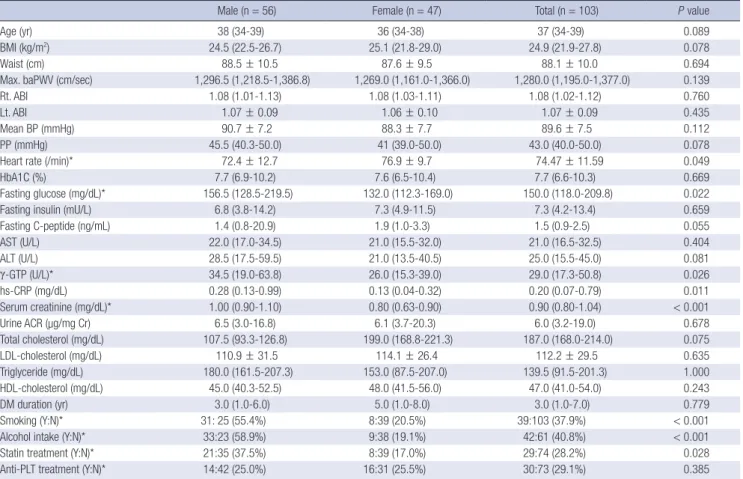
Table 1 shows the general characteristics of the study popula- tion. Pulse, fasting glucose, γ-GTP, hs-CRP, serum creatinine, smoking, alcohol intake and statin treatment were different sig- nificantly between male and female.
Correlations between maximal baPWV and other variables Table 2 shows correlations between baPWV and clinical param- eters in total patients.
Maximal baPWV was positively correlated with mean blood pressure (r = 0.404, P < 0.001), heart rate (r = 0.285, P = 0.004), AST (r = 0.409, P < 0.001), ALT (r = 0.329, P = 0.001), γ-GTP (r = 0.273, P = 0.006), urine albumin/creatinine ratio (r = 0.321, P =
0.003). We compared baPWV according to smoking, anti-plate- let treatment, alcohol intake, and statin treatment. Smoking and statin therapy showed significant positive correlation (P = 0.033, P = 0.020).
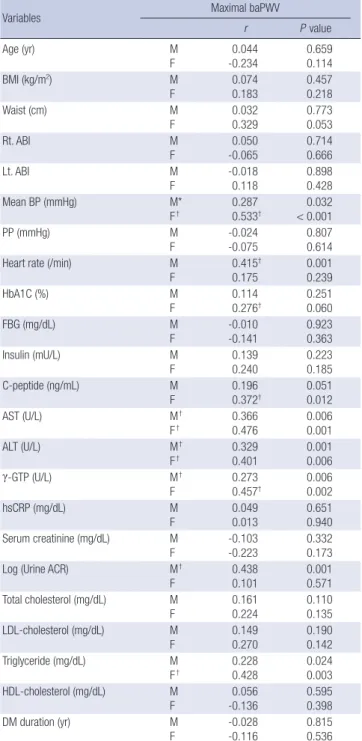
Table 3 shows correlations between baPWV and clinical vari- ables in male and female patients respectively. Mean blood pres- sure, AST, ALT, γ-GTP, and triglyceride were positively correlat- ed with maximal PWV in both groups. Heart rate and urine al- bumin/creatinine ratio were positively correlated with maximal baPWV only in male group (P = 0.001, P = 0.001). The c-peptide was positively correlated with maximal baPWV only in female group (P = 0.012).
Including these significant variables and well-known baPWV- related variables, we performed multivariate linear regression analyses for the association between several variables and max- imal baPWV (Table 4). These analyses were performed in male, female and total group, respectively. Mean blood pressure and heart rate were significantly associated with maximal baPWV in male and total group. And in female group, mean blood pres- sure was the only variable associated with maximal baPWV.
Table 1. Comparison of clinical characteristics of patients who measured brachial ankle pulse wave velocity
Male (n = 56) Female (n = 47) Total (n = 103) P value
Age (yr) 38 (34-39) 36 (34-38) 37 (34-39) 0.089
BMI (kg/m2) 24.5 (22.5-26.7) 25.1 (21.8-29.0) 24.9 (21.9-27.8) 0.078
Waist (cm) 88.5 ± 10.5 87.6 ± 9.5 88.1 ± 10.0 0.694
Max. baPWV (cm/sec) 1,296.5 (1,218.5-1,386.8) 1,269.0 (1,161.0-1,366.0) 1,280.0 (1,195.0-1,377.0) 0.139
Rt. ABI 1.08 (1.01-1.13) 1.08 (1.03-1.11) 1.08 (1.02-1.12) 0.760
Lt. ABI 1.07 ± 0.09 1.06 ± 0.10 1.07 ± 0.09 0.435
Mean BP (mmHg) 90.7 ± 7.2 88.3 ± 7.7 89.6 ± 7.5 0.112
PP (mmHg) 45.5 (40.3-50.0) 41 (39.0-50.0) 43.0 (40.0-50.0) 0.078
Heart rate (/min)* 72.4 ± 12.7 76.9 ± 9.7 74.47 ± 11.59 0.049
HbA1C (%) 7.7 (6.9-10.2) 7.6 (6.5-10.4) 7.7 (6.6-10.3) 0.669
Fasting glucose (mg/dL)* 156.5 (128.5-219.5) 132.0 (112.3-169.0) 150.0 (118.0-209.8) 0.022
Fasting insulin (mU/L) 6.8 (3.8-14.2) 7.3 (4.9-11.5) 7.3 (4.2-13.4) 0.659
Fasting C-peptide (ng/mL) 1.4 (0.8-20.9) 1.9 (1.0-3.3) 1.5 (0.9-2.5) 0.055
AST (U/L) 22.0 (17.0-34.5) 21.0 (15.5-32.0) 21.0 (16.5-32.5) 0.404
ALT (U/L) 28.5 (17.5-59.5) 21.0 (13.5-40.5) 25.0 (15.5-45.0) 0.081
γ-GTP (U/L)* 34.5 (19.0-63.8) 26.0 (15.3-39.0) 29.0 (17.3-50.8) 0.026
hs-CRP (mg/dL) 0.28 (0.13-0.99) 0.13 (0.04-0.32) 0.20 (0.07-0.79) 0.011
Serum creatinine (mg/dL)* 1.00 (0.90-1.10) 0.80 (0.63-0.90) 0.90 (0.80-1.04) < 0.001
Urine ACR (µg/mg Cr) 6.5 (3.0-16.8) 6.1 (3.7-20.3) 6.0 (3.2-19.0) 0.678
Total cholesterol (mg/dL) 107.5 (93.3-126.8) 199.0 (168.8-221.3) 187.0 (168.0-214.0) 0.075
LDL-cholesterol (mg/dL) 110.9 ± 31.5 114.1 ± 26.4 112.2 ± 29.5 0.635
Triglyceride (mg/dL) 180.0 (161.5-207.3) 153.0 (87.5-207.0) 139.5 (91.5-201.3) 1.000
HDL-cholesterol (mg/dL) 45.0 (40.3-52.5) 48.0 (41.5-56.0) 47.0 (41.0-54.0) 0.243
DM duration (yr) 3.0 (1.0-6.0) 5.0 (1.0-8.0) 3.0 (1.0-7.0) 0.779
Smoking (Y:N)* 31: 25 (55.4%) 8:39 (20.5%) 39:103 (37.9%) < 0.001
Alcohol intake (Y:N)* 33:23 (58.9%) 9:38 (19.1%) 42:61 (40.8%) < 0.001
Statin treatment (Y:N)* 21:35 (37.5%) 8:39 (17.0%) 29:74 (28.2%) 0.028
Anti-PLT treatment (Y:N)* 14:42 (25.0%) 16:31 (25.5%) 30:73 (29.1%) 0.385
Data are expressed in the mean ± SD for parametric variables and median (interquartile range) for nonparametric variables. *P < 0.05. BMI, body mass index; baPWV, brachial ankle pulse wave velocity; Max., maximal; Rt., right; Lt., left; ABI, ankle brachial index; Mean BP, mean blood pressure; PP, pulse pressure; AST, aspartate aminotransferase; ALT, alanine aminotransferase; γ-GTP, gamma glutamyl transpeptidase; hs-CRP, high sensitive C-reactive protein; Urine ACR, urine albumin creatinine ratio; LDL, low density lipo- protein; HDL, high density lipoprotein; DM, diabetes mellitus; PLT, platelet; Y, yes; N, no.
Table 2. The correlations between maximal baPWV and other variables
Variables Maximal baPWV
r P value
Age (yr) 0.044 0.659
BMI (kg/m2) 0.074 0.457
Waist (cm) 0.032 0.773
Rt. ABI -0.055 0.584
Lt. ABI 0.054 0.587
Mean BP (mmHg)† 0.404 < 0.001
PP (mmHg) -0.024 0.807
Heart rate (/min)† 0.285 0.004
HbA1C (%) 0.114 0.251
FBG (mg/dL) -0.010 0.923
Fasting insulin (mU/L) 0.139 0.223
Fasting C-peptide (ng/mL) 0.196 0.051
AST (U/L)† 0.409 < 0.001
ALT (U/L)† 0.329 0.001
γ-GTP (U/L)† 0.273 0.006
hsCRP (mg/dL) 0.049 0.651
Serum creatinine (mg/dL) -0.103 0.332
Log(Urine ACR)† 0.321 0.003
Total cholesterol (mg/dL) 0.161 0.110
LDL-cholesterol (mg/dL) 0.149 0.190
Triglyceride (mg/dL)* 0.228 0.024
HDL-cholesterol (mg/dL) 0.056 0.595
DM duration (yr) -0.028 0.815
*P < 0.05, †P < 0.01. Abbreviations as in Table 1.
DISCUSSION
In prior studies, arterial stiffness was associated with age, gen- der, mean blood pressure, heart rate, obesity, dyslipidemia and hyperglycemia (14, 19, 20). Those studies have been conducted in various groups such as healthy subjects and patients with im- paired fasting glucose, impaired glucose tolerance, DM, chron- ic kidney disease and so on (17, 21-23).
To our knowledge, this study is the first to evaluate related factors to baPWV in normotensive young adults with type 2 DM.
Blood pressure, age and DM are well known determinants of PWV. Therefore, we thought that it was meaningful to evaluate what factors were related to arterial stiffness in this newly select- ed population. We found that mean blood pressure and heart rate were significantly correlated to baPWV in male and total population of this group. Only mean blood pressure was signifi- cantly correlated to baPWV in female population.
It was noted that possible PWV-related factors such as waist circumference, body mass index, age, pulse pressure, HbA1c, ALT, γ-GTP, hsCRP, diabetes duration, albuminuria status and lipid profile did not show correlation with baPWV in this popu- lation. However, mean blood pressure and heart rate were sig- nificant predictors to baPWV.
The subjects in this study can be considered as being with short duration of diabetes and relatively healthy. Intensive com- plication tests are not usually indicated for these patients; and patients themselves do not realize the importance of such tests.
Therefore, the finding of this study may have clinical importance in this aspect. Through easy way like measuring blood pressure and heart rate, we can predict the degree of arterial stiffness in this population like other patients group with advanced diseases.
In summary, this is the first study describing the factors influ- encing to baPWV in normotensive young adults with type 2 DM.
The heart rate and mean blood pressure are significant influ- encing factors to baPWV. They can be surrogate markers of ar- terial stiffness in normotensive young adults with type 2 diabe- tes. Our study has limitation such as relatively small numbers and lack of factors of cardiovascular prognosis. For better un- derstanding of risk factors of arterial stiffness and cardiovascu- lar risk in this population, future large-scale studies including factors of cardiovascular prognosis are necessary.
Table 3. The correlations between maximal baPWV and other variables according to sex
Variables Maximal baPWV
r P value
Age (yr) M
F 0.044
-0.234 0.659
0.114
BMI (kg/m2) M
F
0.074 0.183
0.457 0.218
Waist (cm) M
F 0.032
0.329 0.773
0.053
Rt. ABI M
F 0.050
-0.065 0.714
0.666
Lt. ABI M
F
-0.018 0.118
0.898 0.428
Mean BP (mmHg) M*
F† 0.287
0.533† 0.032
< 0.001
PP (mmHg) M
F -0.024
-0.075 0.807
0.614
Heart rate (/min) M
F
0.415† 0.175
0.001 0.239
HbA1C (%) M
F 0.114
0.276† 0.251
0.060
FBG (mg/dL) M
F -0.010
-0.141 0.923
0.363
Insulin (mU/L) M
F
0.139 0.240
0.223 0.185
C-peptide (ng/mL) M
F 0.196
0.372† 0.051
0.012
AST (U/L) M†
F† 0.366
0.476 0.006
0.001
ALT (U/L) M†
F†
0.329 0.401
0.001 0.006
γ-GTP (U/L) M†
F 0.273
0.457† 0.006
0.002
hsCRP (mg/dL) M
F
0.049 0.013
0.651 0.940 Serum creatinine (mg/dL) M
F
-0.103 -0.223
0.332 0.173
Log (Urine ACR) M†
F 0.438
0.101 0.001
0.571 Total cholesterol (mg/dL) M
F
0.161 0.224
0.110 0.135 LDL-cholesterol (mg/dL) M
F 0.149
0.270 0.190
0.142
Triglyceride (mg/dL) M
F† 0.228
0.428 0.024
0.003 HDL-cholesterol (mg/dL) M
F
0.056 -0.136
0.595 0.398
DM duration (yr) M
F -0.028
-0.116 0.815
0.536
*P < 0.05, †P < 0.01. Abbreviations as in Table 1.
Table 4. Multiple regression analysis of maximal baPWV in male, female and total patients group
Variables Maximal baPWV
β coefficient P value Adjusted R2 Male*
Heart rate (/min)
Mean BP (mmHg) 0.453
0.297 0.002
0.037
0.314
Female†
Mean BP (mmHg) 0.505 0.009 0.224
Total‡
Heart rate (/min)
Mean BP (mmHg) 0.300
0.438 0.006
< 0.001
0.299
*Is adjusted for age, waist, pulse pressure, HbA1c, ALT, fasting c-peptide, hsCRP, tri- glyceride, anti-platelet treatment, duration of diabetes, statin treatment, smoking, and log (albumin/creatinine ratio); †Is adjusted for age, waist, pulse, pulse pressure, heart rate, HbA1c, ALT, fasting c-peptide, hsCRP, triglyceride, anti-platelet treatment, dura- tion of diabetes, statin treatment, smoking, and log (albumin/creatinine ratio); ‡Is ad- justed for age, sex, waist, pulse pressure, HbA1c, ALT, fasting c-peptide, hsCRP, tri- glyceride, anti-platelet agent, duration of diabetes, statin, smoking, mean blood pres- sure and log (albumin/creatinine ratio). Abbreviations as in Table 1.
REFERENCES
1. Kannel WB, McGee DL. Diabetes and cardiovascular disease. The Fram- ingham study. JAMA 1979; 241: 2035-8.
2. Almdal T, Scharling H, Jensen JS, Vestergaard H. The independent effect of type 2 diabetes mellitus on ischemic heart disease, stroke, and death: a population-based study of 13,000 men and women with 20 years of fol- low-up. Arch Intern Med 2004; 164: 1422-6.
3. O’Rourke MF, Mancia G. Arterial stiffness. J Hypertens 1999; 17: 1-4.
4. Raitakari OT, Celermajer DS. Flow-mediated dilatation. Br J Clin Phar- macol 2000; 50: 397-404.
5. Simon A, Gariepy J, Chironi G, Megnien JL, Levenson J. Intima-media thickness: a new tool for diagnosis and treatment of cardiovascular risk.
J Hypertens 2002; 20: 159-69.
6. van Popele NM, Grobbee DE, Bots ML, Asmar R, Topouchian J, Rene- man RS, Hoeks AP, van der Kuip DA, Hofman A, Witteman JC. Associa- tion between arterial stiffness and atherosclerosis: the Rotterdam Study.
Stroke 2001; 32: 454-60.
7. Laurent S, Boutouyrie P, Asmar R, Gautier I, Laloux B, Guize L, Ducim- etiere P, Benetos A. Aortic stiffness is an independent predictor of all-cause and cardiovascular mortality in hypertensive patients. Hypertension 2001; 37: 1236-41.
8. Cruickshank K, Riste L, Anderson SG, Wright JS, Dunn G, Gosling RG.
Aortic pulse-wave velocity and its relationship to mortality in diabetes and glucose intolerance: an integrated index of vascular function? Cir- culation 2002; 106: 2085-90.
9. Sugawara J, Hayashi K, Yokoi T, Cortez-Cooper MY, DeVan AE, Anton MA, Tanaka H. Brachial-ankle pulse wave velocity: an index of central arterial stiffness? J Hum Hypertens 2005; 19: 401-6.
10. Yamashina A, Tomiyama H, Takeda K, Tsuda H, Arai T, Hirose K, Koji Y, Hori S, Yamamoto Y. Validity, reproducibility, and clinical significance of noninvasive brachial-ankle pulse wave velocity measurement. Hyper- tens Res 2002; 25: 359-64.
11. Djaberi R, Beishuizen ED, Pereira AM, Rabelink TJ, Smit JW, Tamsma JT, Huisman MV, Jukema JW. Non-invasive cardiac imaging techniques and vascular tools for the assessment of cardiovascular disease in type 2 diabetes mellitus. Diabetologia 2008; 51: 1581-93.
12. Choi KM, Lee KW, Seo JA, Oh JH, Kim SG, Kim NH, Choi DS, Baik SH.
Relationship between brachial-ankle pulse wave velocity and cardiovas-
cular risk factors of the metabolic syndrome. Diabetes Res Clin Pract 2004; 66: 57-61.
13. Nakamura U, Iwase M, Nohara S, Kanai H, Ichikawa K, Iida M. Useful- ness of brachial-ankle pulse wave velocity measurement: correlation with abdominal aortic calcification. Hypertens Res 2003; 26: 163-7.
14. Benetos A, Waeber B, Izzo J, Mitchell G, Resnick L, Asmar R, Safar M.
Influence of age, risk factors, and cardiovascular and renal disease on arterial stiffness: clinical applications. Am J Hypertens 2002; 15: 1101-8.
15. Mitchell GF, Parise H, Benjamin EJ, Larson MG, Keyes MJ, Vita JA, Vasan RS, Levy D. Changes in arterial stiffness and wave reflection with advanc- ing age in healthy men and women: the Framingham Heart Study. Hy- pertension 2004; 43: 1239-45.
16. Jung CH, Yu JH, Bae SJ, Koh EH, Kim MS, Park JY, Kim HK, Lee WJ. Se- rum gamma-glutamyltransferase is associated with arterial stiffness in healthy individuals. Clin Endocrinol (Oxf) 2011; 75: 328-34.
17. Chae YM, Park JK. The relationship between brachial ankle pulse wave velocity and complement 1 inhibitor. J Korean Med Sci 2009; 24: 831-6.
18. Kubo T, Miyata M, Minagoe S, Setoyama S, Maruyama I, Tei C. A simple oscillometric technique for determining new indices of arterial distensi- bility. Hypertens Res 2002; 25: 351-8.
19. Tomiyama H, Yamashina A, Arai T, Hirose K, Koji Y, Chikamori T, Hori S, Yamamoto Y, Doba N, Hinohara S. Influences of age and gender on re- sults of noninvasive brachial-ankle pulse wave velocity measurement-a survey of 12517 subjects. Atherosclerosis 2003; 166: 303-9.
20. Sa Cunha R, Pannier B, Benetos A, Siche JP, London GM, Mallion JM, Safar ME. Association between high heart rate and high arterial rigidity in normotensive and hypertensive subjects. J Hypertens 1997; 15: 1423-30.
21. Ohnishi H, Saitoh S, Takagi S, Ohata J, Isobe T, Kikuchi Y, Takeuchi H, Shimamoto K. Pulse wave velocity as an indicator of atherosclerosis in impaired fasting glucose. The Tanno and Sobetsu Study. Diabetes Care 2003; 26: 437-40.
22. Michi S, Tomochiro A, Yoshito O, Namio H, Takao C, Nobuyuki T, Tooru H, Hisashi Y. Pulse wave velocity in subjects with impaired glucose toler- ance or diabetes mellitus. Jpn J Cardiovasc Dis Preven 2002; 37: 1-6.
23. London GM, Guerin AP, Pannier B, Marchais SJ, Benetos A, Safar ME.
Arterial wave reflections and increased systolic and pulse pressure in chronic uremia: study using noninvasive carotid pulse waveform regis- tration. Hypertension 1992; 20: 10-9.