Performance Improvement of a Micro Eco Cross-Flow Hydro Turbine
Kiyoshi Kokubu1․Toshiaki Kanemoto2․Sung-Woo Son3․Young-Do Choi†
(Received August 16, 2012; Revised September 21, 2012; Accepted November 19, 2012)
Abstract:This study is aimed to develop a new type of micro cross-flow hydro turbine which has very simple structure and relatively high efficiency. Micro eco cross-flow hydro turbine (ECFT) is proposed to apply in the ranges of very low and middle specific speeds in order to extend the operational range of the turbine. In order to not only obtain a basic data for a new design method of ECFT but also improve the turbine efficiency, experiments and CFD analysis on the performance and internal flow characteristics of the turbine model are conducted. According to the present study results, anti-recirculation block (ARB) and relatively wide turbine width with high flow rate improve the turbine efficiency.
Key words:Micro hydropower, Micro eco cross-flow hydro turbine, Anti-recirculation block, Performance, Internal flow
†Corresponding author (Department of Mechanical Engineering, Mokpo National University, E-mail: [email protected], Tel: 061-450-2419)
1 Graduated School of Engineering, Kyushu Institute of Technology, E-mail: [email protected] Tel: +81-46-251-8511
2 Faculty of Engineering, Kyushu Institute of Technology, E-mail: [email protected] Tel: +81-93-884-3418
3 Graduated School, Mokpo National University, E-mail: [email protected], Tel: 061-450-2419
1. Introduction
Among the renewable energy resources, micro hydropower systems are more preferable for stand-alone and residential electric generation than other renewable resources. This is because micro hydropower systems offer a stable, economical and renewable source of electricity that uses proven and available technologies.
In the case of very high head and critical low flow rate range of micro hydropower resources, Pelton turbine has long been used widely in the specific speed range of <70 (=nP1/2/H5/4, n:
rotational speed, P: output power, H: effective head) [min-1, kW,m] [1].
However, recently, there exists strong request of developing a very low specific speed turbine which
has very simple structure and high efficiency to be used at the very low specific speed range of micro hydropower resources [2].
Therefore, Kokubu et al. has developed a newly designed micro eco cross-flow hydro turbine(ECFT) to apply in the very low specific speed range of
≦40 and it's effectiveness has been examined [2].
Moreover, widening the operational range of a micro hydro turbine system is essential to extend the development of micro hydropower resources [3].
Therefore, in this study, newly designed micro eco cross-flow hydro turbine (ECFT) is proposed to extend the turbine's operational range to the specific speed of ≧100.
In order to not only obtain a basic data for a new design method of ECFT but also improve the
turbine efficiency, experiments and CFD analysis on the performance and internal flow characteristics of the turbine model is conducted in detail.
2. Turbine model and Numerical Method
2.1 Eco Cross-Flow Hydro Turbine Model and Experimental Setup
Figure 1 shows the schematic view of ECFT model and the turbine model is adopted for experiment. As shown in Figure 1, the inlet pipe and nozzle are vertically installed. The number of runner blade is Z=30 and the diameter of runner is d=250mm. Inlet and outlet angles of the blade are α=30° and β=87°, respectively. The widths of nozzle, runner and runner chamber are all same, b=17mm, which includes tip clearance c=2mm between front wall surface and tip of the components. By taking into consideration of the design values of effective head H=3.15m, flow rate Q= 0.0066 m3/s and rotational speed n=280 min-1 for the turbine model, relatively very narrow internal flow passage is designed to adjust flow rate of the turbine to the specific speed of =25.
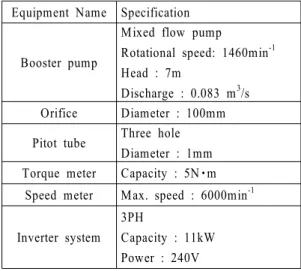
Tables 1 and 2 show specification of the turbine model and experimental apparatus.
The turbine head H and the discharge Q are given by the booster pumping system stood at the upstream, where H is determined at the center of the main shaft and estimated with the static and the dynamic pressures at the turbine inlet, and Q is measured by the orifice [4]. The turbine head is kept constant and the discharge is adjusted by the guide vane. The guide vane opening is changed from 100% (full open) to 40% for the experiment in this study. The runner speed is adjusted by the inverter system with the regenerative braking system. The rotational torque is evaluated without the mechanical torques such as the bearing and the pulley system to know the fundamental
performances of the runner.
Figure 1: Schematic view of ECFT model.
Table 1: Specification of the ECFT turbine model
Designed head H = 3.15m
Designed flow rate Q = 0.0066m3/s Diameter of runner d = 250mm Rotational speed n = 280min-1 Runner blade inlet angle α= 30°
Runner blade outlet angle β= 87°
Width of nozzle, runner and
runner chamber b = 17mm
Tip clearance c = 2mm
Designed specific speed = 25
Table 2: Specification of experimental apparatus Equipment Name Specification
Booster pump
Mixed flow pump
Rotational speed: 1460min-1 Head : 7m
Discharge : 0.083 m3/s Orifice Diameter : 100mm Pitot tube Three hole
Diameter : 1mm Torque meter Capacity : 5N・m
Speed meter Max. speed : 6000min-1
Inverter system 3PH
Capacity : 11kW Power : 240V
Air suction hole is usually adopted for the improvement of the turbine performance [5].
However, in this study, air suction hole is not used because only hydraulic performance of the turbine model without air layer in the flow passage is investigated.
Moreover, anti-recirculation block(ARB) is adopted to examine it's effectiveness on the turbine performance improvement without air suction.
As the main purpose of this study is to extend the operational range to the relatively higher specific speed range of ≧100, as well as to confirm the improvement of the turbine efficiency by the suppression of recirculation flow in the runner, additional three kinds of new ECFT model are designed for CFD analysis.
Figure 2 shows four kinds of ECFT model which are adopted for CFD analysis. Turbine model 1 has same structural configuration as that for experiment in Figure 1. Turbine model 2 is adopted to examine the effectiveness of ARB. Turbine model 3 is adopted to investigate the influence of flow passage width and flow rate in comparison with those of turbine model 1 which has relatively very narrow flow passage width. Turbine model 4 is used to confirm the effectiveness of new design model including air zone block and relatively wide flow passage.
Table 2 shows dimensions of the turbine models at the design point. Except for the dimensions in Table 3, the other dimensions are same as those in Table 1.
2.2 Numerical Analysis Method
For the numerical analysis on the turbine performance and internal flow by the variation of the turbine internal passage layout, a commercial code of ANSYS CFX [6] is adopted.
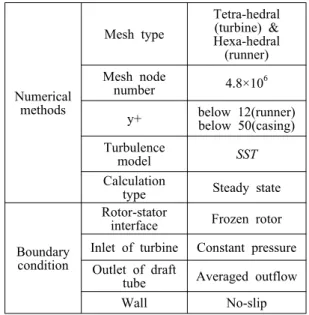
Table 4 shows the numerical methods and boundary condition.
(a) turbine model 1 (b) turbine model 2
(c) turbine model 3 (d) turbine model 4 Figure 2: Schematic view of ECFT models for CFD analysis.
Table 3: Designed dimensions of turbine models Turbine
model Width
b [mm] Flow rate Q [m3/s]
Specific speed
ARB
Exp. 1 17 0.0066 25 ×
CFD
1 17 0.0066 25 ×
2 17 0.0066 25 ○
3 100 0.0444 100 ×
4 100 0.0444 100 ○
Table 4: Numerical methods and boundary condition
Numerical methods
Mesh type
Tetra-hedral (turbine) &
Hexa-hedral (runner) Mesh node
number 4.8×10⁶
y+ below 12(runner) below 50(casing) Turbulence
model SST
Calculation
type Steady state
Boundary condition
Rotor-stator
interface Frozen rotor Inlet of turbine Constant pressure
Outlet of draft
tube Averaged outflow
Wall No-slip
(a) turbine model 1 (b) turbine model 2 Figure 3: Numerical grid systems.
The grid node number of about 4.8x10⁶ has been used as shown in Figure 3. Fine tetrahedral-grids for turbine casing and hexahedral girds for runner are employed to ensure relatively high accuracy of calculated results.
From the validation test of the numerical model using turbulence models available from the present numerical code, k-ω SST model showed reasonable turbine performance and good convergence of calculation. Therefore, k-ω SST model is used for single-phase flow calculation. Constant pressure at inlet and averaged flow rate at outlet are the used boundary conditions. CFD analysis for the turbine models is conducted under the conditions of steady state and working fluid of water at 25°C.
3. Results and Discussion
3.1 Performance Curve
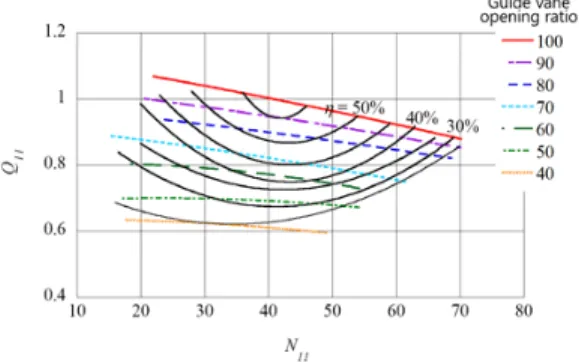
Figure 4 shows measured performance hill-chart of turbine model 1 by the rotational speed variation, where N11 is the unit rotational speed (=nd/H1/2), Q11 is the unit discharge (=Q/(dbH1/2), is the hydraulic efficiency (=P/gQH, : water density and g: acceleration of gravity).
The unit discharge Q11 increases with the increase of the guide vane opening. At the guide vane opening ratio of 100%, the efficiency takes the maximum max = 55.4% at N11 = 40.
Figure 4: Measured performance hill-chart of turbine model 1 by guide vane opening.
Figure 5: Comparison of turbine efficiencies by turbine model.
The maximum efficiency may be affected with the leakage flow at the blade tip as well as the hydraulic losses in the turbine passage, and the value is unfortunately lower than that of the usual turbine by previous study [7].
Figure 5 shows comparison of turbine efficiency by the turbine models at the guide vane opening ratio of 100%. Efficiency by experiment and CFD analysis for the turbine model 1 agrees well each other in the operational range of the rotational speeds. When the efficiency of the turbine models are compared at the rotational speed of maximum efficiency max, the calculated results reveal that turbine model 4, which is composed of ARB and relatively wide passage width, has maximum efficiency among the arrangement of the turbine models. Turbine model 2, which adopts ARB in the
runner passage, shows relatively higher efficiency than that of turbine model 1. Moreover, turbine model 3, which has wider passage width and higher flow rate than those of turbine model 1 shows higher efficiency than that of turbine model1.
From these results, it is concluded that the efficiency of the present ECFT model can be improved by the design of suppressing the hydraulic and friction losses in the turbine model.
3.2 Velocity Vectors and Velocity Distribution
From the results of the Figure 5, it is obvious that the flow velocity passing through the runner passage gives considerable effect on the turbine efficiency, which is one of the principal characteristics of impulse turbine. Therefore, velocity vectors and velocity distribution in the turbine flow passage are investigated in detail.
Figure 6 shows velocity vectors on the plane of center width in the turbine model with the guide vane opening ratio of 100%. The velocity vectors are expressed using absolute velocity vectors in the flow field of turbine model.
As a whole in the Figure 6, fluid velocity becomes accelerated along the contracted nozzle passage from the inlet. After passing through the runner blade passage at Stage 1, cross flow within the runner center gains accelerated velocity once more and then the flow enters into the inlet of Stage 2.
When the effectiveness of ARB which is adopted to suppress the recirculation flow in the runner center region is examined, internal flow pattern changes considerably as shown in Figure 6 (b).
Usually, in the center region of cross-flow turbine runner, there exists a large recirculation flow as shown in Figure 6 (a). However, as the ARB is installed, recirculation flow in the runner center region disappears and velocity of the cross-flow in the runner center region increases remarkably.
Recirculation flow
(a) turbine model 1
(b) turbine model 2
(c) turbine model 3
(d) turbine model 4
Figure 6: Velocity vectors by turbine model.
Moreover, when the influence of flow passage width and flow rate on the flow pattern of the turbine model is compared, as shown in Figure 6 (a) and 6 (c), the flow patterns reveal that fluid velocity increases by the increase of flow passage width and flow rate, which means that the friction loss on the wall surface ofthe turbine model can be decreased by designing the turbine structure into the wider passage width and more flow rate than those of the original turbine model 1.
Figure 6 (d) shows the internal velocity vectors of the turbine 4. The resulted flow pattern of calculated velocity vectors suggests that ARB and wide passage width results in the higher passage velocity in the turbine model.
Figure 7 indicates the averaged velocity distribution(
,
:tangential velocity at the best efficiency point and :runner tangential velocity at the outer tip) versus non-dimensional circumferential position, as indicated in Figure 1, in the flow passages at the guide vane opening ratio of 100% .
Figure 7 (a) shows that tangential velocity at the inlet of Stage 1 is varied with the turbine models. Especially, turbine models 3 and 4 shows relatively higher tangential velocity in the center region of non-dimensional circumferential position at Stage 1 inlet compared with those of turbine models 1 and 2.
This result confirms that the angular momentum of turbine models 3 and 4 by relatively higher fluid tangential velocity is absorbed into the runner blade and the angular momentum changes into larger output power in comparison with those of the other turbine models. This result suggests that the passage width of the turbine model gives remarkable effect on the internal flow of the cross-flow turbine and thus, performance of the turbine is closely dependent on the passage width.
(a) Stage 1
(b) Stage 2
Figure 7: Calculated velocity distribution at Stages 1 and 2 of turbine models.
Moreover, the overall value distribution of tangential velocity of turbine model 2 at Stage 1 inlet in Figure 7 (a) is higher than that of turbine model 1, which means that the difference of tangential velocity at Stage 1 inlet is influenced by the ARB and thus, the difference of the tangential velocity is proportional to the efficiency variation as shown in Figure 2.
Figure 7 (b) shows that the area by turbine 4, which is closed with the lines of velocity
distribution at the inlet and outlet of Stage 2, is wider than that of the other turbine models. The result implies that the wider area between the velocity distribution lines becomes the larger amount of output power and higher efficiency.
3.3 Output Torque Analysis and Efficiency Improvement Figure 8 presents comparison of output torque by the turbine models. The local output torque is evaluated from the calculated local output torque at each region of the runner blades. The value of ordinate means torque ratio in the case that the passage width and flow rate are normalized to same values by putting the torque at the best efficiency point as a denominator.
Remarkable output torque loss occurs in the recirculation flow region(Region 1) of turbine model 1 in comparison with those of the other turbine models. This result must be occurred by the recirculation flow locating in the center region of the turbine runner as shown in Figure 6 (a).
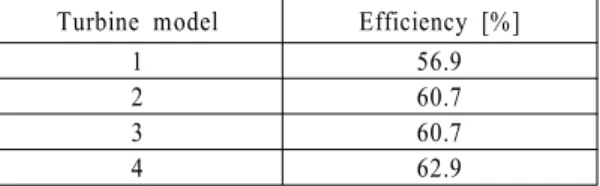
Figure 8: Comparison of output torques by calculated results
Table 4: Calculated results of efficiency improvement according to the flow passage layout
Turbine model Efficiency [%]
1 56.9
2 60.7
3 60.7
4 62.9
Therefore, ARB, as shown in Figure 1, is allocated in the runner passage of turbine model 2 to improve the turbine performance. As indicated in the Figure 5, the existence of ARB improves the turbine efficiency not only from the suppression of collision loss between the runner passage flow and shaft, but also from the elimination of loss by recirculation flow in the runner passage as shown in Figure 6 (b).
According to the passage width variation, the improvement of output torque by turbine model 3 and 4 at Stages 1 and 2 are obviously recognizable.
Higher output torque is generated by turbine models 3 and 4 at Stages 1 and 2 in comparison with those of turbine models 1 and 2.
However, in case of turbine model 4, which has relatively wide passage width(b=100mm) and ARB installation, total output torque by the turbine model reveals maximum value among the four turbine models.
Accordingly, Table 4 reveals calculated results of efficiency improvement according to the flow passage layout, where turbine model 4 shows the highest value of hydraulic efficiency among the turbine models.
4. Conclusions
1. Higher angular momentum with relatively higher fluid tangential velocity by turbine model 4, which has anti-recirculation block(ARB) and wide flow passage width, is absorbed into the runner blade and the angular momentum changes into larger output power in comparison with the case of the other turbine models. As anti-recirculation block and relatively wide passage width give remarkable effect on the internal flow of the cross-flow turbine, performance of the turbine is closely dependent on them.
2. Anti-recirculation block can be allocated in the runner passage to improve the turbine
performance. The existence of Anti- recirculation block improves the turbine efficiency not only from the suppression of collision loss at shaft, but also from the elimination of loss by recirculation flow in the runner passage.
3. In order to improve the turbine hydraulic efficiency, friction loss on the wall surface of the turbine model can be decreased with the design of the turbine structure by widening the flow passage width and increasing the flow rate.
References
[1] Turbomachinery Society of Japan, Hydro Turbine, Japan Industrial Publishing Co., Ltd.
Tokyo, 2007 (in Japanese).
[2] K. Kokubu, S.-W. Son, T. Kanemoto and Y.-D.
Choi, “Internal flow analysis on a micro cross-flow type hydro turbine at very low specific speed range,” Proceedings of the 11th Asian International Conference on Fluid Machinery, no. 195, 2011.
[3] J. Thake, The Micro-Hydro Pelton Turbine Manual, ITDG Publishing, London, 2000.
[4] K. Kokubu, K. Yamasaki, H. Honda, and T.
Kanemoto, “Effects of inner guide on performances of cross flow turbine,”
Proceedings of 26th The International Association for Hydro-environment Engineering and Research Symposium on Hydraulic Machinery and Systems, paper no. 198, 2012.
[5] Y.-D. Choi, B.-R. Shin and Y.-H. Lee, “Air layer effect on the performance improvement of a cross-flow hydro turbine,” Journal of Fluid Machinery, vol. 13, no. 4, pp. 37-44, 2010.
[6] ANSYS Inc., “ANSYS CFX Documentation,”
ver. 12, 2010, http://www.ansys.com; Accessed 1 Sep 2012.
[7] Y.-D. Choi, J.-I. Lim, Y.-T. Kim and Y.-H.
Lee, “Performance and internal flow characteristics of a cross-flow hydro turbine by
the shapes of nozzle and runner blade”, Journal of Fluid Science and Technology, vol. 3, no. 3, pp. 398-409, 2008.