D I A B E T E S & M E T A B O L I S M J O U R N A L
This is an Open Access article distributed under the terms of the Creative Commons Attribution Non-Commercial License (http://creativecommons.org/licenses/by-nc/4.0/) which permits unrestricted non-commercial use, distribution, and reproduction in any
Glycosylated Hemoglobin in Subjects Affected by Iron-Deficiency Anemia
Jari Intra, Giuseppe Limonta, Fabrizio Cappellini, Maria Bertona, Paolo Brambilla
Department of Laboratory Medicine, Desio Hospital, University of Milano-Bicocca, Desio, Italy
Previous studies have suggested that iron-deficiency anemia affects glycosylated hemoglobin (HbA1c) measurements, but the results were contradictory. We conducted a retrospective case-control study to determine the effects of iron deficiency on HbA1c levels. Starting with the large computerized database of the Italian Hospital of Desio, including data from 2000 to 2016, all non- pregnant individuals older than 12 years of age with at least one measurement of HbA1c, cell blood count, ferritin, and fasting blood glucose on the same date of blood collection were enrolled. A total of 2,831 patients met the study criteria. Eighty-six indi- viduals were diagnosed with iron-deficiency anemia, while 2,745 had a normal iron state. The adjusted means of HbA1c were sig- nificantly higher in anemic subjects (5.59% [37.37 mmol/mol]), than those measured in individuals without anemia (5.34%
[34.81 mmol/mol]) (P<0.0001). These results suggest that clinicians should be cautious about diagnosing prediabetes and diabe- tes in individuals with anemia.
Keywords: Anemia; Anemia, iron-deficiency; Diabetes complications; Glycated hemoglobin A
Corresponding author: Jari Intra https://orcid.org/0000-0003-0978-9573 Department of Laboratory Medicine, Desio Hospital, University of Milano-Bicocca, via Mazzini 1, 20833, Desio (MB), Italy
INTRODUCTION
Glycosylated hemoglobin (HbA1c) is used as a clinical indica- tor of the blood sugar level of an individual during the previ- ous three months, and the World Health Organization propos- es it as the sole diagnostic tool to determine a diagnosis of dia- betes [1,2]. Blood glucose is the main factor affecting HbA1c.
However, HbA1c measurements are influenced by other vari- ous conditions, such as hemolytic anemia [3], hemoglobinopa- thies [4], pregnancy [5], and altered by deficiency of nutrition- al factors, such as vitamin B12, folate, and iron [6-9], leading to false-negative or false-positive results. Moreover, red blood cell life may also alter HbA1c results [10]. Recently, a review de- scribed the controversies about the relationship between HbA1c and iron-deficiency anemia (IDA) [8]. In fact, previous studies showed that in subjects with or without diabetes, IDA is associated with higher HbA1c levels, which decrease upon
iron supplementation [11-13]. Other works reported that, in individuals without diabetes and with iron deficiency, HbA1c measurements had no significant changes [14]. Conversely, Sinha et al. [7] observed that HbA1c levels in anemic subjects was significantly lower than in the control group. Considering the world wide prevalence of anemia [15] and the key role of HbA1c in diagnosing diabetes, the aim of this study was to verify the effects of iron-deficiency anemia on HbA1c values in nondiabetic individuals.
METHODS
Setting and participants
Laboratory data were collected from a sample of consecutive outpatients assessed from January 2000 to November 2016, in the Italian Hospital of Desio, Lombardy. Initially, this work in- cluded the following criteria for each subject: age ≥12 years https://doi.org/10.4093/dmj.2018.0072
pISSN 2233-6079 · eISSN 2233-6087
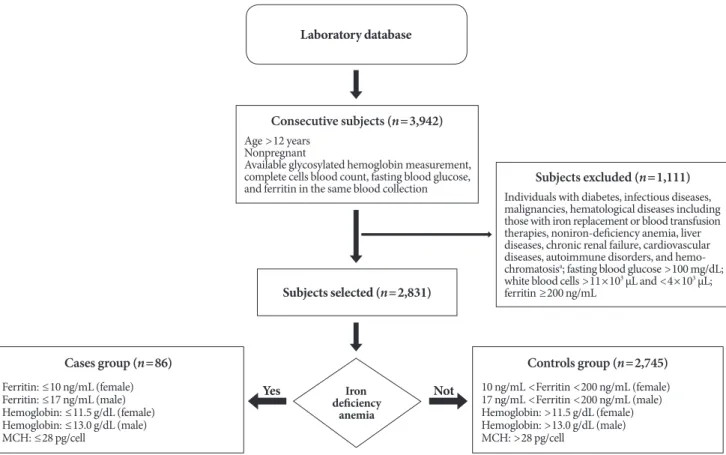
[16], nonpregnant, at least one HbA1c measurement, complete cell blood count, and tests for fasting blood glucose and ferritin during the same date of blood collection. In the second step, all subjects affected by diabetes, infectious diseases, malignancies, hematologic diseases, including those with iron replacement or blood transfusion therapies, noniron-deficiency, liver dis- eases, chronic renal failure, cardiovascular diseases, autoim- mune disorders, and hemochromatosis were excluded on the basis of diagnoses coded according to the International Classi- fication of Disease (9th revision, clinical modification). More- over, subjects with a white blood cell count less than 4×10³/µL and greater than 11×103/µL, and with fasting blood glucose levels greater than 100 mg/dL were not included. Finally, sub- jects with ferritin ≤10 ng/mL (if female) or ≤17 ng/mL (if male), hemoglobin ≤11.5 g/dL (if female) or ≤13.0 g/dL (if male), and mean corpuscular hemoglobin (MCH) ≤28 pg/cell were defined as anemic individuals (named Cases); subjects with ferritin levels between 10 and 200 ng/mL (if female) or 17 and 200 ng/mL (if male), hemoglobin >11.5 g/dL (if female)
or >13.0 g/L (if male), and MCH >28 pg/cell were defined as normal individuals (named controls) (Fig. 1).
Measures
From 2000 to 2016, different analytical instruments were used to perform analysis. HbA1c levels were obtained using ion-ex- change high performance liquid chromatography on different Menarini/ARKRAYADAMS A1c series HA (Menarini Diag- nostics, Firenze, Italy) hemoglobin analyzers. All HbA1c re- sults were reported in Diabetes Control and Complications Trial/National Glycohemoglobin Standardization Program (%) units and derived International Federation of Clinical Chemis- try (IFCC) units (mmol/mol). The levels of hemoglobin, MCH, mean corpuscular volume (MCV), mean corpuscular hemoglobin concentration (MCHC), hematocrit, red blood cell count, white blood cell count, and differential leucocytes count were measured by the automated counter Sysmex XE 2100 (Sysmex, Norderstedt, Germany). All measurements were carried out on whole blood samples collected by vacuum
Fig. 1. Flow diagram of the study for final group selection. MCH, mean corpuscular hemoglobin. aIndividuals excluded from the analysis based on diagnoses, according to the International Classification of Disease, Ninth Revision, Clinical Modification (ICD- 9-CM).
Laboratory database
Yes Not
Subjects selected (n=2,831)
Iron deficiency
anemia
Consecutive subjects (n=3,942) Age >12 years
Nonpregnant
Available glycosylated hemoglobin measurement, complete cells blood count, fasting blood glucose,
and ferritin in the same blood collection Subjects excluded (n=1,111) Individuals with diabetes, infectious diseases, malignancies, hematological diseases including those with iron replacement or blood transfusion therapies, noniron-deficiency anemia, liver diseases, chronic renal failure, cardiovascular diseases, autoimmune disorders, and hemo- chromatosisa; fasting blood glucose >100 mg/dL;
white blood cells >11×103 μL and <4×10³ μL;
ferritin ≥200 ng/mL
Cases group (n=86) Ferritin: ≤10 ng/mL (female) Ferritin: ≤17 ng/mL (male) Hemoglobin: ≤11.5 g/dL (female) Hemoglobin: ≤13.0 g/dL (male) MCH: ≤28 pg/cell
Controls group (n=2,745) 10 ng/mL <Ferritin <200 ng/mL (female) 17 ng/mL <Ferritin <200 ng/mL (male) Hemoglobin: >11.5 g/dL (female) Hemoglobin: >13.0 g/dL (male) MCH: >28 pg/cell
into tubes containing ethylenediaminetetraacetic acid (EDTA).
Ferritin levels were measured by the electrochemilumines- cence immunoassay method (ECLIA), and the fasting blood glucose level was measured by enzymatic reaction. Analysis was performed using automated chemistry analyzers, such as Modular and Cobas (Roche Diagnostics, Mannheim, Germa- ny), on plasma samples collected by vacuum in tubes with lith- ium heparin as an anticoagulant.
Statistical analysis
The database was maintained using SAS software version 9.4 (SAS Institute Inc., Cary, NC, USA). HbA1c data were fitted as controls as terms, and age at the time of tests, gender, fasting blood glucose level, and year and month (to correct imbalanc- es of the different methodologies and instruments used) of blood collection as covariates. HbA1c values were log-trans- formed to approximate normal distribution and homoscedas- ticity. Results were expressed as back transformation of least square means (i.e., the means adjusted for HbA1c [mmol/mol and %]). Hematological and biochemical values between iron- deficient anemia subjects and controls were compared using the Student t-test. According to the Bonferroni principle, a 0.05 comparison wise risk of type I error was used. P<0.05 was considered statistically significant.
Ethics statement
This study was granted the exemption from ethical approval (4525). Informed consent is not applicable due to a retrospec- tive study.
RESULTS
In this study, 3,942 consecutive nonpregnant individuals aged between 12 and 98 years with at least one HbA1c measure- ment, complete blood cells count, fasting blood glucose and ferritin values during the same date of blood collection were enrolled. Of these, 1,111 subjects were excluded, as described above. The final group consisted of 2,831 nondiabetic individ- uals, 1,508 males (53%) and 1,323 females (47%). Table 1 shows the hematological and biochemical variables of the par- ticipants. Eighty-six subjects were diagnosed with iron-defi- ciency, while 2,745 had a normal iron state (Table 1). Among the anemic group, iron deficiency was prevalent in females, with a ratio of 3.09:1. There were differences in the mean levels of hematological and biochemical parameters between sub- jects affected by IDA and controls (P<0.0001). In fact, hemo- globin, hematocrit, red blood cell count, MCV, MCH, MCHC, and ferritin values were lower in iron-deficient subjects (P<
0.0001). Differences in the mean glucose levels between the Table 1. Participants hematological and biochemical characteristics
Characteristic Casesa (n=86) Controlsb (n=2,745)
P valuec
Male Female Male Female
Number 21 65 1,487 1,258
Age at the time of tests, yr 43 (24–83) 44 (24–85) 43 (20–74) 43 (20–73)
Hemoglobin, g/dL 10.4±1.3 10.3±1.4 15.2±0.9 13.5±0.9 <0.0001
Hematocrit, % 33.0±3.5 32.7±3.7 43.7±2.4 39.9±2.5 <0.0001
MCV, fL 76.5 ±7.1 76.4±7.0 86.9±3.5 88.4±3.5 <0.0001
MCH, pg/cell 24.0±3.0 24.0±2.9 30.2±1.2 30.0±1.2 <0.0001
MCHC, g/dL 31.4±1.4 31.2±1.5 34.7±1.0 33.9±0.9 <0.0001
Red blood cells, ×106/µL 4.33±0.46 4.31±0.50 5.03±0.32 4.51±0.31 <0.0001
White blood cells, ×103/µL 6.56±1.75 6.52±1.81 6.02±0.83 6.31±1.06 0.0674
Fasting blood glucose, mg/dL 88.0±9.2 88.0±9.4 85.0±9.1 85.0±9.0 0.1526
Ferritin, ng/mL 11.0 (7–16) 5.0 (3–10) 66.0 (24–169) 40.0 (14–121) <0.0001
Values are presented as median (5th–95th percentile) or mean±standard deviation.
MCV, mean corpuscular volume; MCH, mean corpuscular hemoglobin; MCHC, mean corpuscular hemoglobin concentration.
aCases, anemic patients (hemoglobin ≤13.0 g/dL for men and ≤11.5 g/dL for women, ferritin level ≤17 ng/mL for men and ≤10 ng/mL for women, MCH ≤28 pg/cell, fasting blood glucose <100 mg/dL), bControls, non-anemic patients (hemoglobin >13.0 g/dL for men and >11.5 g/dL for women, MCH >28 pg/cell, ferritin level between 17 and 200 ng/mL, fasting blood glucose <100 mg/dL), cComparison between cases and
two groups were absent (P=0.1526).
Both the mean HbA1c values and those adjusted for the co- variates age at the time of tests, gender, year and month of blood collection, and fasting blood glucose showed significant differences between cases and controls. In fact, among subjects affected by IDA, nonadjusted and adjusted HbA1c values were statistically higher (5.71%, [38.64 mmol/mol], 5.59% [37.37 mmol/mol]) compared to those measured in the individuals without anemia (5.33% [34.78 mmol/mol], 5.34% [34.81 mmol/mol]; P<0.0001) (Fig. 2).
DISCUSSION
HbA1c is a convenient clinical test with high reproducibility, and it reflects the average blood glucose level of subjects over the previous 3 months. Several factors, such as age, ethnicity, genetics, and many other diseases, can influence HbA1c mea- surements [1,3-6]. Anemia is one of the diseases that most of- ten affects HbA1c levels, and many studies have investigated their relationship [7-9,17]. In this work, we wanted to consider the effects of IDA on HbA1c values among subjects without diabetes. Our results showed that nondiabetic individuals with IDA presented significantly higher HbA1c measurements when compared to those obtained in nonanemic subjects.
These data are in agreement with results obtained in different studies, showing that IDA causes falsely elevated HbA1c mea- surements [6,8,9,14,17]. Conversely, Sinha et al. [7] observed that the mean HbA1c was significantly less in the nonanemic group than in the anemic individuals belonging to lower so- cioeconomic groups.
After iron therapy, anemic subjects presented HbA1c levels significantly higher compared to the initial values, suggesting that nutritional deficiencies play a key role in the cause of iron deficiency [7]. The exact mechanism underlying the IDA ef- fects on HbA1c values is still unclear. A state of iron deficiency affects the lifespan of red blood cells, and the erythrocytes count is decreased, leading to an older population of red blood cells that are in contact with plasma glucose longer, causing falsely higher HbA1c measurements [17]. In a state of iron de- ficiency, the enzyme activity involved in the antioxidant de- fense system was defective, and, concomitantly, lipid peroxida- tion was increased [18,19]. In patients affected by IDA, levels of malondialdehyde (MDA), which results from lipid peroxi- dation of polyunsaturated fatty acids, was recognized as a bio- marker of oxidative stress [20], were significantly higher com- pared to those measured in the controls [19]. In vitro, HbA1c levels increased when erythrocytes were incubated with MDA, since aldehyde groups of MDA act as bridge between glucose and hemoglobin [18]. However, in vivo studies have not yet been performed to verify this biological process. Moreover, different works described a significant decrease of HbA1c val- ues after iron treatment in anemic patients, suggesting that iron deficiency might be corrected before a diagnosis of predi- abetes and diabetes is reached [11-13]. The effects of iron sup- plementation were also observed on levels of oxidative stress markers in children, resulting in a decrease of MDA levels [19].
If MDA levels decrease, the glycation of hemoglobin tends to reduce, limiting the effects on HbA1c measurements [18].
The limitation of this study is that it is a retrospective study carried out at a single hospital. Increasing the number of indi- Fig. 2. Box plots comparing cases and controls data of adjusted glycosylated hemoglobin (HbA1c) (A: HbA1c [%], B: HbA1c [mmol/mol]). Values shown are median (line within box), 25th and 75th percentiles (bottom and top of box, respectively), and mean (open diamond).
0.9 0.8 0.7 0.6
1.8 1.6 1.4 1.2
Log (HbA1c [%]) Log (HbA1c [mmol/mol])
Cases Controls Cases Controls
HbA1c (%) HbA1c (mmol/mol)
A B
viduals with IDA could improve the accuracy of the relation- ship between HbA1c and IDA. Second, confounding variables, such as body weight, smoking history, and alcohol intake, which could influence the results, are not available.
We conclude that the effects of IDA must be considered while monitoring people with prediabetes and diabetes. There- fore, a concurrent measurement of iron, hemoglobin, and HbA1c in anemic subjects might be required by clinicians to correctly interpret glycemic status and to increase the reliabili- ty of the HbA1c measurements.
CONFLICTS OF INTEREST
No potential conflict of interest relevant to this article was re- ported.
AUTHOR CONTRIBUTIONS
Conception or design: J.I., G.L.
Acquisition, analysis, or interpretation of data: J.I., G.L.
Drafting the work or revising: J.I., G.L., F.C., M.B.
Final approval of the manuscript: P.B.
ORCID
Jari Intra https://orcid.org/0000-0003-0978-9573
ACKNOWLEDGMENTS
We gratefully acknowledge the technical support of the labora- tory personnel of Desio Hospital. We also thank Dr. Elena In- tra for reviewing the manuscript.
REFERENCES
1. International Expert Committee. International Expert Com- mittee report on the role of the A1C assay in the diagnosis of di- abetes. Diabetes Care 2009;32:1327-34.
2. World Health Organization: Use of glycated haemoglobin (HbA1c) in the diagnosis of diabetes mellitus. Available from:
http://www.who.int/diabetes/publications/diagnosis_diabetes2011/
en/ (cited 2018 Oct 18).
3. Horton BF, Huisman TH. Studies on the heterogeneity of hae- moglobin. vii. Minor haemoglobin components in haemato- logical diseases. Br J Haematol 1965;11:296-304.
4. Eberentz-Lhomme C, Ducrocq R, Intrator S, Elion J, Nunez E, Assan R. Haemoglobinopathies: a pitfall in the assessment of glycosylated haemoglobin by ion-exchange chromatography.
Diabetologia 1984;27:596-8.
5. Phelps RL, Honig GR, Green D, Metzger BE, Frederiksen MC, Freinkel N. Biphasic changes in hemoglobin A1c concentra- tions during normal human pregnancy. Am J Obstet Gynecol 1983;147:651-3.
6. Ford ES, Cowie CC, Li C, Handelsman Y, Bloomgarden ZT.
Iron-deficiency anemia, noniron-deficiency anemia and HbA1c among adults in the US. J Diabetes 2011;3:67-73.
7. Sinha N, Mishra TK, Singh T, Gupta N. Effect of iron deficien- cy anemia on hemoglobin A1c levels. Ann Lab Med 2012;32:
17-22.
8. English E, Idris I, Smith G, Dhatariya K, Kilpatrick ES, John WG. The effect of anemia and abnormalities of erythrocyte in- dices on HbA1c analysis: a systematic review. Diabetologia 2015;58:1409-21.
9. Silva JF, Pimentel AL, Camargo JL. Effect of iron deficiency anemia on HbA1c levels is dependent on the degree of anemia.
Clin Biochem 2016;49:117-20.
10. Khera PK, Smith EP, Lindsell CJ, Rogge MC, Haggerty S, Wag- ner DA, Palascak MB, Mehta S, Hibbert JM, Joiner CH, Franco RS, Cohen RM. Use of an oral stable isotope label to confirm variation in red blood cell mean age that influences HbA1c in- terpretation. Am J Hematol 2015;90:50-5.
11. Coban E, Ozdogan M, Timuragaoglu A. Effect of iron defi- ciency anemia on the levels of hemoglobin A1c in nondiabetic patients. Acta Haematol 2004;112:126-8.
12. Son JI, Rhee SY, Woo JT, Hwang JK, Chin SO, Chon S, Oh S, Kim SW, Kim YS. Hemoglobin a1c may be an inadequate diag- nostic tool for diabetes mellitus in anemic subjects. Diabetes Metab J 2013;37:343-8.
13. Madhu SV, Raj A, Gupta S, Giri S, Rusia U. Effect of iron defi- ciency anemia and iron supplementation on HbA1c levels: im- plications for diagnosis of prediabetes and diabetes mellitus in Asian Indians. Clin Chim Acta 2017;468:225-9.
14. Kim C, Bullard KM, Herman WH, Beckles GL. Association between iron deficiency and A1C Levels among adults without diabetes in the National Health and Nutrition Examination Survey, 1999-2006. Diabetes Care 2010;33:780-5.
15. World Health Organization: Worldwide prevalence of anemia 1993-2005. Available from: http://www.who.int/vmnis/publications/
anaemia_prevalence/en/index.html (cited 2018 Oct 18).
16. American Diabetes Association. 15. Diabetes advocacy. Diabe-
tes Care 2017;40(Suppl 1):S128-9.
17. Grossman A, Gafter-Gvili A, Schmilovitz-Weiss H, Koren- Morag N, Beloosesky Y, Weiss A. Association of glycated he- moglobin with hemoglobin levels in elderly nondiabetic sub- jects. Eur J Intern Med 2016;36:32-5.
18. Selvaraj N, Bobby Z, Sathiyapriya V. Effect of lipid peroxides and antioxidants on glycation of hemoglobin: an in vitro study on human erythrocytes. Clin Chim Acta 2006;366:190-5.
19. Zaka-Ur-Rab Z, Adnan M, Ahmad SM, Islam N. Effect of oral iron on markers of oxidative stress and antioxidant status in children with iron deficiency anemia. J Clin Diagn Res 2016;
10:SC13-9.
20. Del Rio D, Stewart AJ, Pellegrini N. A review of recent studies on malondialdehyde as toxic molecule and biological marker of oxidative stress. Nutr Metab Cardiovasc Dis 2005;15:316-28.