1. Introduction
Power transmission towers are affected mainly by at- mospheric corrosion since all of them are served in atmos- pheric environment. When the electricity system is work- ing, Alternating Current (AC)/Direct Current (DC) inter- ference from the high-voltage transmission lines can occur around the transmission tower. Presently, according to power maintenance records, some galvanized parts of power transmission tower near the transmission lines, have significantly higher corrosion rates than that of the other part, which suggests that the electric field might pro- mote the atmospheric corrosion process of the metal.
Therefore, it is significant to study the mechanism of the effect of electric field on metal.
Since the seventies of last century, a number of labo- ratory and field studies have focused on the influence of AC and DC induced voltage on the behavior of corrosion systems. Most of the literatures have been concerned with the influence of AC on soil and solutions systems [1-5].
It has been reported that AC/DC interference from high-voltage transmission lines, can result in serious cor- rosion problems for buried pipelines. It has been demon-
strated that AC electric field behaves as a depolarizer, which can reduce both anodic and cathodic polarizations, degrade the electrochemical passivity, and enhance the corrosion rate of metal [3,6-8].
In atmospheric environments, corrosion proceeds under a thin electrolyte layer during wet- dry cycles. The corro- sion rate of metals is affected mainly by the composition of the surface corrosion products and mass transfer proc- ess of oxygen under a thin electrolyte layers (TELs). Many investigations on galvanized steel under various conditions have been reported over past decades [9,10]. Guo inves- tigated the effects of electric field on atmospheric corro- sion behavior of PCB-Cu under TELs, and demonstrated that the electric field reduce the corrosion rate of PCB-Cu owing to the aggressive ions migrating out from the PCB-Cu electrode surface under the effect of the electric field [11]. However, there has been limited work to study the effect of the external electric field on the atmospheric corrosion of zinc.
In this work, the effect of DC electric field on the atmos- pheric corrosion behaviour of zinc under a 0.35 wt% NaCl TEL was investigated by open circuit potential measure- ments, cathodic polarization and electrochemical im- pedance spectroscopy (EIS) using a homemade thin layer electrochemical cell.
The Effect of External DC Electric Field on the Atmospheric Corrosion Behaviour of Zinc under a Thin Electrolyte Layer
Qinqin Liang1, YanYang2, Junxi Zhang2,†, Xujie Yuan2, and Qimeng Chen2
1Guangxi Power Grid Electric Power Research Institute, Nanning 530023, China
2Shanghai Key Laboratory of Material Protection and Advanced Material in Electric Power, Shanghai University of Electric Power, Shanghai 200090, China
(Received November 14, 2018; Revised March 31, 2018; Accepted April 05, 2018)
The effect of external DC electric field on atmospheric corrosion behavior of zinc under a thin electrolyte layer (TEL) was investigated by measuring open circuit potential (OCP), cathodic polarization curve, and electrochemical impedance spectroscopy (EIS). Results of OCP vs. time curves indicated that the application of external DC electric field resulted in a negative shift of OCP of zinc. Results of cathodic polarization curves measurement and EIS measurement showed that the reduction current of oxygen increased while charge transfer resistance (Rct) decreased under the external DC electric field. Variation of OCP negative shift, reduction current of oxygen, and Rct increase with increasing of external DC electric field strength as well as the effect of external DC electric field on double-layer structure in the electrode/electrolyte interface and ions distribution in thin electrolyte layer were analyzed. All results showed that the external DC electric field could accelerate the corrosion of zinc under a thin electrolyte layer.
Keywords: Zinc, Polarization, EIS, Atmosphere corrosion, External DC electric field
†Corresponding author: [email protected]
2. Experimental
2.1 Materials and solution
The specimens used in the electrochemical measure- ment were pure zinc (99.95%) with a diameter of 10 mm.
It is should be noted that the hot-dip galvanizing on the surface of carbon steel is different from that of metallic zinc. The zinc coating of hot-dip galvanizing contains multiple layers with different compositions, but the sur- face layer of the coating is similar to metallic zinc. For the convenience of study, and it is the initial corrosion behavior of atmospheric corrosion in this work. Therefore, zinc coating is replaced with pure zinc. The side surface of the electrode was sealed by nylon for better hydrophilic.
The top cross-section was only exposed as working area.
Before each experiment, the electrodes were polished through successive grades of silicon carbide abrasive pa- pers from 500# to 2000#, degreased with acetone, washed with distilled water and dried with hair dryer. Then the electrodes were stored in moisture-free desiccators prior to use.
The electrolyte was 0.35 wt% NaCl solution, which was prepared from analytical grade reagent and distilled water.
The device as showed in Fig. 1a for controlling the thin liquid film in this study consisted of a homemade micro- meter, a platinum needle with a diameter of 0.5 mm, and an ohmmeter. The platinum needle was welded on the micrometer. TELs thickness measurement conducted be- fore using a three-dimensional water platform to adjust the level. When the platinum needle touches the surface of the electrode without electrolyte, the ohmmeter will beep to record the scale position of the micrometer at this time. After the electrolyte is injected, when the platinum needle comes into contact with the TEL, there will be a noticeable arc fluctuation on the surface of the electrolyte. Record the micrometer position again at this time. The difference between the two recorded micrometer positions is the liquid film thickness measured this time.
This technique can control the error range of liquid film measurements to about 5 μm.
2.2 Electrochemical measurement system
An experimental device was used to study the corrosion behaviour of zinc under external DC electric field strengths of 200 and 400 kV/m, as shown in Fig. 1. The principle of the experimental device is the same as that described in the literature [12]. A pair of stainless steel Fig. 1 (a) Schematic diagrams of the experimental arrangement for the TEL corrosion tests under a DC electric field, and (b) transverse cross-sectional and top views for the electrochemical cell.
plates were set opposite to each other, with a gap of 5 cm between them, as external electric field plates; one plate was grounded together with the zinc working elec- trode and the negative pole of a high voltage power supply (DC, LSL-BI, China), which imitated the ground mode of transmission tower, while the other plate was above working electrode and was linked to the positive pole of a high voltage power supply. A three-electrode system was applied in the electrochemical measurements. A satu- rated calomel electrode (SCE) was used as a reference electrode and platinum wires were used as the counter electrode. Pure zinc, as the working electrode, must be grounded, while the other test instruments were grounded virtually by using an isolation transformer.
Electrochemical measurements were performed by us- ing a potentiostat (CHI660C, Chenhua, China). The open
circuit potential (OCP) was measured as soon as the test began, and external DC electric fields were applied after the stabilization of OCP for 30min. The cathodic polar- ization curves of zinc under different conditions were con- structed in a typical three-electrode mode after the stabili- zation of OCP for 30 min. The cathodic polarization curves were obtained from - 1.0 V (SCE) to - 1.6 V (SCE) versus the OCP at a scan rate of 1 mV/s. The EIS measure- ments under different conditions were performed at open circuit potential with a 5mV AC perturbation at the fre- quency from 100 kHz to 10 mHz.
All the experiments were performed at room temper- ature (25 ± 1 °C).
3. Results and Discussion
3.1 OCP measurements
One of the qualitative methods to study the corrosion behavior of metals is the measurements of OCP. Fig. 2 shows the evolution of the OCP for zinc covered with thin electrolyte layer (1000μm) of 0.35% NaCl solution under external DC electric fields.
It is found that the OCP tends to become negative after applying the external DC electric fields, which can be as- cribed to the asymmetry of the zinc anode and cathode polarization [13]. Moreover, as the increasing intensity of external DC electric field, the OCP shift more negative.
3.2 Cathodic polarization measurements
Cathodic polarization was carried out to investigate the corrosion process. For zinc, the dominated cathodic re- action in corrosion process is oxygen consumption [14].
Fig. 3 shows the cathodic polarization curves of zinc cov- ered with a 1000-µm-thick electrolyte layer under differ-
1750 1800 1850 1900 1950 2000
-1.14 -1.12 -1.10 -1.08 -1.06 -1.04 -1.02 -1.00
Potential,V(SCE)
Time,s without
DC
400 kV/m 200 kV/m -101.9 mV.
-47.7mV
Fig. 2 Evolution of OCP for zinc covered with thin electrolyte layer (1000 μm) of 0.35% NaCl solution under external DC electric field.
-1.5 -1.4 -1.3 -1.2 -1.1 -1.0
-8 -7 -6 -5 -4 -3
III
II
log (Current density,A.cm-2)
Potential,V(SCE) Blank
200kV/m 400kV/m
A
I
-1.45 -1.40 -1.35 -1.30 -1.25
-5.2 -5.0 -4.8 -4.6 -4.4 -4.2 -4.0 -3.8 -3.6
Blank DC-200kV/m DC-400kV/m log i (A.cm-2 )
E (V /SCE)
(a) (b)
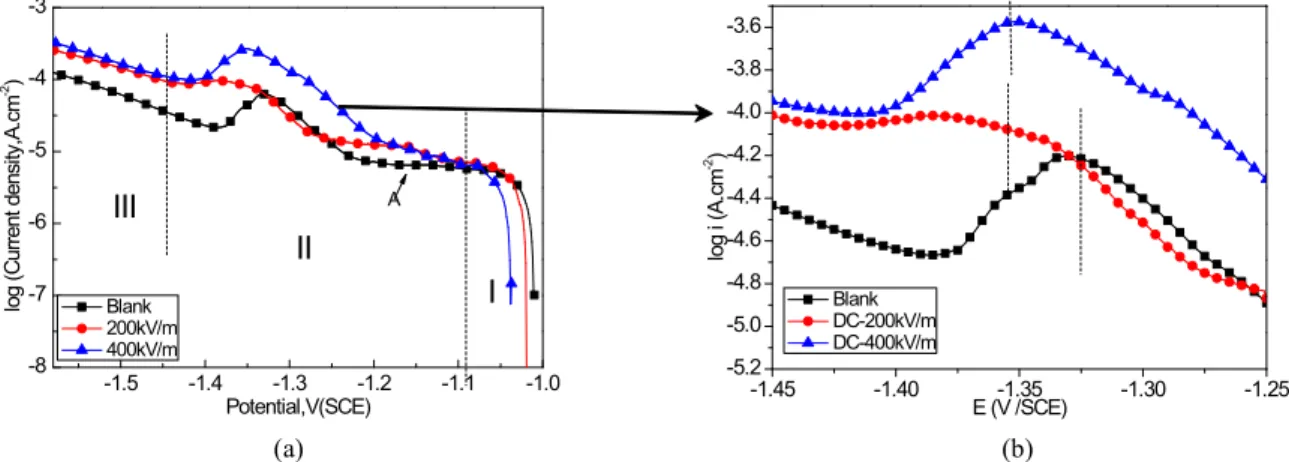
Fig. 3 Cathodic polarization curves for zinc covered with thin electrolyte layer (1000 µm) of 0.35% NaCl solution under external DC electric field (a), (b) is magnification of (a).
ent strengths of external DC electric field. Obviously, the OCP shifts negative after applying the external DC electric fields. It can be seen that the cathodic polarization curves can be divided into three regions. Region I is linear polar- ization near the OCP. Followed region II is the diffusion controlling range for oxygen reduction. When the polar- ization potential for zinc is more negative than - 1.4 V, Region III is the hydrogen evolution process. As can be observed from Fig. 3, the hydrogen evolution potential for zinc covered with a 1000-µm-thick electrolyte layer is more negative after applying the external DC electric power, which is ascribed to the increasing of pH value caused by the reduction of oxygen.
In region II (the oxygen diffusion controlling range), A is also the reduction potential range of the corrosion products [15,16].
Table 1 is the peak current density and peak potential of cathodic polarization curves shown in Fig. 3b.
Obviously, after applying the external DC electric field, the peak potential of zinc covered with TEL shifts neg- ative, and peak current density increases. Additionally, the peak potential is more negative and the peak current den- sity is larger under the 400 kV/m DC electric field. The current peak near - 1.35 V is due to the reduction of O2
which is the cathodic depolarizer.
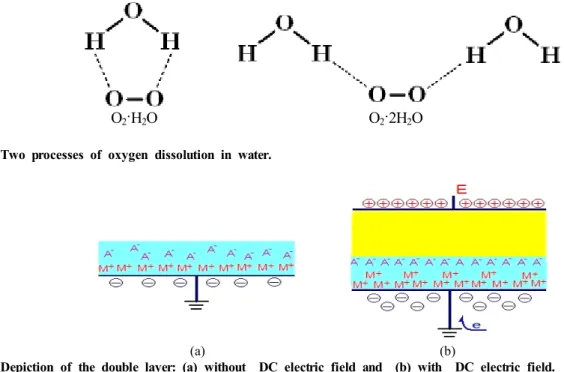
Oxygen is a non-polar molecule. Water is a polar solvent.
When the oxygen dissolves into water, hydrated oxygen molecules will form in the water as showed in Fig. 4.
O2 + H2O → O2·H2O (1)
O2 + 2H2O → O2·2H2O (2)
A few research groups have studied the change of elec- tric double layer under the low-frequency electric field [17,18],supposed that the change of the double layer was caused by the polarization of particles of the double layer, which means that the double layer model is comparable to the electric polarization model [19]. The application of an external DC electric field causes the movement of the particles of the double layers, towards the electrode having a charge opposite to that of the mobile ions in the double layer [20].Therefore, under application of an external DC electric field, the hydration oxygen molecules in the double layer can be polarized, and accelerated to- wards the electrode having a charge opposite to that of the mobile ions in the double layer. Consequently, the electrochemical activity of zinc increases.
Table 1 Peak current density and peak potential
Environment
Covered with 1000-µm-thick electrolyte layer Peak
potential(V) Peak current density (μA/cm2)
Blank -1.331 62.74
200Kv/m -1.349 80.16
400Kv/m -1.36 247.0
O2·H2O O2·2H2O Fig. 4 Two processes of oxygen dissolution in water.
(a) (b)
Fig. 5 Depiction of the double layer: (a) without DC electric field and (b) with DC electric field.
Compared with previous study [11], in this work, the zinc electrodes are grounded to simulate the power trans- mission tower; thus, the negative charges can be con- centrated on the surface of the grounded electrode, result- ing in the concentration of cations on the electrolyte side, including the amount of H+ transfer to the interface of the electrode/electrolyte. Consequently, the structure of the double-layer in the electrode/electrolyte interface should be changed, and the electrode potential shift neg- ative, as shown in Fig. 5.
In the application of the external DC electric field, the
electric fields between the two stainless steels plate can be seen as the series between electric field in the air and electric field in TELs. According to electricity theory, the electric intensity (Eout) in TELs can be calculated by equa- tion (3) [21].
(3)
where U is the voltage applied to the stainless steels, εr is the dielectric constant, d is the distance between the two stainless steels plates; and t is the thickness of TELs.
In the study, εr, d and t are all constant and therefore, Eout is in proportion to Eextra. Therefore, with increasing intensity of the external DC electric field, Eout become greater, and the OCP shifts more negative, this is favored for the cathodic reduction of dissolved oxygen [22].
3.3 EIS measurements
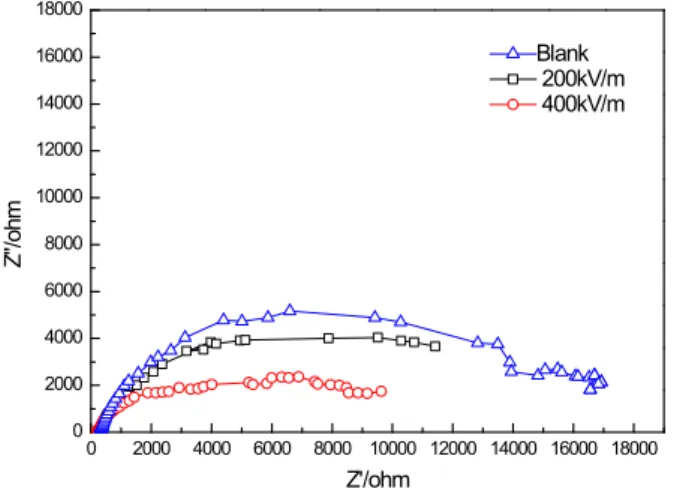
Fig. 6 shows the Nyquist diagrams of zinc covered with TEL (1000 μm) of 0.35 wt% NaCl solution under different conditions. It is seen that all Nyquist diagrams exhibit a capacitive semicircle at the high frequency and low frequency. It can be seen that the diameter of semicircle decreases gradually with increasing DC electric field, sug- gesting that the external electric filed could facilitate the corrosion of zinc.
Based on the above, Fig. 7 is Equivalent circuit for EIS fitting of Zinc covered with TEL (1000 μm) of 0.35 wt% NaCl solution under different conditions. Where Rs
is the solution resistance; CPE is constant phase angle element; Rct is the charge transfer resistance; W is the Warburg diffusion impedance.
In this study, the reciprocal of the Rct was taken as a parameter to characterize the corrosion rate [13], and the values of Rct for zinc covered with TEL (1000 μm) of 0.35 wt% NaCl solution under different conditions are calculated from Zsimpwin, which is a kind of software that can fit the EIS data. Fig. 8 is the fitting results for Nyquist diagrams of zinc under different conditions. It is shown that the corrosion rate of zinc covered with TEL (1000 μm) of 0.35 wt% NaCl solution without DC electric field is the smallest; and the corrosion rate of zinc under DC electric field increases and becomes the largest at the electric field of 400 kV/m.
4. Conclusions
The atmospheric corrosion behaviour of Zinc covered with TEL (1000 μm) of 0.35 wt% NaCl solution without and with different DC electric field was investigated by
0 2000 4000 6000 8000 10000 12000 14000 16000 18000 0
2000 4000 6000 8000 10000 12000 14000 16000 18000
Blank 200kV/m 400kV/m
Z"/ohm
Z'/ohm
Fig. 6 Nyquist diagrams of zinc covered with TEL (1000 μm) of 0.35% NaCl solution under different conditions.
Fig. 7 Equivalent circuit for EIS fitting of Zinc.
Fig. 8 Fitting results for Nyquist diagrams of zinc under different conditions.
open circuit potential measurements, cathodic polarization and EIS. Results indicate that the corrosion potential of zinc negatively shifts with applying of DC electric field.
The applying of external DC electric field can accelerate the corrosion rate of zinc, and the zinc corrosion rate in- creases with increased DC electric field intensity.
However, the influence mechanism of electric field on the atmospheric corrosion of zinc is not clear, it remains to be further studied.
Acknowledgments
The authors acknowledge the financial support of Key Project of Shanghai Education Committee (No. 12ZZ170) and National Natural Science Foundation of China (No.
51271110).
References
1. D. T. Chin and T. W. Fu, Corrosion, 35, 514 (1979).
2. J. L. Wendt and D. T. Chin, Corros. Sci., 25, 901 (1985).
3. R. Radeka, D. Zorovic, and D. Barisin, Anti-Corros. Method.
M., 27, 13 (1980).
4. D. K. Kim, S. Muralidharan, T. H. Ha, J. H. Bae, Y. C.
Ha, H. G. Lee, and J. D. Scantlebury, Electrochim. Acta, 51, 5259 (2006).
5. S. Muralidharan, D. K. Kim, T. H. Ha, J. H. Bae, Y. C.
Ha, H. G. Lee, and J. D. Scantlebury, Desalination, 216, 103 (2007).
6. S. Goidanich, L. Lazzari, and M. Ormellese, Corros. Sci., 52, 491 (2010).
7. R. W. Bosch, and W. F. Bogaerts, Corros. Sci., 40, 323 (1998).
8. C. M. Movley, Proc. Corrosion 2005 Conf., pp. 1 - 8, Houston, Texas, NACE (2005).
9. A. P. Yadav, A. Nishikata, and T. Tsuru, Corros. Sci., 46, 169 (2004).
10. V. Barranco. S. Feliu Jr, and S. Feliu, Corros. Sci., 46, 2221 (2004).
11. H. L. Huang, X. P. Guo, and Z. H. Dong, Corros. Sci., 53, 1700 (2011).
12. Y. L. Cheng, F. H. Cao, J. F. Li, J. Q. Zhang, J. M. Wang, and C. N. Cao, Corros. Sci., 46, 1649 (2004).
13. H. L. Huang, Z. Q. Pan, X. P. Guo, and Y. B. Qiu, Corros.
Sci., 75, 100 (2013).
14. T. H. Muster and I. S. Cole, Corros. Sci., 46, 2319 (2004).
15. B. Zhang, H. B. Zhou, E. H. Han, and K. Wei, Electrochim.
Acta, 54, 6598 (2009).
16. A.P. Yadav, A. Nishikata, and T. Tsuru, J. Electroanal.
Chem., 585, 142 (2005).
17. D. L. Klass, J. Appl. Phys., 38, 67 (1967).
18. D. L. Klass, J. Appl. Phys., 38, 75 (1967).
19. H. Block and J. P. Kelly, J. Phys. D: Appl. Phys., 21, 1661 (1988).
20. T. C. Jordan, IEEE T. Electr. Insul., 24, 849 (1989).
21. D. Y. Gao, Yuxi Col. J., 8, 82 (1986).
22. A. Panchenko, M. T. M. Koper, T. E. Shubina, S. J.
Mitchell, and E. Roduner, J. Electrochem. Soc., 151, A2016 (2004).