The Effect of Financial Determinants on Corporate Cash Holdings:
Evidence for KOSDAQ-listed Small and Medium Enterprises in the
Domestic Capital Market
Hanjoon Kim
Division of Business Administration, Hoseo University
국내 자본시장에서의 코스닥 상장 중소기업들의 현금유동성 수준의
재무적 결정요인들에 대한 심층 분석
호서대학교 경영대학 경영학부김한준
Abstract This study addresses results obtained in the empirical analysis to identify financial components of corporate cash holdings in the Korean capital market. Given the possible financial spillover associated with the ongoing COVID-19 pandemic, the study aims to detect financial factors that control or adjust the level of cash reserves, to maximize the firm value. As sample observations, small and medium enterprises (SMEs) listed on the KOSDAQ exchange were examined, considering that relatively few studies have been conducted for the SMEs as compared to large enterprises. Based on the various econometric analyses with an absolute and a relative bases, the market-value based leverage ratio and non-debt tax shield were found to have negatively significant effects on cash holdings, while agency cost of equity showed a positive linkage to the level. It was further revealed that time-lagged effects between cash holdings in the previous year and business risk did not exist across the models. In contrast, in terms of the speculative motive, KOSDAQ-listed SMEs were observed to realize current growth opportunities supported by the level of cash reserves. We believe that the results of the current study can be applied to explore for optimizing cash savings, which will subsequently enhance the value of SMEs.
요 약 본 연구에서는 국내 자본시장에서의 기업의 현금유동성 수준에 대한 재무적 결정요인들을 분석하기 위한 실증연 구가 수행되었다. 연구의 주된 목적은 현재까지 진행 중인 코로나19의 향후 경제, 금융부문에서의 파급효과를 가정하여, 기업 가치 감소에 대비한 가치 극대화하기 위한 현금유동성 수준의 재무적 결정요인들을 분석하는 것이다. 기존의 대기 업들에 대한 선행연구들과 비교하여, 중소기업들에 대한 추가 연구가 수행되어야 할 것으로 판단하여, 본 연구에서는 표본기업으로서 코스닥 시장에 상장된 국내 중소기업들이 선정되었다. 연구방법론과 관련하여, 다양한 계량경제적 방법론 들이 절대적 그리고 상대적인 견지에서 응용되었다. 첫 번째 가설에서는 시장가치 기준의 부채 비율과 비부채성 법인세 절감효과를 대용하는 설명변수들이 현금유동성 수준과 각각 유의미한 음(-)의 관계를 나타냈으나, 자기자본 대리인비용 에 대한 대용변수는 양(+)의 관계로 판명되었다. 또한, 과거 연도의 현금유동성과 기업위험도 간에는 통계적으로 유의성 있는 이연효과가 존재하지 않았으나, 해당 중소기업들의 현금유동성은 성장기회를 실현하기 위한 자본조달 목적으로 활 용되는 것으로 추정되어, 이는 현금유동성 보유 동기 이론 중 투기적 동기와 부합된다고 판단된다. 본 연구 결과는 향후 해당 중소기업들의 가치 제고를 위한 최적의 현금유동성 수준을 분석하기 위하여도 활용될 수 있을 것으로 기대된다.
Keywords : Cash Holdings, Financial Determinants, Global Financial Crisis, Industry Effect, Small and Medium Enterprises
This research was supported by the Academic Research Fund of Hoseo University in 2020. (#20200810)
*Corresponding Author : Hanjoon Kim(Hoseo Univ.) email: [email protected]
Received May 20, 2021 Revised June 22, 2021 Accepted July 2, 2021 Published July 31, 2021
1. Introduction
The study investigates one of the ongoing contemporary, but still controversial issues that may have drawn much attention to academics and practitioners in the filed of modern finance.
To specify, financial attributes to determine a level of corporate cash holdings are empirically examined for firms with headquarters in the Korean capital market during the post global financial turmoil period. In particular, along with theoretical financial factors, industry effects are examined in the study. Assuming possible economic or financial spillover in relation to the ongoing COVID-19, it is a main objective of this study to identify financial components which may be to adjusted for the intensity of cash reserves to enhance firm value. In terms of the finance theory, there are three primary motives for firms to maintain orporate cash holdings [1].
First, a firm sustains cash holdings for a transaction motive that is related to make routine payments on a daily basis. Second, precautionaiy motive is another corporate cause to keep cash reserves for safety reason against uncertainty of unforeseen future cash shortages.
Finally, it may sustain cash balance to support possible investment opportunities, that is related to a speculative motive. Consequently, a firm may attain the optimal level of cash holdings in terms of a trade-off relationship between benefits and costs of excess cash holdings that may arise from the aforementioned motives. As presented in Al-Najjar [2], the optimal level of cash holdings may be attained by a net gain or loss related to marginal cost and benefits.
Followings are primary motivations to implement this particular study. First, on a virtuous cycle, firms are likely to conventionally maintain cash reserves for a speculative motive to take advantage of future investment opportunities. For instance, it was reported that the amount of cash holdings held by
KOSPI-listed Samsung Electronics, Co. was estimated at KRW 104.1 trillion as of the fiscal year end of 2018. The scale in amount was larger than the amount at the end of the year 2017 by 24.5%, whose main purpose is to spend in M&A activities in high-tech industries [3].
However, given the ongoing circumstances surrounding the capital markets, the unprecedented pandemic situations related to the COVID-19 may result in stagnant or downturn conditions in terms of economic perspectives. Consequently, it is plausible for domestic firms to reserve higher level of cash holdings for a precaution motive. Therefore, it is of interest or concern to identify financial characteristics of corporate cash holdings for firms in the domestic capital market. Second, relatively little research attention has been paid to the domestic small and medium enterprises (hencefore, the SMEs), to examine financial factors of cash reserves. In other words, in a majority of the previous studies, large enterprises (the LEs) had been tested to detect financial factors of cash holdings in the international and domestic context. To specify, the SMEs listed on KOSDAQ exchange are empirically tested to examine financial determinants of the intensity of cash holdings in this study. Finally, for a robustness check, various empirical methodologies are applied to derive results of each relevant hypothesis tested during the era of the post global economic crisis, as described later. To test for the hypotheses, the effects of corporate business risk and growth potential on corporate cash holdings are also tested for the SMEs in the domestic capital market.
2. Literature Review
In the section, a majority of the previous literature in terms of the subject of corporate cash holdings are chronologically reviewed in the
international and domestic context. Most of them had been referred in the previous studies on the analogous subject of this study. In the study of Lian et al. [4], it summarized the anticipated benefits of reserving cash from a company's point of view such in term of providing more certainty (or financial flexibility), reputation, and investment opportunities. They tested proposed financial characteristics to examine cash holdings of Chinese firms during the period (1999-2009) inclusive of the global financial crisis time.
Tobin's Q and the status as a financially unconstrained firm showed statistically significant impacts on the dependent variable. But, firm size, leverage, net working capital, and capital expenditures, negatively affected on the variable.
As a conclusion, they argued that domestic firms in China may maintain cash holdings as precautionary motive as in the the U.S. firms.
Subramaniam et al. [5] tested a relationship between firm structure and its cash Empirically, firm size, leverage, Tobin's Q, R&D expenditures, investment,working capital, cash-flow, dividend payment, bond rating, and volatility of cash-flow, overall showed statistical significance to affect the level of industry-adjusted cash holdings of the U.S.
sample firms. Shah [6] performed empirical tests on the components on a firm's cash holdings for the firms listed on the stock bourse in Pakistan.
The author found that a degree if a firm’s short-term financing and its liquidity ratio other than cash holdings showed negatively significant inpacts on the level of cash holdings, respectively.
However, there were statistically significant and positive relationships on cash holdings with respect to a firm's growth opportunities, size, dividend payments, and cash flow. More interestingly, the ratio of the cash-to-assets for domestic firms, was, on average, almost equivalent to those of the developed countries, which was not generally expected in theory. In the study of Gill and Shah [1], the determinants of corporate cash holdings for the 166 Canadian
films listed in Toronto Stock Exchange for the period, (2008-2012), were investigated. These included the market-to-book value ratio, cash flow to net asset ratio, net working capital-to-asset ratio, leverage, firm size, dividends as well as board size, CEO duality, and industry dummy variables. They found positive relationships between cash holdings and market-to-book ratio, net working capital, and board size for the Canadian manufacturing industry. AI-Najjar [2] examined financial determinants of corporate cash holdings in emerging capital markets inclusive of the 'BRICs' markets. Moreover, the results obtained from these emerging nations were compared with the profile of the cash reserves derived from the U.S.
and the UK markets. By employing five explanatory variables such as leverage, dividend payout ratio, profitability, liquidity, and size along with controlling for time effect (dummy), the author found that most of the independent variables had statistically significant effects on the level of cash holdings across the investigated nations inclusive of the U.S. and the UK.
Furthermore, the author argued that firm specific financial characteristicss such as leverage, dividend payout ratio and firm size, may be more important in determining cash holding decision.
Anjun and Malik [7] summarized that cash reserves were affected by leverage, net working capital, investment opportunity and firm size. Among the theoretical explanatory variables, (i.e., firm size, net working capital, leverage, cash conversion cycle, sales growth), all of the variables (except sale growth) were found to be statistically significant which may affect the decision. In the study of Farinah and Prego [8], the results were presented for the financial factors to affect the level of liquidity for the domestic firms headquartered in Portugal. They found that there was positive persistence in cash holding liquid assets in terms of the lagged dependent variables and also both the cash-flow and its variability
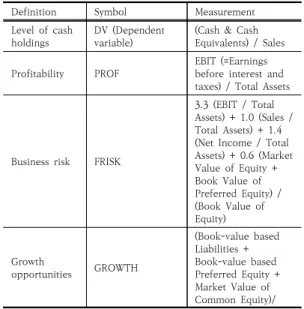
Definition Symbol Measurement Level of cash
holdings DV (Dependent
variable) (Cash & Cash Equivalents) / Sales
Profitability PROF EBIT (=Earnings
before interest and taxes) / Total Assets
Business risk FRISK
3.3 (EBIT / Total Assets) + 1.0 (Sales / Total Assets) + 1.4 (Net Income / Total Assets) + 0.6 (Market Value of Equity + Book Value of Preferred Equity) / (Book Value of Equity)
Growth
opportunities GROWTH
(Book-value based Liabilities + Book-value based Preferred Equity + Market Value of Common Equity)/
Table 2. Definition and symbol of proposed variable 1. Financial data for all variables are available for at least 9
years covering from the year 2010 to 2018.
2. Firms are listed on the KOSDAQ exchange as of the end of the fiscal year of 2018.
3. All financial data are collected on the basis of the consolidated financial statements, if available.
4. Data are included in the population of the database of KisValue sourced by the NICE.
5. Sample firms are categorized into two subsamples such as the small & medium enterprises (SMEs) and the larger enterprises (LEs) at the end of the fiscal year 2019, as classified by the KisValue database. The criteria for classification follows the Enforcement Decree of the Framework Act on Small and Medium Enterprises” enacted by the Korean government.
6. Firms in the financial and regulated industries are excluded_in the final dataset.
Table 1. Criteria for sample firms listed in KOSDAQ Exchange in the post global financial turmoil period
revealed positively significant relationship with the dependent variable. They presented that micro / small size firms did exhibit greater difficulties to access credit as well attach greater value to the possession of liquid assets, as against large sized domestic firms. Horioka and Terada-Hagiwara [9]
analyzed that firms generally increased their cash savings during the sample period (2007-2011) across developed and developing countries. The market price to book-value ratio proxied for Tobin's Q showed its positive association with the dependent variable. But, firm size effect was stronger on the increase of the cash reserves for smaller size firms than that of larger size counterparts. In the study of Kim [10], several significant findings on the financial characteristics to affect cash holdings were evidenced by utilizing various methodologies for statistical estimations.
Financial or managerial implications with discussion were suggested in the study for each pronounced factor inclusive of cash flow, market-to book-value ratio, reinvetments and agency costs. Given that the chaebol firms were also subject to domestic financial constraints, they may increase cash reserves as capital for future investment opportunities or repayment of existing debt, rather than external financing burdened by high costs of capital.
3. Empirical Research Settings
3.1 Sampling criteria and proposed variablesThe criteria to finalize the sample observations of the SMEs with headquarters in the Republic of Korea, are presented in Table 1.
To specify, the entire KOSDAQ listed sample firms are finalized as 837 firms across the 25 domestic industries, that consist of 349 large enterprises (LEs) and 488 small and medium enterprises (SMEs) during the investigated period.
Regarding the descriptive statistics for the sample of KOSDAQ-listed SMEs, the statistics for
mean and standard deviation for cash holdings (DV) were estimated at 0.1407 and 0.1247, respectively, while those of the counterparts of the LEs were 0.1202 and 0.1140. Moreover, the statistics (i.e. mean : standard deviation) for the explanatory variables for the SMEs are (0.0119 : 0.0978) for PROF, (2.4109 : 13.78953) for FRISK, (24.4875 : 0.8251) for SIZE, (0.7709 : 12.9168) for TASSET, (0.3166 : 0.2048) for MLEVER, (0.0463 : 0.1288) for AGENCY and (0.0338 : 0.0739) for FOS, respectively.
Total Assets
Firm size SIZE Natural Logarithm of
Sales Amount Change in
tangible assets TASSET (Tangible Assetst – Tangible Assetst-1) / Total Assetst-1)
Market-value
based leverage MLEVER
Total Liabilities / (Book-value based Liabilities + Book-value based Preferred Equity + Market Value of Common Equity) Agency cost AGENCY
(R&D Expenses + Advertising Expenses) / Sales
Foreign
ownership FOS Proportion of Foreign
Ownership in Common Equity Non-debt tax
shield NDTS (Depreciation +
Amortization) / Total Assets
In selecting explanatory variables adotped finally in the models, the following criteria are principally considered. First, most of the variables are theoretically supported by modern finance as proposed determinants of corporate cash holodings. Second, the result of each variable may empirically have compatible or conflicting results with the findings in the previous literature inclusive of Gill and Shah [1]
and Kim [10]. Finally, all the financial data for each variable are available during the sample period. Moreover, the variable of FRISK as a proxy for business risk is defined as that in the study of Shi [11], that are analogous to the conventional Altman’s Z-score in finance. By referring to the guidelines adopted by Czarnitzki and Thorwarth [12], that also generally follow the criteria established by the OECD (Organization for Economic Co-operation and Development). 8 domestic manufacturing industries are classified as a high-tech sector in this study, that consists of the chemistry industry, the pharmaceutical industry, the machinery industry, the electric and electronic industry, the medical precision industry, the transportation equipment industry, the professional science & technology service
and the publishing, media & information service industry, among the entire 25 domestic sample industries, as in the Kim [13]. Meanwhile, among the entire sample period of 9 years, the year 2010 was adopted as a baseline one to define annual change in the proposed variables.
3.2 Hypothesis Postulation
In the section, three primary hypotheses are postulated to be tested for financial characteristics of corporate cash holdings for the SMEs.
<First null hypothesis on corporate financial aspects for the SMEs with headquarters in the domestic capital market>
H0: In terms of financial determinants of the level of corporate cash holdings empirically found in the internatioal or domestic literature, there may not exist any financial factors to affect the level for KOSDAQ-listed SMEs in the post-period of the global financial turmoil.
To illustrate, static panel data, robust regression, Tobit regression and stepwise regression models were are separately applied for the sample observations in the study. These methodologies for estimation were also frequently used in the previous literature inclusive of Kim [13] to make inferences on the cross-section and time-series type of a data set. On the first methodology of the static panel data model, results derived only from the random effects and pooled OLS models (except the fixed efffects model) were used for estimation, due to the time invariant characteristics of industry classifications during the sample period. Moreover, by considering the characteristics of the dependent variable (i.e.
corporate cash holdings) whose numeric value is bounded from 0 to positive one, Tobit model is also employed for estimation. A stepwise regression model as a complementary method, was run to confirm the results obtained from the other techniques. It is expected that legitimate and redundant econometric issues such as heteroscedasticity and autocorrelation of error
variance may be mitigated by applying the stepwise method, as presented by Palenzuela and Bobillo [14]. Furthermore, conditional quantile regression (CQR) model is empirically performed to analyze the hypothesis by categorizing the entire sample firms into each corresponding quantile. The CQR model was originally developed by Koenker and Hallock [15], that may provide an efficient mehodology to predict estimators by adjusting an absolute value (to yield a median). The general theory of the model is presented below, as outlined by Fattouh et al. [16].
Let yi, xi, (where i=1,. . .,n) be a sample from a population, where xi is a (Kx1) vector of regressors. Assuming that the θth quantile of the conditional distribution of yi is linear for xi, CQR model is modeled as follows:
yi = xi'αθ + μθi
Quantθ (yi┃xi) ≡= {y: Fi(y┃x)θ} = xi'α Quantθ (μθi┃xi)= 0
,where Quantθ (yi┃xi) indicates the θth conditional quantile of yi on the regressor vector of xi'. αθ is the unknown vectors of parameters to be estimated for varying values of θ in (0,1).
μθ is the error term which is assumed to be a continuously differentiable c.d.f. Fμθ (.|x) and a density function fμθ(.|x). By varying the value of θ from 0 to 1, we trace the entire distribution of y conditional on x. The estimator for αθ is:
Min
,where ρθ(μ) is the check function as ρθ(μ) = θμ if μ ≥ 0. Otherwise, (θ-1)μ.
The check function specifies that positive and negative values are asymmetrically assigned varying weights, based on the positive and negative residuals, and a linear programming method for optimization is employed to estimate each coefficient that minimizes the weighted sum of absolute deviations between the dependent and the independent variables, as described in Arshanapalli and Nelson [17].
<Second null hypothesis on financial aspects
to compare two subsets of the sample firms>
H0: Given a theoretical difference of technological development in business operation, KOSDAQ-listed SMEs in the high-tech sector (or the low-tech sector) may not possess a financial factor to discriminate from the LEs in the same sector during the sample period.
As for the second hypothesis test, it compares two subsample groups (i.c. the SMEs vs. the LEs) by utilizing binary choice models from a statistical viewpoint. To specify, two groups are separately analyzed to make a relative comparison, that is divided by a technical sector (i.e. high-tech vs. low-tech sector). Concerning the estimation for the hypothesis, logit, probit model and complementary log-log (CLOG) regression models (with ascending and descending order) that are presented in Allison [18], are used to identify significant financial elements between the two subsample firms.
<Third null hypothesis on the motive of corporate cash holdings for KOSDAQ-listed SMEs〉
H0: Assuming the possible financial spillover effects associated with the ongoing COVID-19 pandemic, the SMEs may not reserve their cash liqudity to prepare for future growth opporutnities or to mitigate business risk, in terms of the theory of cash holidng motives.
In relation to the motive of corporate cash holdings, it is of interest to examine time-lagged effects between the dependent variable of cash holdings and growth potential, and also business risk. To analyze these relationships, the variable of GROWTH is employed as a proxy to represent the speculative motive, whereas FRISK is adopted as a proxy for precautionary motive in the model, as further investigated in Kim [19]. Any time-lagged effects between aforementioned variables and the dependent variable (i.e., Lag DV3) are tested after controlling industry effects.
Consequently, a trade-off relationship between the two motives as well as a time-duration between cash holdings and each proxy variable
IDV
Estimated coefficient (Random effects model)
Estimated coefficient (Tobit reg.
model)
Estimated coefficient (Stepwise reg.
model)
Intercept 0.184* 0.203* 0.187*
PROF 0.006 0.032 0.038*
FRISK 0.001 0.001 <N.A.>
MLEVER -0.162* -0.207* -0.206*
SIZE -0.001 -0.001 <N.A.>
GROWTH 0.001 -0.001 <N.A.>
TASSET -0.001 -0.001 <N.A.>
AGENCY 0.049* 0.035* 0.040*
FOS 0.122* 0.053* <N.A.>
NDTS -0.584* -0.486* -0.473*
<Note> * indicates a statistical significance at the 5% level and
<N.A.> denotes an insignificance of the coefficient at the 5%
entry and deletion levels.
Table 3. Financial determinants of cash holdings for KOSDAQ listed SMEs after the global financial turmoil
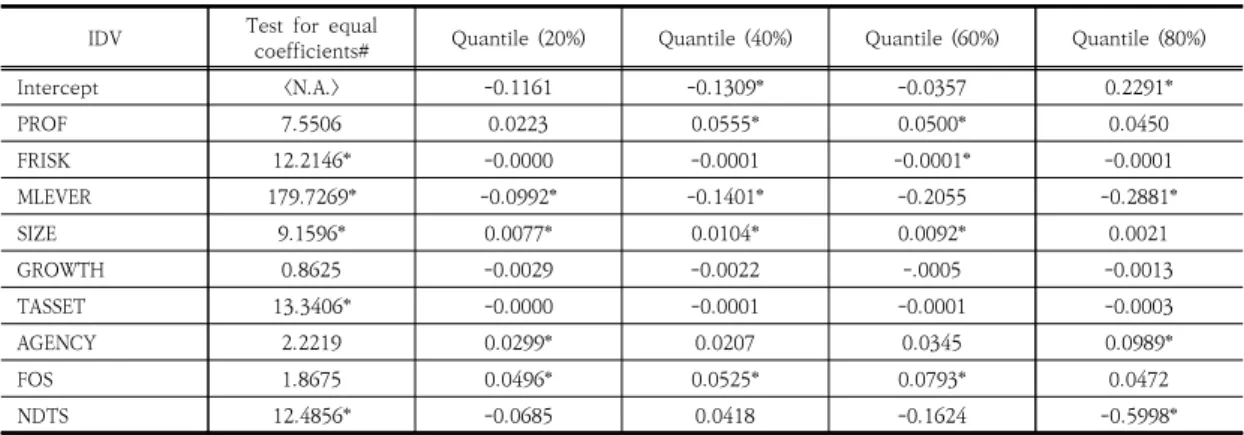
IDV Test for equal
coefficients# Quantile (20%) Quantile (40%) Quantile (60%) Quantile (80%)
Intercept <N.A.> -0.1161 -0.1309* -0.0357 0.2291*
PROF 7.5506 0.0223 0.0555* 0.0500* 0.0450
FRISK 12.2146* -0.0000 -0.0001 -0.0001* -0.0001
MLEVER 179.7269* -0.0992* -0.1401* -0.2055 -0.2881*
SIZE 9.1596* 0.0077* 0.0104* 0.0092* 0.0021
GROWTH 0.8625 -0.0029 -0.0022 -.0005 -0.0013
TASSET 13.3406* -0.0000 -0.0001 -0.0001 -0.0003
AGENCY 2.2219 0.0299* 0.0207 0.0345 0.0989*
FOS 1.8675 0.0496* 0.0525* 0.0793* 0.0472
NDTS 12.4856* -0.0685 0.0418 -0.1624 -0.5998*
<Note> # indicates a statistic of chi-square for each corresponding variable to test for equal coefficients across quantiles. * denotes a statistical significance at the 5% level.
Table 4. Results of the variables (IDVs) on cash holdings for KOSDAQ-listed SMEs in the CQR model.
are examined in the hypothesis. To analyze, three time-lagged variables for GROWTH and FRISK that represent each prior fiscal year are employed in each relevant model, along with the variable representing a current year.
4. Analysis and Discussion
4.1 Results of the first hypothesis testAs explicated in the previous section, financial components to account for the intensity of cash holdings for the SMEs are reported in Table 3.
To analyze, MLEVER and NDTS had statistically significant and negative relationships with cash holdings, while AGENCY had a positive linkage to the dependent variable (DV). In terms of the industry effect on the DV, the following industries revealed importance to affect the cash holding intensity in the majority of the models:
IND5 (the pharmacetical industry), IND14 (the retail distribution industry), IND17 (the publishing, media and information service industry), IND20 (the construction industry), IND22 (the facilities management and support service industry) and IND23 (the real estate and lease industry). For reference, the baseline industry among the industry dummy variables
employed in each model is set to be the food and beverage industry. In the meantime, further analysis was conducted to identify financial factors to affect the level of cash holdings (DV) by applying the COR method, whose results are presented in Table 4. Among the nine proposed variables (IDVs), MLEVFR, SIZE and FOS were found to be as common components to determine the DV across the majority of the categorized quantiles.
The market-value based debt ratio overall
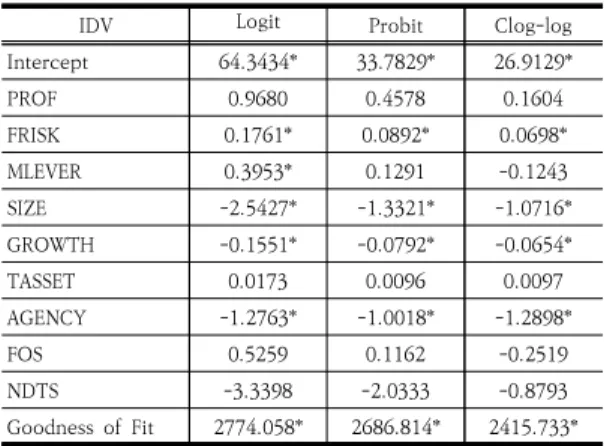
IDV Logit Probit Clog-log
Intercept 64.3434* 33.7829* 26.9129*
PROF 0.9680 0.4578 0.1604
FRISK 0.1761* 0.0892* 0.0698*
MLEVER 0.3953* 0.1291 -0.1243
SIZE -2.5427* -1.3321* -1.0716*
GROWTH -0.1551* -0.0792* -0.0654*
TASSET 0.0173 0.0096 0.0097
AGENCY -1.2763* -1.0018* -1.2898*
FOS 0.5259 0.1162 -0.2519
NDTS -3.3398 -2.0333 -0.8793
Goodness of Fit 2774.058* 2686.814* 2415.733*
<Note> * denotes a statistical significance at the 5% level in terms of the chi-square test. Each coefficient was estimated by the method of maximum likelihood (ML). Test for overall goodness of fit was performed by the likelihood ratio (LR) test and the Wald test was used for the significance of each coefficient.
Table 5. Results of binary choice models to identify financial factors between the SMEs and the LEs in the high-tech sector.
showed a negative and significant effect to determine the DV, whereas firm size and foreign ownership seem to be positively linked to the DV, respectively. Among the sample industries, IND5. IND14, INDI7, 1ND22 and IND23 revealed their pronounced effects to affect the intensity of cash holdings across the majority of the quantiles. (Unreported). Moreover, the test for equal coefficients across the quainiles were not accepted at the 5% level for the variables of FRISK, MLEVER, SIZE, TASSET and NDTS.
MLEVER, NDTS and AGENCY were overall found to be significant factors of the level of cash holdings for the SMEs, as reported in Table 3. As theorized by modern finance, the negative relationship between the market-valued debt ratio and cash holdings of the SMEs may indicate that, borrowing costs of the SMEs are higher than those of the LEs. This may, in turn, result in low level of cash holdings. The negatively significant effect of the variable of NDTS on the dependent variable may also suggest that the SMEs actively have spent cash reserves to purchase non-current assets such tangible and intangible assets during the sample period.
Moreover, Jensen [20] presented that incumbent management may incur agency cost of equity in association with free cash flow. However, the positive linkage between AGENCY and corporate cash holdings in this study provides evidence that agency cost of equity may not be a pronounced factor for the SMEs. In addtion, IND5 and IND22 that may be more associated with the capital and technology intensive business, seem to make larger investments to support growth opportunities. This phenomenon may result in keeping a lower level of cash reserves. Based on the conditional quantile regression (CQR) analyses in Table 4, the three significant industries such as IND5, IND22 and IND23 had negative relationships with the dependent variables, whereas the other two industries of IND14 and IND17 showed postive
influcence. Therefore, the former three industries, seem to continue to be actively investing their capital in the field of technology and information intensive business to support growth opportunities during the post global financial turmoil period. In the study of Kim [21], it was found that, due to more stable cash flow, firms in relatively mature industries such as the food industry, on average, maintain higher leverage ratios in comparison with those in high technology industries. In contrast, IND14 and IND17 were found to have positively significant coefficients. This may indicate that the SMEs in the industries overall reserved a higher intensity of cash holdings, considering the uncertainty of business characteristics, as described earlier.
Meanwhile, among the 9 explanatory variables, firm size (SIZE) and foreign ownership (FOS) had positively important influence to the DV in the majority of the quantiles. As firm size increases, the SMEs seem to have more financial flexibility to reserve cash holdings with less volatile cash flows. Besides, it was found that a proportion of foreign ownership becomes larger, corporate
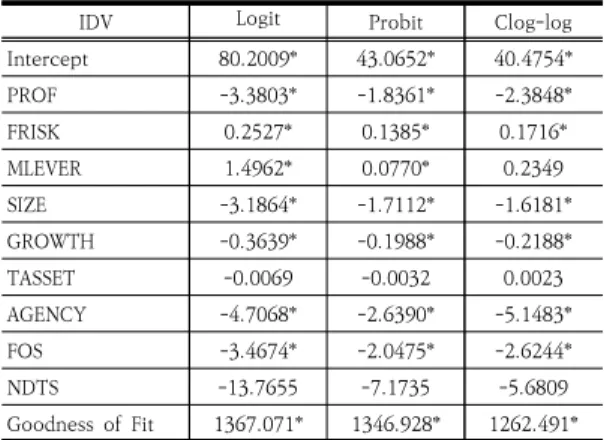
IDV Logit Probit Clog-log
Intercept 80.2009* 43.0652* 40.4754*
PROF -3.3803* -1.8361* -2.3848*
FRISK 0.2527* 0.1385* 0.1716*
MLEVER 1.4962* 0.0770* 0.2349
SIZE -3.1864* -1.7112* -1.6181*
GROWTH -0.3639* -0.1988* -0.2188*
TASSET -0.0069 -0.0032 0.0023
AGENCY -4.7068* -2.6390* -5.1483*
FOS -3.4674* -2.0475* -2.6244*
NDTS -13.7655 -7.1735 -5.6809
Goodness of Fit 1367.071* 1346.928* 1262.491*
<Note> Same denotations in <Note> in Table 5.
Table 6. Results of binary choice models to identify financial factors between the SMEs and the LEs in the low-tech sector.
IDV Random
effects model Tobit reg.
model Stepwise reg.
model
Intercept -0.0434 0.0418 0.1512*
FRISK -0.0002 -0.0002 <N.A.>
Lag_FRISK1 0.0002 0.0002 <N.A.>
Lag_FRISK2 -0.0001 -0.0001 <N.A.>
Lag_FRISK3 -0.0001 -0.0001 <N.A.>
GROWTH 0.0001 -0.0016 -0.0021*
Lag_GROWTH1 0.0002 -0.0010 <N.A.>
Lag_GROWTH2 0.0009 0.0001 <N.A.>
Table 7. Results of time lagged effects of GROWTH and FRISK on cash holdings for KOSDAQ-listed SMEs
cash holdings accordingly increase for the SMEs.
It may, to some extent, attribute to any advantages of management, in relation to the superior buisness information provided by foreign shareholders.
4.2 Results of the second hypothesis test Statistical comparisons between the SMEs and the LEs in terms of the classificationss of technical development (i.e. high-tech vs.
low-tech sector) are implemented by applying binary choice models.
Pertaining to the results of the sample firms that belong to the high-tech sector, FRISK, SIZE, GROWTH and AGENCY showed discriminating power between the two subsets of the sample observations, as reported in Table 5. Given that probability modeled is SMECODE=1 (for the subset of the SMEs), it is more likely to be included in the group of the LEs, as business risk, firm size, growth rate and agency cost increase.
In contrast, the results of the tests for the low-tech sector in Table 6, the estimated coefficients of the variables of PROF, SIZE, GROWTH, AGENCY and FOS were found to be statistically significant with a negative sign.
Given the estimated coefficients of SIZE and AGENCY with negative signs in both sectors, the findings seem to be theoretically reasonable since the separation of ownership and management tends to be severe, as firms size increases. Due to the highly dispersed ownership for the LEs in comparison with that of the SMEs, they are likely to possess large agency cost which is more determental to the wealth maximization of shraeholders. Moreover, growth potential proxied by GROWTH that is also found to be larger for KOSDAQ-listed LEs in both sectors.
The phenomenon may imply that the LEs may have advantage over the counterparts of the SMEs, in terms of searching for investment opportunities and access to the credit market for additional fund needed. However, as presented in
Table 6, the LEs in the low-tech sector may have higher profitability than the counterparts of the SMEs, which may arise from less volatile cash flow associated with a mature stage of business.
Moreover, larger proportion of foreign ownership (FOS) invested in the LEs in the low-tech sector, may, in part, be attributable to aforementioned high profitability with relatively stable cash flow.
4.3 Results of the third hypothesis test On the last hypothesis test, a trade-off relationship between the two motives on the level of cash holdings in the previous year (i.e.
Lag_DV3), was reported below for the SMEs.
Lag_GROWTH3 0.0018* 0.0013 <N.A.>
PROF -0.0401 0.0151 <N.A.>
MLEVER -0.0494* -0.1461* -0.1460*
SIZE 0.0059 0.0043 <N.A.>
TASSET -0.0001 -0.0001 <N.A.>
AGENCY -0.0249 -0.0099 <N.A.>
FOS 0.0027 0.0229 <N.A.>
NDTS -0.6815* -0.3347 -0.4938*
<Note> Same denotations in <Note> in Table 3.
As presented in Table 7, the levels of the current business risk (i.e. FRISK) and the prior years’ ones (i.e. Lag_FRISK1, Lag_FRISK2 and Lag_FRISK3) may not have any significant relationships to Lag_DV3 across all models. In contrast, current growth rate (GROWTH) seems to have a negatively significant impact to the intensity of cash holdings in the previous year (i.e. Lag_DV3). But, there was a positively significant relationship between Lag_GROWTH3 and Lag_DV3. Any time-lagged effects were not found between the dependent variable that represents the level of cash holdings of three years ago (Lag_DV3) and business risk (FRISK) across the models. In contrast, based on the result of the positively significant variable of Lag_GROWTH3 (in the random effects model) to Lag_DV3, kOSDAQ-listed SMEs may realize current growth opportunities that are financially supported by investments made in the same year.
However, it seems that the growth opportunities may dissipate in a 3-year duration (or interval), given that the negative relationship between GROWTH (in the stepwise regression model) and Lag_DV3. Moreover, the association between MLEVER and cash holdings of Lag_DV3 was found to be negatively significant across the models. The phenomenon may imply that KOSDAQ-listed SMEs are likely to rely on debt financing over equity one, when additional funds are necessary to support growth potential during the sample period. Meanwhile, significant industry effects of IND14, IND17, Ind20 and IN23 were also found on the dependent variable. The
results are consistent with the findings of the first hypothesis test.
5. Concluding Remarks
Given the ongoing and unprecedented situations of the COVID-19 pandemic, small and medium enterprises (SMEs) seem to be more vulnerable to economic and financial spillover in association with the event, than the counterparts of large enterprises (LEs). As an extension of the previous study of Kim [10], financial components inclusive of industry effects to determine corporate cash holdings are empirically tested for KOSDAQ listed SMEs in this study. As previously described, various methodologies for econometric estimation were applied to derive the results of each corresponding hypothesis. By utilizing these methodologies, the outcome obtained from the study may empirically gain weight to enhance their validity and efficiency.
First, financial determinants are tested for the SMEs, which are further analyzed by applying the conditional quantile regression (CQR) mdoel. In the second hypothesis, comparisons are made between the SMEs and the LEs to identify discriminanting factors between two different levels of technological development. Finally, time-lagged effects of firm’s growth potential and business risk on cash holdings, are also tested in the last hypothesis. This study may suffer from legitimate empirical weaknesses. These may arise from adopting different research settings in the previous literature. However, the results of the study are expected to be beneficial to both academics and practioners to identify optimal level of cash holdings for KOSDAQ-listed SMEs, which may, in turn, maximize shareholders’
wealth.
References
[1] A. Gill, C. Shah, “Determinants of Corporate Cash Holdings:Evidence from Canada,” International J. of Economics and Finance, vol.4, no.1, pp. 70-79, 2012.
DOI: https://doi.org/10.5539/ijef.v4n1p70
[2] B. Al-Najjar, “The Determinants of Corporate Cash Holdings: Evidence from Some Emerging Markets,”
International Business Review, vol.22, pp.77-88, 2013.
DOI: https://doi.org/10.1016/j.ibusrev.2012.02.004 [3] Mail Economic Daily News. Cash Holdings of Samsung
Electronics is more than KRW 100 trillion [Internet]
Feb. 17, 2019, Available From:
https://www.mk.co.kr/news/business/view/2019/02/9 6574/ (accessed Nov. 13, 2020)
[4] Y. Lian, M. Sepehri, M. Foley, “Corporate Cash Holdings and Financial Crisis: An Empirical Study of Chinese Companies,” Eurasian Business Review, vol.1, no.2, pp. 112-124, 2011.
[5] V. Subramaniam, T. Tang, H. Yue, X. Zhou, “Firm Structure and Corporate Cash Holdings,” J. of Corporate Finance, vol.17, pp. 759-773, 2011.
DOI: https://doi.org/10.1016/j.jcorpfin.2010.06.002 [6] A. Shah, “The Corporate Cash Holdings: Determinants
and Implications,” African J. of Business Management, vol.54, no.34, pp.12939-12950, 2011.
[7] S. Anjun, Q. Malik, “Determinants of Corporate Liquidity-An Analysis of Cash Holdings,” IOSR J. of Business and Management, vol.7, no.2, pp.94-100, 2013.
[8] L. Farinah, P. Prego, “Cash Holdings Determinants in the Portuguese Economy,” Financial Stability Report, pp.107-115, May 2014.
[9] D. Horioka, A. Terada-Hagiwara, “Corporate Cash Holdings in Asia,” Asian Economic Journal, vol.28, no.4, pp.323-345, 2014.
DOI: https://doi.org/10.1111/asej.12039
[10] H. Kim, “Contemporary Financial Profile and Its Implications on the Level of Corporate Cash Holdings for Korean Chaebol Firms,” J. of the Korea Academia-Industrial Cooperation Society, vol.16, no.6, pp. 3870-3881, 2015.
DOI: http://dx.doi.org/10.5762/KAIS.2015.16.6.3870 [11] C. Shi, “On the Trade-off between the Future Benefits
and Riskness of R&D: A Bondholders’ Perspective,” J.
of Accounting and Economics, vol.3, no.2 pp.227-254, 2003.
DOI: https://doi.org/10.1016/S0165-4101(03)00020-X [12] D. Czarnitzki, S, Thorwarth, “Productivity Effects of
Basic Research in Low-Tech and High-tech Industries,”
Research Policy, vol.4, no.9, pp.1555-1564, 2012.
DOI: https://doi.org/10.1016/j.respol.2012.04.009 [13] H. Kim, “Further analyses on Corporate Research &
Development Intensity for Firms on the KOSDAQ
Stock Market,” J. of International Trade & Commerce, vol.16, no.2, pp.19-39, 2020.
DOI: http://dx.doi.org/10.16980/jitc.16.2.202004.19 [14] V. Palenzuela, A. Bobillo, “Financial Structure of
Spanish Firms: Multinational vs. Domestic,”
Multinational Business Review, vol.2, no.2, pp.64-79, 1994.
[15] R. Koenker, K. Hallock, “Quantile Regression: An Introduction,” J. of Eonometric Perspectives, vol.15, pp.143-156, 2001.
[16] B. Fattouh, P. Scaramozzino, L. Harris, “Capital Structure in South Korea: A Quantile Regression Approach,” J. of Develoment Economics, vol.76, no.1, pp.231-250, 2005.
DOI:https://doi.org/10.1016/j.jdeveco.2003.12.014 [17] B. Arshanapalli, W. Nelson, “Using Quantile
Regessions to Examine the Capital Structure Decision of US firms”, International J. of Business and Finance Research, vol.8, no.5, pp.1-8. 2014.
[18] P. Allison, “Logistic Regression Using SAS: Theory and Application (2nd ed.),” SAS Institute, USA, pp.91-96, 2012.
[19] H. Kim, “Empirical Analysis on Cash Holding Motive of KOSDAQ-listed SMEs in Preparation for Economic Changes in the Post COVID-19 Era,” J. of the Korea Academia-Industrial Cooperation Society, Forthcoming, 2021.
[20] M. Jensen, “Agency Costs of Free Cash Flow, Corporate Finance, and Takeovers,” The American Economic Review, vol.76, no.2, pp.323-329, 1986.
DOI: https://dx.doi.org/10.2139/ssrn.99580
[21] H. Kim, “Inter- and Intra-leverage Analyses for Large Firms in the United States and Korea,” J. of Asia-Pacific Business, vol.10, no.1, pp.34-64, 2009.
DOI: http://dx.doi.org/10.1080/10599230802711480
Hanjoon Kim [regular member]
• Feb., 1985: Yonsei Univ., Seoul.
• Sept., 1987: The George Washington Univ., MBA, U.S.A.
• Jan., 1999: Boston University DBA (Major: Finance), U.S.A.
• Mar. 2010 ∼ Present: Hoseo Univ. Professor
<Research Interests>
Corporate Finance, M&A