INTRODUCTION
According to the Diagnostic and Statistical Manual of Men- tal Disorders, 5th edition (DSM-5), attention-deficit/hyperac- tivity disorder (ADHD) is characterized by a persistent lack of attention, hyperactivity, and impulsiveness, causing dys- function in terms of poor academic performance, interper- sonal relationships, and development [1]. In most cultures, the prevalence of ADHD is approximately 5% among children [2].
Among children diagnosed with ADHD, more than 60–85%
satisfy the diagnostic criteria of ADHD until adolescence [3,4], and approximately 40–60% of children show symptoms of ADHD even after they become adults [5,6]. However, ADHD- related functional impairment can be significantly reduced by early diagnosis and treatment [7].
ADHD is thought to be caused by defective brain function.
However, the pathophysiology of ADHD is currently unclear.
ADHD was first defined as a disease in the early 1960s, ADHD
was first defined as ‘minimal brain damage (MBD)’ [8]. MBD was based on the hypothesis that congenital problems in chil- dren’s brains would lead to symptoms of decreased attention, hyperactivity, and impulsion. Since then, the biological causes of ADHD in children have been actively investigated. The main findings suggest that psychostimulants used to treat ADHD.
Psychostimulants, such as methylphenidate and amphetamine, play a role in regulating neurochemicals, such as dopamine and norepinephrine. Researchers are also actively conducting studies to identify the aetiologic or diagnostic markers, includ- ing mutation of the dopamine transporter 1 gene (DAT1) or dopamine D4 receptor gene (DRD4) [9], and are investigat- ing decreased activities of the prefrontal cortex via functional magnetic resonance imaging (fMRI) [10]. However, there is currently no established diagnostic biomarker for ADHD. In general, ADHD is diagnosed using DSM-5, and standardized psychological tests, including self-reported scales, intelligence tests, and continuous performance tests [11]. Current methods for the diagnosis of ADHD are criticized for potential over- diagnosis. Additionally, the diagnostic accuracy of ADHD is controversial in patients with comorbidities. Consequently,
This is an Open Access article distributed under the terms of the Creative Commons Attribution Non-Commercial License (https://creativecommons.org/licenses/by-nc/4.0) which permits unrestricted non-commercial use, distribution, and reproduction in any medium, provided the original work is properly cited.
The Role of Quantitative Electroencephalogram in the Diagnosis and Subgrouping
of Attention-Deficit/Hyperactivity Disorder
Su Hyun Bong and Jun Won Kim
Department of Psychiatry, Catholic University of Daegu School of Medicine, Daegu, Korea
Attention-deficit/hyperactivity disorder (ADHD) leads to functional decline in academic performance, interpersonal relationships, and development in school-aged children. Early diagnosis and appropriate intervention can significantly reduce the functional decline caused by ADHD. Currently, there is no established biological marker for ADHD. Some studies have suggested that various indicators from the quantitative electroencephalogram (QEEG) may be useful biological markers for the diagnosis of ADHD. Until the 2010s, theta/beta ratio (TBR) was a biomarker candidate for ADHD that consistently showed high diagnostic value. However, limitations of TBR have recently been reported. Studies have demonstrated that phase-amplitude coupling, especially theta phase-gamma amplitude coupling, are related to cognitive dysfunction and may assist in the diagnosis of ADHD. As yet, the underlying mechanism is not clearly established, and the clinical efficacy of these biomarkers needs to be proven through well-controlled studies. Based on the heteroge- neous characteristics of ADHD, subgrouping through QEEG plays a key role in diagnosis and treatment planning. Sophisticated, well- designed studies and meta-analyses are necessary to confirm these findings.
Key Words: Attention-deficit/hyperactivity disorder; Electrophysiology; Child psychiatry; Theta/beta ratio;
Theta phase-gamma amplitude coupling; Subgroup.
Received: April 16, 2021 / Revision: May 3, 2021 / Accepted: May 7, 2021
Address for correspondence: Jun Won Kim, Department of Psychiatry, Catholic University of Daegu School of Medicine, 33 Duryugongwon-ro 17-gil, Nam-gu, Daegu 42472, Korea
Tel: +82-53-650-4786, Fax: +82-53-623-1694, E-mail: [email protected]
recent efforts have been made to study various imaging and neurophysiological tests that can be used to diagnose ADHD with increased accuracy.
Electroencephalogram (EEG) is a non-invasive and safe meth- od that does not expose patients to radiation. It is also relatively cheap and has a high temporal resolution. Therefore, it is used in children and adolescents for both clinical and research pur- poses. In particular, quantitative EEG (QEEG) provides quan- titative measures of brain activity through Fourier transfor- mation, unlike other clinical EEGs used for the diagnosis of epilepsy, monitoring of consciousness during anesthesia, and polysomnography. QEEG is actively utilized for the diagnosis, evaluation, and treatment of various mental disorders, such as depression [12], anxiety disorder [13], schizophrenia [14], sub- stance addiction [15], obsessive-compulsive disorder [16], and ADHD [17]. This review describes the theta/beta ratio (TBR), which is the most studied diagnostic marker of QEEG in chil- dren and adolescents with ADHD. TBR and theta phase-gam- ma amplitude coupling (TGC) are both promising biomarkers.
Furthermore, the latest knowledge on subgroup classification using QEEG in children with ADHD has also been addressed.
DIAGNOSIS
Theta/beta ratio: supporting group
Patients with ADHD tend to show hypoarousal in their brain function and prominent cortical slowing. These features are indicated by increased slow waves and decreased fast waves in the QEEG [18,19]. Lubar [20] suggested that the TBR is a di- agnostic marker that can help diagnose ADHD in children.
In QEEG, the brain waves are largely divided into four groups after Fourier transformation according to frequency: delta (1–3 Hz), theta (4–8 Hz), alpha (9–12 Hz), and beta (13–25 Hz). In turn, these are used to measure power.
TBR is the ratio of the theta wave to the beta wave. TBR has been suggested as a method for assessing brain function de- cline with increased sensitivity compared to evaluating the in- dependent increase and decrease in theta and beta waves, re- spectively. TBR has mostly been assessed in the vertex, the Cz electrode, in the resting state. In a large-scale study of 482 pa- tients, Monastra et al. [17] reported 86% sensitivity and 98%
specificity for the diagnosis of ADHD using TBR in the ver- tex. Snyder and Hall [21] conducted a meta-analysis of stud- ies on TBR and reported that TBR had a high effect size (ap- proximately 3.08 for the diagnosis of ADHD). Additionally, TBR showed 87% sensitivity and 94% specificity for the diag- nosis of ADHD in children and adolescents, suggesting that it is more useful than the self-reported scale [22]. In 2013, the Food and Drug Administration (FDA) of the U.S. authorized the Neuropsychiatric Electroencephalograph-Based ADHD
Assessment Aid (NEBA) system to assist in the diagnosis of ADHD. The NEBA system was approved for the diagnosis of ADHD in children and adolescents between the ages of 6 and 17 years. The NEBA system measures TBR. However, the FDA states that ADHD cannot be diagnosed using only the NEBA system and recommends the use of the NEBA system to assist in clinical assessment and diagnosis [23,24].
Theta/beta ratio: opposition group
Recent literature has reported negativity against the hy- poarousal theory as the cause of ADHD. Some studies have also opposed the idea of using increased TBR to assist in the diagnosis of ADHD. The group suggesting the diagnostic val- ue of TBR has argued that an increase in TBR indicates a hy- poarousal condition with reduced brain function and that psy- chostimulants, such as methylphenidate, are effective in treating ADHD, as the patients are in a hypoarousal condition. In con- trast, those opposing the diagnostic value of TBR have suggest- ed that TBR has no significant association with skin conduc- tance levels (SCLs) that reflect the arousal of the brain. They argued that a decrease in alpha power is correlated with an in- crease in SCLs [25,26]. In a study that compared SCLs in ADHD patients with hypoarousal (high TBR) and hyperarousal (high beta) groups, TBR and beta power were not associated with arousal [27]. Based on these findings, the opposing group stat- ed that TBR is associated with cognitive processing capacity rather than hypoarousal. In a follow-up study, TBR was not sig- nificantly correlated with the P300 amplitude, which is closely related to the arousal mechanism. Instead, it was correlated with P300 latency, which is closely related to cognitive process- ing capacity [28]. Moreover, many studies have shown that TBR does not show any statistical significance and has a low accuracy in distinguishing ADHD from healthy controls [29- 32]. Among these studies, the largest study compared 562 pa- tients with ADHD and 309 healthy controls. In this study, Cz TBR was not significantly different in ADHD patients versus healthy controls [32]. Based on these findings, a meta-analysis by Arns et al. [33] showed that TBR did not have high reliabil- ity regarding ADHD diagnosis, and this was caused by the in- crease in TBR in the control group due to a decreased sleep time and use of electronic devices.
Theta/beta ratio: the debate
In 2015, Snyder, the vice president of the NBA Health Com-
pany, who worked in the Research & Development Department,
published a large-scale, prospective, triple-blinded, multi-center
study, which played a crucial role in TBR being approved by
the FDA [34]. In this study, TBR was not used as a simple meth-
od to diagnose and distinguish ADHD, but as part of an in-
tegrated method that reflected the results of EEG at the dis-
cretion of the clinician. TBR was not statistically significant in the diagnosis of ADHD. However, it was highly effective (Co- hen’s d, 1.53) in identifying ‘Criterion E’, which referred to the differential diagnosis of ‘other disorders and conditions’ in the DSM-IV-TR-diagnostic criteria. TBR increased the overall ac- curacy of the diagnosis from 61% to 88%. Snyder reported that the rapid increase in the prevalence of ADHD over time was clearly correlated with a decreased effect size according to the TBR (R
2=0.89). This suggests that ADHD has been over-di- agnosed in recent years and that ADHD patients with low TBR were being misdiagnosed. Therefore, in patients with other physical or mental disorders that can be mistaken for ADHD, the NEBA system can help in the diagnosis of ADHD at the discretion of the clinician.
The above study was greatly criticized. Loo and Arns [35]
pointed out five methodological errors in this study. First, clinicians were instructed to assess ADHD patients as “AD- HD-positive” if the primary diagnosis showed clear indica- tions of ADHD. In other cases, the clinicians were instructed to assess as “ADHD-negative.” However, “ADHD negative”
included secondary and non-ADHD, which led to errors in the interpretation of the results. Second, “DSM criterion E certainty” is a concept that is not related to the presence or absence of ADHD. The NEBA system had no additional clini- cal value if not needed to diagnose and distinguish ADHD.
Third, discrepancies between the clinicians and the multi- disciplinary team were interpreted as ADHD overdiagnosis.
However, the two groups did not share the same diagnostic.
Such errors were not considered. Fourth, patients who re- sponded well to ADHD medications without side effects were considered to have ADHD. However, this is a circular ADHD argument, and logically flawed. Fifth, the findings of the 2008 study were not replicated in the 2015 study by Snyder et al.
[34]. This was explained by an increase in the prevalence of ADHD and subsequent overdiagnosis. However, the find- ings of Arns et al. [33], showing an increase in TBR in the con- trol group, were not discussed. Therefore, Loo argued that TBR should not be used to diagnose or assist in the diagno- sis of ADHD. Furthermore, Arns et al. [36] published an ar- ticle in 2016, reporting that the FDA approval of the NEBA system was inappropriate. In the article, the authors pointed out the methodological errors and also pointed out the doc- trine of the caveat emptor to support their stance that the NEBA system should not be used in clinical settings.
In response, Stein et al. [37] argued that NEBA was not ap- proved by the FDA for the diagnosis of ADHD, but rather as an integration method to assist in diagnosis. Additionally, they highlighted that children with symptoms of ADHD who have a low TBR are likely to have other conditions (head inju- ry, sensory deficit, etc.). Their answers to the errors suggest-
ed by Arns et al. [36] are as follows: First, Arns et al. argued that the results on TBR were heterogeneous and inconsistent, and that the effect size decreased. Stein et al. reported that an increase in the prevalence of ADHD led to a large number of false-positive cases. Second, with regard to Arns’ argument on the expertise of FDA reviewers, Stein et al. reported that the reviewers were psychology, psychiatry, neurology, and pediatric experts and that Class III regulatory pathways of FDA require the highest level of evidence. Lastly, to support the reliability of NEBA, the authors reported that NEBA had consistent effects based on research protocols used in 13 in- dependent institutions, even though the prevalence of ADHD varied by region.
Theta/beta ratio: tentative conclusions
Until 2010, TBR was a biomarker candidate for ADHD that consistently showed a high diagnostic value. However, in re- cent studies, limitations of TBR have been reported. This is, in part, caused by the heterogeneity in ADHD, which is a hall- mark of all mental disorders. The universal applicability of TBR is still debated. According to Snyder et al. [34], some chil- dren diagnosed with ADHD are misdiagnosed as having oth- er diseases, and that EEG can distinguish ADHD. Therefore, to overcome these limitations, future studies must assess the heterogeneity of ADHD using various biomarkers, including EEG, MRI, and genes.
Theta phase-gamma amplitude coupling
Cross-frequency coupling is an index calculated by com- bining the neural oscillations of two different frequency do- mains. This reflects the synchronization between the local and global networks of the brain [38]. In particular, the slower os- cillation EEG phase often controls the amplitude, frequency, and the faster EEG phase [39]. Phase-amplitude coupling (PAC) is considered a promising biomarker of mental disorders, and it is expected to infer dysfunction from the whole brain net- work concept instead of simple measurements of the changes in power of a specific frequency [40]. The most actively studied PAC is TGC, which is closely related to general cognitive func- tions, including working memory [41,42], language [43], and attention [44]. In particular, the increase in resting TGC in pa- tients with schizophrenia is associated with dysfunction of the default mode network [45,46] and has been actively studied.
TGC is also a promising biological marker of ADHD in chil-
dren. In a study by Kim et al. [47], children with ADHD showed
a significantly lower level of TGC compared to the control
group of healthy children, in the resting state. In this study,
TGC showed a high accuracy of 71.7% compared to that of
TBR (58.7%). In addition, children with ADHD showed a rap-
id decrease in synchronization when they performed mental
arithmetic, in contrast to children without ADHD, who showed no changes in synchronization [48]. This suggested that the normal transition process of suppressing ‘task-negative’ de- fault mode network and activating ‘task-positive’ attentional network does not occur in children with ADHD. Rather, only the ‘task-negative’ default mode network is suppressed in those children. These findings highlighted the potential of TGC as a biological marker to assess problems in attentional set shift- ing in ADHD.
PAC, including TGC, is an interesting marker for different mental disorders. However, its underlying mechanism has not been fully elucidated. Further research is required to assess the mechanism of PAC as a marker for cognitive function and mental disorders.
SUBGROUPING
Patients with ADHD have varying symptom profiles, re- sponses to medications, progress, and prognosis. Therefore, attempts have been made to subgroup ADHD according to symptoms. In the DSM-IV, subtyping was attempted accord- ing to inattention and hyperactivity-impulsivity symptoms.
However, the term “subtype” in DSM-IV was changed to “cur- rent presentation” in the DSM-5. This was to reflect the results of studies showing that clinical symptoms of ADHD change according to lifestyle and development [49,50]. In recent years, studies have actively assessed the heterogeneity of ADHD through dimensional approaches, including research domain criteria (RDoC) and hierarchical taxonomy of psychopathol- ogy (HiTOP) to overcome the limitations of the DSM diagno- sis systems based on clinical symptoms. In particular, machine learning studies have used MRI to subgroup and analyze the characteristics of ADHD [51-53] and these have made rapid progress. Similarly, QEEG has also been suggested as a prom- ising research tool for ADHD subgrouping [54].
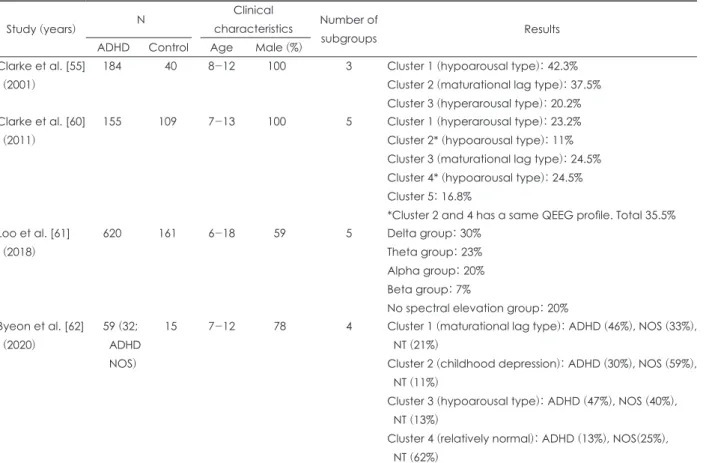
In early studies, three subgroups of ADHD were observed using QEEG [55]. The first group was a maturational lag type with increased slow waves and decreased fast waves. During the normal transition from childhood to adolescence, slow waves decreased and fast waves increased in EEG. The mat- urational lag type suggests that brain development is slower in children with ADHD than in children without ADHD. Dif- ferences have been observed in the maturational lag type when comparing children of the same age with and without ADHD, but not when compared with children of younger ages. The second group was the hypoarousal type. In this group, both the theta and beta waves were increased. This translated into an increased TBR. Previous studies that reported on ADHD with increased TBR might have been biased and included many cases of this hypoarsoual ADHD type. This subgroup is asso-
ciated with thalamo-cortical dysrhythmia and shows a sim- ilar pattern on the QEEG, which is also observed in different mental disorders [56]. In a recent study, 35% of children with ADHD showed this hypoarousal type with an increased TBR and were clearly distinguished from other subgroups [57].
The third subgroup was the hyperarousal type, observed in 20% of the children with ADHD. It is characterized by hyper- active beta waves and is more common in boys. This subgroup leads to more comorbidities and increased complaints of tem- per tantrums [58]. This subgroup also showed a poor response to medication [59]. In a recent study, Clarke et al. [60] includ- ed subjects with ADHD who had comorbid mental disorders (n=155) and observed a fourth subtype, with increased alpha waves. This group showed a significantly high response to the confused or fog’ state on the Child Behavior Checklist and demonstrated increased ritualistic behaviors and hyperactivity.
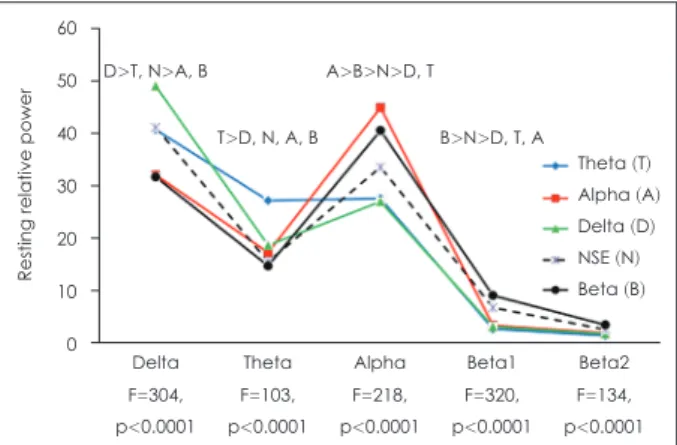
Loo et al. [61] analyzed the QEEG of 781 participants (620 ADHD and 161 control) and classified them into five classes.
The five classes were named based on the frequency of the most dominant EEG: delta (30%), theta (23%), alpha (20%), beta (7%), and no spectral elevation (NSE; 20%). The authors observed that the subgroup with prominent delta and theta waves was associated with disruptive behavior and cognitive dysfunction, while those with prominent alpha and beta waves were associated with emotional dysregulation and internaliz- ing behavior. Additionally, the authors stated that in previous studies, comorbid mood disorders were excluded, which led to subgroups with prominent delta and theta waves and sub- sequently high TBR. The NSE subgroup, which showed no in- crease in the power spectrum at any frequency band, showed
Fig. 1. Spectral Power Profiles for EEG-based subgroups. Relative power in the parietal region (P3, Pz, and P4) across the frequen- cy bands for each of the five empirically defined subgroups.
Each group is named for the frequency band where the power is significantly elevated above the other clusters. Degrees of freedom for EEG analyses F[4775]. Post hoc results (p<0.05) for each frequency band were located above the spectral eleva- tion for each frequency band. EEG: electroencephalogram.
Adapted from Loo et al. J Child Psychol Psychiatr 2018;59:223- 231, with permission of John Wiley and Sons [61].
60 50 40 30 20 10 0
Resting relative power
Delta D>T, N>A, B
F=304, p<0.0001
Theta T>D, N, A, B
F=103, p<0.0001
Alpha A>B>N>D, T
F=218, p<0.0001
Beta1 B>N>D, T, A
F=320, p<0.0001
Beta2 Theta (T) Alpha (A) Delta (D) NSE (N) Beta (B)
F=134, p<0.0001
relatively fewer behavioral and cognitive function problems.
This subgroup was observed in all ADHD and typically devel- oping control groups. This suggests that the clinical diagnosis of ADHD may show no specific abnormalities on EEG.
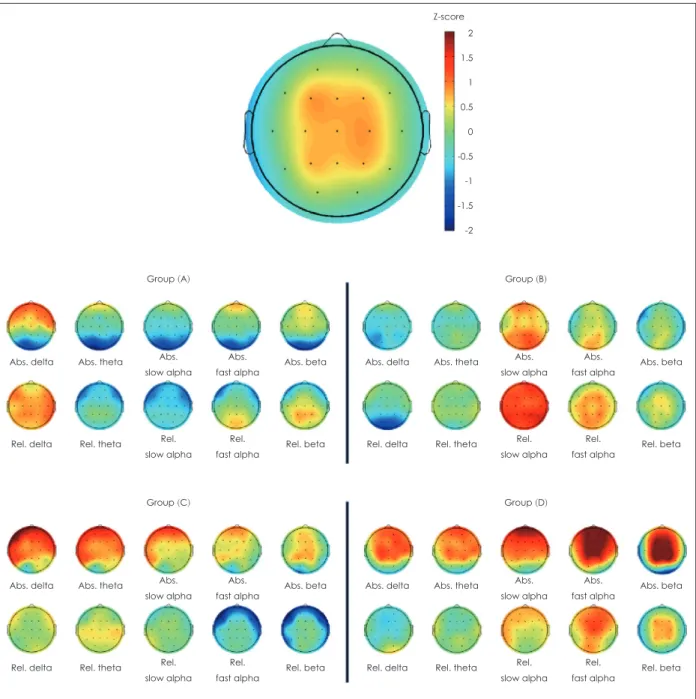
Byeon et al. [62] also confirmed the heterogeneity of ADHD by subgrouping using QEEG. In this study, 74 children were divided into three groups: ADHD, not other specified (NOS), and neurotypical (NT), and cluster analysis further divided the participants into four subgroups. In addition to the matu- rational lag and hypoarousal types, a new type with increased alpha waves was observed. This subgroup contained the high-
est proportion of NOS (ADHD 30%, NOS 59%, NT 11%), sug- gesting that childhood depression showed similar symptoms to ADHD and was misdiagnosed.
Based on the findings of studies that subgrouped ADHD using QEEG, ADHD is heterogeneous, and several subtypes can be identified. In particular, the subtype with increased alpha waves. Alpha is presumed to be associated with mood (depression and emotional dysregulation). This is also consis- tent with the statement of Snyder et al. [34] that low TBR is not pure ADHD, but a condition or comorbidity that has symp- toms similar to ADHD. Further research is required regarding
Z-score
Abs. delta
Abs. delta
Abs. delta
Abs. delta Abs. theta
Abs. theta
Abs. theta
Abs. theta Group (A)
Group (C)
Group (B)
Group (D) Abs. beta
Abs. beta
Abs. beta
Abs. beta Abs.
slow alpha
Abs.
slow alpha
Abs.
slow alpha
Abs.
slow alpha Abs.
fast alpha
Abs.
fast alpha
Abs.
fast alpha
Abs.
fast alpha Rel. delta
Rel. delta
Rel. delta
Rel. delta Rel. theta
Rel. theta
Rel. theta
Rel. theta Rel. beta
Rel. beta
Rel. beta
Rel. beta Rel.
slow alpha
Rel.
slow alpha
Rel.
slow alpha
Rel.
slow alpha Rel.
fast alpha
Rel.
fast alpha
Rel.
fast alpha
Rel.
fast alpha 2
1.5 1 0.5 0 -0.5 -1 -1.5 -2