RESEARCH ARTICLE
Received: August 17, 2017, Revised: September 4, 2017, Accepted: September 8, 2017 ISSN 1598-4478 (Print) / ISSN 2233-7679 (Online)
†
Correspondence to: In-Ja Kim
Department of Preventive and Public Health Dentistry, Wonkwang University College of Dentistry, 460 Iksan-daero, Iksan 54538, Korea Tel: +82-63-850-6854, Fax: +82-63-857-4837, E-mail: [email protected]
Copyright © 2017 by Journal of Dental Hygiene Science
Relevance of Dental Health Capacity and Pulmonary Function Status in Adults
Kwui-Sook Song, Da-Young Ryu 1 , and In-Ja Kim †
Department of Preventive and Public Health Dentistry, Wonkwang University College of Dentistry, Iksan 54538,
1
Department of Dental Hygiene, Hyejeon College, Hongseong 32244, Korea
The purpose of this study was to confirm the relevance of dental health capacity and pulmonary function status. The subjects of this study were adults aged 40 years and older, who participated in pulmonary function and oral examinations. The data used for this study were raw data from the sixth Korea National Health and Nutrition Examination Survey (2013∼2015). Statistical analysis was performed by analysis of complex sample survey data. The results were as follows: First, restrictive and obstructive patterns were more prevalent among males than females. They were even worse in older subjects. Approximately 67% of smokers had obstructive pattern. Second, there was a relevance between dental health capacity and pulmonary function status. The functioning teeth index, number of present teeth, and number of sound teeth (ST), which are indicators of dental health, declined with decreased pulmonary function. The number of missing teeth (MT) increased as the pulmonary function deteriorated (p<0.05).
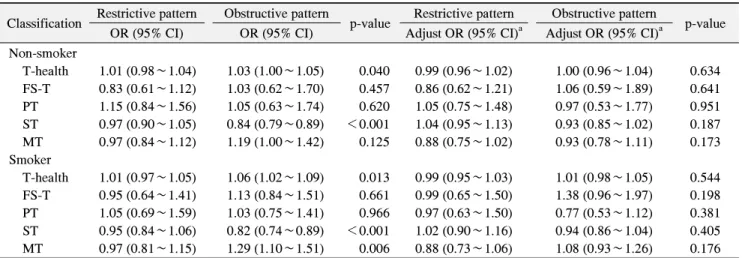
Third, the relevance between dental health capacity and pulmonary function status after stratifying the life-long smoking experience was statistically significant in the tissue health (T-health) index and ST among non-smokers. The relevance between dental health capacity and pulmonary function status after stratifying the life-long smoking experience was statistically significant (p<0.05) for the T-health index, ST, and MT among smokers.
However, there was no relevance between dental health capacity and pulmonary function status after stratifying the life-long smoking experience and adjusting confounding variables. In conclusion, there was a relevance between dental health capacity and pulmonary function status after confounding variables were adjusted. However, there was no relevance between dental health capacity and pulmonary function status after stratifying the life-long smoking experience and adjusting confounding variables.
Key Words: Lung, Oral health, Respiratory function tests, Tooth
Introduction
Respiratory diseases are reported worldwide. Generally, asthma occurs more commonly during childhood, chronic obstructive pulmonary diseases (COPDs) such as emphysema and chronic bronchitis are prevalent in late adulthood, and infectious diseases such as tuberculosis may occur in all age groups 1) . According to the 2015 causes of death statistics, respiratory disease such as pneumonia is included in the top 10 major causes of death, steadily climbing the list from the 10th place in 2004 to fourth place in 2015 following cancer, heart disease, and cardiovascular disease 2) .
Pulmonary function test (PFT) is one of the basic tests
for the respiratory system, which accurately reflects the pathophysiology of respiratory diseases. It is useful for diagnosing respiratory diseases through quantitative and qualitative assessment of pulmonary function and can be also used for treatment and progress monitoring of respiratory diseases. PFT measures forced vital capacity (FVC) and forced expiratory volume in 1 second (FEV 1 ) to calculate forced expiratory ratio (FEV 1 /FVC), and the calculated value is compared with the normal value to diagnose restrictive and obstructive ventilatory impai- rments based on the extent of difference in values.
Restrictive ventilatory impairment refers to decreased
FVC, where a reduction in lung volume occurs due to
damage to the lung itself or thoracic anomalies, and
typical diseases that can cause manifestation of restrictive ventilatory impairment include pleural disease, interstitial lung disease, and pulmonary fibrosis. Obstructive venti- latory impairment refers to airflow limitation caused by obstruction of the airway, and typical diseases that can cause manifestation of obstructive ventilatory impairment include COPD, emphysema, and asthma 3-5) .
Meanwhile, oral health is closely associated with systemic diseases and can have an impact on respiratory diseases as well. A review of foreign precedent studies on oral health and respiratory diseases shows that dental plaque in the oral cavity of chronic lung disease patients acts as a repository for bacteria that can cause pneumonia 6) , while periodontal disease-related bacteria present in saliva can attach to airway mucosa and destroy the protective membrane on the lung surface and compromise pulmonary defense mechanisms, causing respiratory diseases 7) . Moreover, it has also been reported that dental plaque that causes oral diseases contains about 100 million bacteria per 1 mm 2 of area and continuously supplies potential pathogens to the mouth and airways, which may enter the lungs through saliva and the upper respiratory tract 8) . There are also claims that COPD can be prevented by improving periodontal status and oral hygiene 9) . In Korea, a study analyzed data from the fourth Korea National Health and Nutrition Examination Survey (KNHANES) and reported that there was no association between periodontal disease and COPD 10) , while another analyzed data from the 2012 KNHANES to investigate the association between the number of natural teeth and COPD and found that having fewer natural teeth was associated with higher probability of COPD, but such association appeared only in males 11) . Another study investigated the association between the number of existing natural teeth and COPD using 2009 KNHANES data and found that having fewer numbers of existing natural teeth increased the risk of COPD 12) .
Thus far, studies in Korea and abroad examined the associations of lung disease with oral hygiene, number of natural teeth, and periodontal disease, but unfortunately, most of them have focused only on periodontal health and COPD. In light of this, the present study aimed to investigate the association between dental health and
pulmonary function status using dental health indicators (tissue health [T-health] index, functioning teeth [FS-T]
index, number of sound teeth [ST], number of present teeth [PT], and number of missing teeth [MT]) that can objectively identify oral health status.
Materials and Methods
1. Subjects
The present study used raw data from the sixth KNHANES (2013∼2015) and secondary analysis after obtaining Institutional Review Board approval/exemption from Wonkwang University (IRB no. WKIRB-201707- SB-042). The present study included 6,170 subjects, aged 40 years or older, who had participated in the health questionnaire survey, oral examination, and PFT.
2. Methods
In the present study, demographic factors, pulmonary function status, and dental health were used as the variables. Demographic factors included gender, age, income level, education level, lifetime drinking experi- ence, lifetime smoking experience, and obesity status.
Income level was divided into income quartiles: “upper,”
“upper-middle,” “lower-middle,” and “lower.” Education level was divided into “primary school or below,” “middle school,” “high school,” and “college or above.” Lifetime drinking experience was divided into “no experience of drinking” and “yes,” while lifetime smoking experience was also divided into “no experience of smoking” and
“yes.” Meanwhile, obesity was divided into “under- weight,” “normal,” and “obese.”
Pulmonary function status was based on PFT results and divided into “normal pulmonary function,” “restrictive ventilatory impairment,” and “obstructive ventilatory impairment.” “Normal pulmonary function” was defined as FEV 1 /FVC ≥0.7 and FVC ≥0.8, “restrictive venti- latory impairment” was defined as normal FEV 1 /FVC and FVC <0.8, and “obstructive ventilatory impairment” was defined as FEV 1 /FVC <0.7 3,12) .
Dental health-related variables were derived from 28
permanent teeth, excluding the third molars. Dental
health-related indicators included T-health index, FS-T
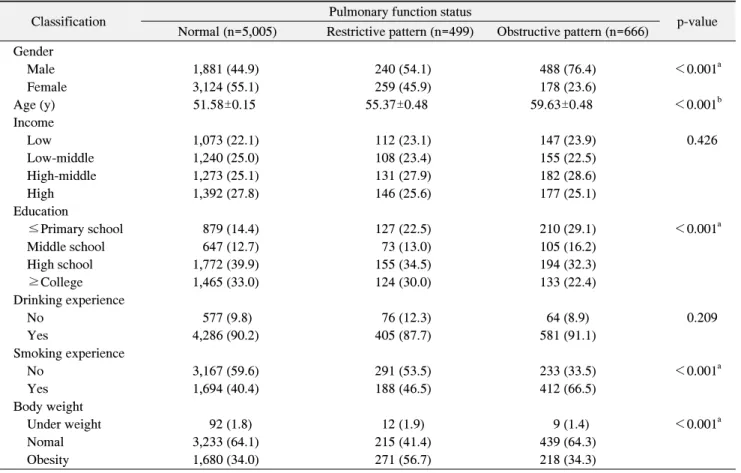
Table 1. Pulmonary Function Status according to Demographic Distribution
Classification Pulmonary function status
p-value Normal (n=5,005) Restrictive pattern (n=499) Obstructive pattern (n=666)
Gender
Male 1,881 (44.9) 240 (54.1) 488 (76.4) <0.001
aFemale 3,124 (55.1) 259 (45.9) 178 (23.6)
Age (y) 51.58±0.15 55.37±0.48 59.63±0.48 <0.001
bIncome
Low 1,073 (22.1) 112 (23.1) 147 (23.9) 0.426
Low-middle 1,240 (25.0) 108 (23.4) 155 (22.5)
High-middle 1,273 (25.1) 131 (27.9) 182 (28.6)
High 1,392 (27.8) 146 (25.6) 177 (25.1)
Education
≤Primary school 879 (14.4) 127 (22.5) 210 (29.1) <0.001
aMiddle school 647 (12.7) 73 (13.0) 105 (16.2)
High school 1,772 (39.9) 155 (34.5) 194 (32.3)
≥College 1,465 (33.0) 124 (30.0) 133 (22.4)
Drinking experience
No 577 (9.8) 76 (12.3) 64 (8.9) 0.209
Yes 4,286 (90.2) 405 (87.7) 581 (91.1)
Smoking experience
No 3,167 (59.6) 291 (53.5) 233 (33.5) <0.001
aYes 1,694 (40.4) 188 (46.5) 412 (66.5)
Body weight
Under weight 92 (1.8) 12 (1.9) 9 (1.4) <0.001
aNomal 3,233 (64.1) 215 (41.4) 439 (64.3)
Obesity 1,680 (34.0) 271 (56.7) 218 (34.3)
Values are presented as n (%) or mean±standard error.
a
p<0.05, p-value obtained from complex sample chi-square test.
bp<0.05, p-value obtained from complex sample general linear model.
index, PT, ST, and MT. In the T-health index, 4 points were given for ST, 2 points for filled teeth, 1 point for teeth with caries, and 0 point for MT. The total score ranged between 0 and 112 points with different weighted values applied according to the condition of the tooth.
FS-T index represented the sum value of sound and filled teeth scores added, and the total score ranged between 0 and 28 points, under the concept that sound and filled teeth have the same function 13) .
3. Analytic methods
The present study used raw data from the sixth KNHANES (2013∼2015), and complex sample analysis was performed to ensure that the analysis results were highly representative. Before performing complex sample analysis, kstrata, primary sampling unit, and weight values for healthy questionnaire and examination were applied to
generate a plan file. For investigation of pulmonary
function status based on demographic characteristics,
complex sample cross-analysis and complex sample
general linear model analysis were performed; however,
for investigation of dental health based on pulmonary
function status, complex sample general linear model
analysis was performed. For an in-depth investigation of
the association between pulmonary function status and
dental health, complex sample multiple logistic regression
analysis was performed, and smoking experience, a major
risk factor for pulmonary function impairment, was
stratified for analysis of the association between pul-
monary function status and dental health. IBM SPSS
Statistics ver. 23.0 (IBM Co., Armonk, NY, USA) was
used for statistical analysis, and type I error level (α) for
determining statistical significance was set to 0.05.
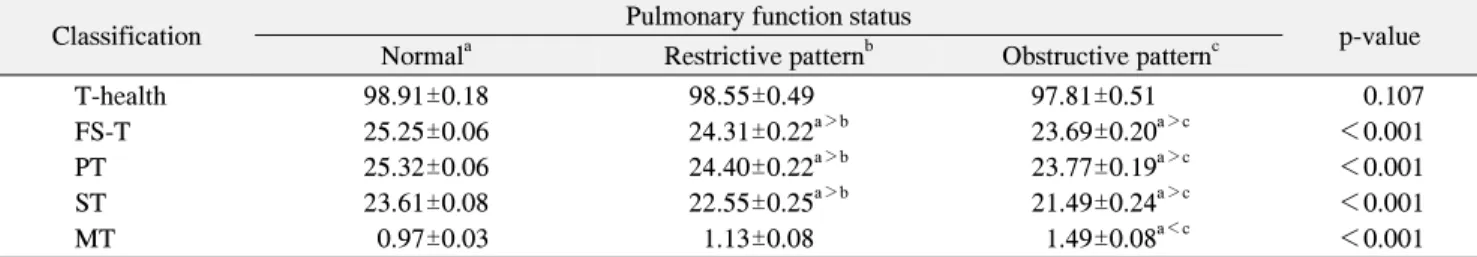
Table 2. Pulmonary Function Status according to Dental Health Capacity
Classification Pulmonary function status
p-value Normal
aRestrictive pattern
bObstructive pattern
cT-health 98.91±0.18 98.55±0.49 97.81±0.51 0.107
FS-T 25.25±0.06 24.31±0.22
a>b23.69±0.20
a>c<0.001
PT 25.32±0.06 24.40±0.22
a>b23.77±0.19
a>c<0.001
ST 23.61±0.08 22.55±0.25
a>b21.49±0.24
a>c<0.001
MT 0.97±0.03 1.13±0.08 1.49±0.08
a<c<0.001
Values are presented as mean±standard error.
T-health: tissue health, FS-T: functioning teeth, PT: present teeth, ST: sound teeth, MT: missing teeth.
p<0.05, p-value obtained from complex sample general linear model.
Results
1. Pulmonary function status based on demographic characteristics
Pulmonary function status based on demographic characteristics is shown in Table 1. Among the demographic characteristics, statistically significant diffe- rences in pulmonary function status were based on gender, age, education level, lifetime smoking experience, and obesity (p<0.05). For pulmonary function status based on gender, there were more females (55.1%) than males (44.9%) in the normal pulmonary function group, approximately 1.2 times more males (54.1%) than females (45.9%) in the restrictive ventilatory impairment group, and approximately three times more males (76.4%) than females (23.6%) in the obstructive ventilatory impairment group. For pulmonary function status based on age, the obstructive ventilatory impairment group had the highest average age (59.63 years), while the normal pulmonary function group had the lowest average age (51.58 years).
With respect to pulmonary function status based on education level, high school was most common for all three groups: normal pulmonary function (39.9%), rest- rictive ventilatory impairment (34.5%), and obstructive ventilatory impairment (32.3%). There were more people with no lifetime smoking experience in the normal pulmonary function and restrictive ventilatory impairment groups (59.6% and 53.5%, respectively), while there were more people with smoking experience in the obstructive ventilatory impairment group (66.5%). There were more people with normal weight in the normal pulmonary function and obstructive ventilatory impairment groups
(64.1% and 64.3%, respectively), while there were more obese people in the restrictive ventilatory impairment group (56.7%).
2. Dental health based on pulmonary function status With respect to dental health based on pulmonary function status, significant differences were found in all categories, except T-health index (p<0.05). FS-T index showed the highest number of teeth with 25.25 in the normal pulmonary function group, followed by 24.31 in the restrictive ventilatory impairment group and 23.69 in the obstructive ventilatory impairment group, indicating that poorer pulmonary function status was associated with lower FS-T index. PT and ST were also the highest in the normal pulmonary function group (25.32 and 23.61, respectively) and the lowest in the obstructive ventilatory impairment group (23.77 and 21.49, respectively). MT in the normal pulmonary function, restrictive ventilatory impairment, and obstructive ventilatory impairment groups was 0.97, 1.13, and 1.49, respectively, indicating that poorer pulmonary function status was associated with higher MT (Table 2).
3. Association between dental health and pulmonary function status
Table 3 shows the results from multiple logistic
regression analysis on the association between dental
health and pulmonary function status and on relevant
factors. After adjusting for gender, age, income level,
education level, lifetime drinking experience, lifetime
smoking experience, and obesity, the results showed
statistically significant differences in ST and MT (p
Table 3. Relationship between Dental Health Capacity and Pulmonary Function Status Classification Restrictive pattern Obstructive pattern
p-value Restrictive pattern Obstructive pattern
p-value OR (95% CI) OR (95% CI) Adjust OR (95% CI)
aAdjust OR (95% CI)
aT-health 1.01 (0.99∼1.03) 1.07 (1.04∼1.10) <0.001 1.00 (0.97∼1.02) 1.03 (1.00∼1.06) 0.119 FS-T 0.88 (0.69∼1.13) 0.98 (0.78∼1.23) 0.621 0.92 (0.71∼1.20) 1.29 (0.95∼1.75) 0.193 PT 1.10 (0.86∼1.42) 1.19 (0.93∼1.53) 0.320 1.03 (0.79∼1.35) 0.87 (0.63∼1.20) 0.646 ST 0.96 (0.90∼1.02) 0.80 (0.75∼0.86) <0.001 0.93 (0.92∼1.05) 0.85 (0.79∼0.90) <0.001 MT 0.98 (0.88∼1.10) 1.32 (1.17∼1.49) <0.001 0.91 (0.81∼1.03) 1.12 (0.99∼1.26) 0.048 OR: odds ratio, 95% CI: 95% confidence interval, T-health: tissue health, FS-T: functioning teeth, PT: present teeth, ST: sound teeth, MT: missing teeth.
p<0.05, p-value obtained from complex sample multinomial logistic regression.
a
Gender, age, income, education, drinking experience, smoking experience, body weight.
Table 4. Pulmonary Function Status in Relation to Dental Health Capacity and Stratification of Smoking Experience Classification Restrictive pattern Obstructive pattern
p-value Restrictive pattern Obstructive pattern
p-value OR (95% CI) OR (95% CI) Adjust OR (95% CI)
aAdjust OR (95% CI)
aNon-smoker
T-health 1.01 (0.98∼1.04) 1.03 (1.00∼1.05) 0.040 0.99 (0.96∼1.02) 1.00 (0.96∼1.04) 0.634 FS-T 0.83 (0.61∼1.12) 1.03 (0.62∼1.70) 0.457 0.86 (0.62∼1.21) 1.06 (0.59∼1.89) 0.641 PT 1.15 (0.84∼1.56) 1.05 (0.63∼1.74) 0.620 1.05 (0.75∼1.48) 0.97 (0.53∼1.77) 0.951 ST 0.97 (0.90∼1.05) 0.84 (0.79∼0.89) <0.001 1.04 (0.95∼1.13) 0.93 (0.85∼1.02) 0.187 MT 0.97 (0.84∼1.12) 1.19 (1.00∼1.42) 0.125 0.88 (0.75∼1.02) 0.93 (0.78∼1.11) 0.173 Smoker
T-health 1.01 (0.97∼1.05) 1.06 (1.02∼1.09) 0.013 0.99 (0.95∼1.03) 1.01 (0.98∼1.05) 0.544 FS-T 0.95 (0.64∼1.41) 1.13 (0.84∼1.51) 0.661 0.99 (0.65∼1.50) 1.38 (0.96∼1.97) 0.198 PT 1.05 (0.69∼1.59) 1.03 (0.75∼1.41) 0.966 0.97 (0.63∼1.50) 0.77 (0.53∼1.12) 0.381 ST 0.95 (0.84∼1.06) 0.82 (0.74∼0.89) <0.001 1.02 (0.90∼1.16) 0.94 (0.86∼1.04) 0.405 MT 0.97 (0.81∼1.15) 1.29 (1.10∼1.51) 0.006 0.88 (0.73∼1.06) 1.08 (0.93∼1.26) 0.176 OR: odds ratio, 95% CI: 95% confidence interval, T-health: tissue health, FS-T: functioning teeth, PT: present teeth, ST: sound teeth, MT: missing teeth.
p<0.05, p-value obtained from complex sample multinomial logistic regression.
a