D I A B E T E S & M E T A B O L I S M J O U R N A L
This is an Open Access article distributed under the terms of the Creative Commons Attribution Non-Commercial License (https://creativecommons.org/licenses/by-nc/4.0/) which permits unrestricted non-commercial use, distribution, and reproduction in any medium, provided the original work is properly cited.
Copyright © 2020 Korean Diabetes Association https://e-dmj.org
Corrigendum
Corrigenda: Table Correction
Associations among Obesity Degree, Glycemic Status, and Risk of Heart Failure in 9,720,220 Korean Adults
Eun Jung Rhee
1, Hyemi Kwon
1, Se Eun Park
1, Kyung Do Han
2, Yong Gyu Park
2, Yang Hyun Kim
3, Won Young Lee
11 Division of Endocrinology and Metabolism, Department of Internal Medicine, Kangbuk Samsung Hospital, Sungkyunkwan University School of Medicine, Seoul,
2Department of Biostatistics, Biomedicine & Health Sciences, College of Medicine, The Catholic University, Seoul,
3Department of Family Medicine, Korea University Anam Hospital, Korea University College of Medicine, Seoul, Korea
Diabetes Metab J 2020;44:592-601. https://doi.org/10.4093/dmj.2019.0104
In this Article, Model 3 in Table 2 is unnecessarily added. It was deleted from the corrected Table as follows.
This Table has been corrected in the online versions.
We apologize for any inconvenience that this may have caused.
https://doi.org/10.4093/dmj.2020.0245 pISSN 2233-6079 · eISSN 2233-6087 Diabetes Metab J 2020;44:783
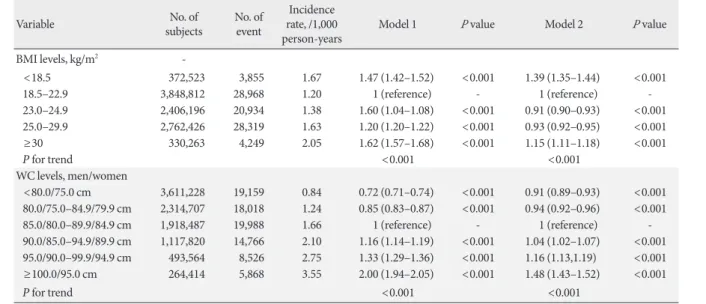
Table 2. Risk for heart failure according to obesity degree
Variable No. of
subjects No. of event
Incidence rate, /1,000
person-years Model 1 P value Model 2 P value
BMI levels, kg/m2 -
<18.5 372,523 3,855 1.67 1.47 (1.42–1.52) <0.001 1.39 (1.35–1.44) <0.001
18.5–22.9 3,848,812 28,968 1.20 1 (reference) - 1 (reference) -
23.0–24.9 2,406,196 20,934 1.38 1.60 (1.04–1.08) <0.001 0.91 (0.90–0.93) <0.001
25.0–29.9 2,762,426 28,319 1.63 1.20 (1.20–1.22) <0.001 0.93 (0.92–0.95) <0.001
≥30 330,263 4,249 2.05 1.62 (1.57–1.68) <0.001 1.15 (1.11–1.18) <0.001
P for trend <0.001 <0.001
WC levels, men/women
<80.0/75.0 cm 3,611,228 19,159 0.84 0.72 (0.71–0.74) <0.001 0.91 (0.89–0.93) <0.001 80.0/75.0–84.9/79.9 cm 2,314,707 18,018 1.24 0.85 (0.83–0.87) <0.001 0.94 (0.92–0.96) <0.001
85.0/80.0–89.9/84.9 cm 1,918,487 19,988 1.66 1 (reference) - 1 (reference) -
90.0/85.0–94.9/89.9 cm 1,117,820 14,766 2.10 1.16 (1.14–1.19) <0.001 1.04 (1.02–1.07) <0.001 95.0/90.0–99.9/94.9 cm 493,564 8,526 2.75 1.33 (1.29–1.36) <0.001 1.16 (1.13,1.19) <0.001
≥100.0/95.0 cm 264,414 5,868 3.55 2.00 (1.94–2.05) <0.001 1.48 (1.43–1.52) <0.001
P for trend <0.001 <0.001
Values are presented as hazard ratio (95% confidence interval). Model 1 adjusted for age and sex; Model 2 adjusted for age, sex, smoking, alcohol drinking, regular exercise, low income, hypertension, dyslipidemia, and chronic kidney disease.
BMI, body mass index; WC, waist circumference.