Vol. 24, No. 2 73~84 (2018)
https://doi.org/10.20909/kopast.2018.24.2.73
A Study on the Operation Method of Packaging System to Enhance Logistics Efficiency
Sung-Tae Jung*
Caroline University, 3660 Wilshire Blvd Suite 320, Los Angeles, CA 90010, USA
Abstract This study sought efficiency of collaboration between manufacturers and distributors by finding a way to improve logistics efficiency in order to save distribution cost and standardize packaging together with profit generation by way of simple-display packaging in discount stores. For the study purpose, the impact of products with RRP (Retail Ready Packaging) by each discount store on the collaboration achievement such as loading efficiency was observed.
From this observation, an alternative packaging system that can improve logistics efficiency between manufacturers and distributors was sought and the role of distributors in distribution standardization was explored. The purpose of this study also includes suggesting some implications on future basic direction of environment-friendly management. If this study would induce distributors to have more interest in distribution standardization and if logistics efficiency would be enhanced by the operation of packaging system considered of compatibility with pallets, this study would have academic significance and create practical values.
Keywords RRP (Retail Ready Packaging), Packaging system, Logistics efficiency
Introduction
Pain1) defined packaging as “the art, science, and technology of the goods prepared for transport or sales” and the Institute of Packaging (IOP) as the technique and process associated with the preparation for transporting, storing, and delivering goods or products to customers. Moreover, Gray2) defined pac- kaging as “a close combination of product policy and sales policy, which is an element of the merchandising policy that is fundamentally related to a consumer’s choice” and “a part of the marketing, just like advertising”. Packaging has been rec- ognized as having a great impact on the logistics system and activities such as distribution, storage, and handling through the supply chain3-5). However, many package-dependent costs within the logistics system have been overlooked. As a result of calculation of the standard of RRP’s out box by A Manufac- turer in Study on the Effects of Implementation of RRP on Load Efficiency through Manufacturers’ Packaging System, it was shown that the average palette load efficiency ratio was 77.1%6). Jung and Kim3) compared and analyzed the pack- aging systems of general products and RRP products, and con-
firmed that their packaging systems are different, and noted that it was the results of the current RRR system considering only the efficiency of the stores of logistics companies. There- fore, packaging can affect the effectiveness of the supply chain because it influences the relationship among the supply chain, the major consumers of the packaging, and the end users.
Although recent studies mainly evaluated the functionalities of the simple display in running a store8,9), the literature review revealed that there have not been enough studies evaluating the packaging evaluation methodology from the viewpoint of logistics10-13). Therefore, it seems that methods and tools to evaluate the concept of packaging such as packaging system are required for both industry and academia. Discount Store in South Korea mainly seek new packaging concepts in order to increase the efficiency of store management from the aspect of merchandising such as retail ready package (RRP), case size reduction (CSR), and unification etc.14) Among them, RRP is a packaging type that enhances the efficiency of the product transport and product display. It is a customer-oriented pack- aging type and helps customers browse products easily. ECR UK (2005) classifies packaging area into 3 sections. The first is UP (Unready Packaging) and the second RRP (Retail Ready Packaging). The third is classified as DP (Display Ready Pack- aging), a single unit packaging such as MU (Merchandising Unit), Dolly, etc. Accordingly, RRP is also an intermediate form of UP and DRP15). On the other hand, the importance of the efficiency of logistics is increasing for manufacturers. It is
*Corresponding Author : Sung-Tae Jung
Caroline University, 3660 Wilshire Blvd Suite 320, Los Angeles, CA 90010, USA
Tel : +82-10-6616-8955, Fax : +82-2-528-2680 E-mail : [email protected]
because the efficiency of logistics systems still has many obsta- cles to overcome even in advanced countries, although the productivity of the company has already been advanced considerably owing to the advancement of mechanization and automation16-20). These findings implied that manufacturers prioritize the safety and efficiency for the transportation of goods in regard to the form of product packaging while super- markets place the most importance on the easiness and effi- ciency of sales promotion for increasing self-sales. Therefore, it is urgent to establish an alternative packaging system to pre- vent the degradation of the efficiency of logistics due to prob- lems in the distribution process of RRP products.
Study Procedure and Methods
This study conducted a face-to-face interview before con- ducting the first survey in order to reflect the professional opi- nions of the practitioners. The items of the questionnaire were confirmed based on the results of the face-to-face interview.
The first survey was conducted after creating a questionnaire composed of 16 items for a factor analysis. The second survey was prepared with items containing the same meaning and contents of the first survey in order to clarify the verification based on the results of the factor analysis on the questionnaire of the first survey. Moreover, a reliability analysis based on the results of the first analysis was conducted for the second survey. It was confirmed that it was possible to combine the results using the factors derived from the factor analysis of the first survey. This study was conducted using the results. It conducted frequency analysis, cross-analysis, and descriptive statistics for calculating the basic statistics of the collected responses for the second survey. Based on the results of the factor analysis conducted for the first survey, the reliability analysis was confirmed to secure the reliability of each sub- factor. Furthermore, one-way ANOVA and t-test were carried out for each sub-factor and individual items to compare the mean of the characteristics of the respondents. Chi-square test was performed to test each item. Scheffe's test was used as a post-hoc analysis for the one-way ANOVA. Pearson correla- tion analysis was performed to evaluate the correlation of the sub-factors at an alpha level of 0.05. The study used both the online survey and face-to-face interview methods. The collec- ted questionnaires were coded after checking errors and omis- sions in the records. SPSS 19.0 was used for conducting the factor analysis of the first survey and analyzing the second verification after refining the data.
Establishment of Study Model
1. Discussion on the SCM Efficiency of a Packag- ing System
(Study Model 1) The overall efficiency of the supply net-
work will be improved if the design factor of packaging is an operation considering SCM aspect instead of prioritizing the efficiency of the store operation.
(Study Model 2) The efficiency of packaging containers and eliminating the differences in the perceptions related to a design factor between a manufacturer and a distributor will improve the overall efficiency of the supply network.
(Study Model 3) The RRP production facility in the man- ufacturer and the establishment of a process automation sys- tem will affect the improvement of the efficiency of logistics.
(Study Model 4) The packaging system and distribution process between a manufacturer and a distributor will affect logistics cost, environment, quality and safety.
(Study Model 5) The promotion of RRP through manu- facturer's packaging system will improve the efficiency of logistics.
2. Discussion on the Partnership of a Packaging System
(Study Model 6) An objective checklist related to the oper- ation of the packaging system will show a complementary function.
(Study Model 7) The establishment and operation of a con- sultative body related to the operation of a packaging system will have a positive impact on the improvement of the effi- ciency of logistics.
(Study Model 8) The establishment of a profit sharing and profit distribution system related to the packaging system operation will have a positive impact on the rational operation.
(Study Model 9) In the discount warehouse store, the pallet display pattern preferred by customers will affect the effi- ciency of logistics.
(Study Model 10) From the early stage of a new product preparation, the participation and feedback of the persons in charge of manufacturer’s packaging will improve the effi- ciency of logistics.
3. Discussion on the Institutional Aspect of a Pack- aging System
(Study Model 11) The mediator role of government and social organization regarding issues associated with the pack- aging system management will have a positive impact on rational operation.
(Study Model 12) The guideline that is prepared by collect- ing various opinions on the operation of a packaging system will positively affect the rational operation of the system.
(Study Model 13) The reasonable packaging system pro- cedure to improve the efficiency of logistics and the willing- ness to comply with the system of logistics company’s rel- evant personnel related to the packaging design will positively affect the improvement in the efficiency of logistics.
4. Discussion on the Standardization of a Packag- ing System
(Study Model 14) The delivery system of the discount ware- house store considering the compatibility and consistency of ULS will improve the efficiency of logistics.
(Study Model 15) The recognition and utilization of KS T 1002 will improve the efficiency of loading.
(Study Model 16) The standardization of RRP display shel- ves will improve the efficiency of loading.
Analysis and Verification of Study Models
1. Results of Survey Analysis 1) Population and Survey Contents
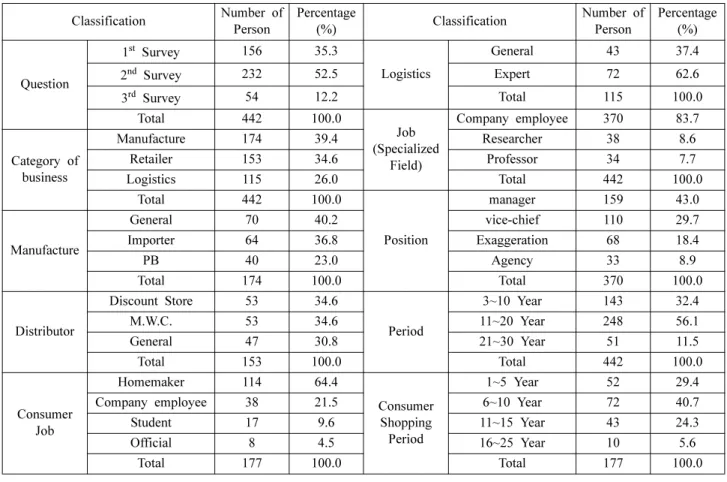
The 156 copies of the first questionnaire were collected and the 232 copies of the second questionnaire were collected. The samples of the second survey were composed as shown in (Table 1) so the range of the population could be maintained
as consistent with the population range of the first survey.
2) Factor Analysis
The KMO value for the factor analysis of this study was 0.880 (Table 2). Therefore, it was confirmed that the measure- ment variables were appropriate for the factor analysis. More- over, Bartlett’s test of sphericity was conducted in order to find out whether the variables used in the factor analysis was statistically correlated or not. It was found that the p-value was 0.000 so it was proven that the factors were significantly cor- related.
As shown from the total variance explained by a factor analysis (Table 3), the cumulative percentage derived by the factors was 84.966%. Therefore, it was determined that the derived factors sufficiently explained the results of this study.
A factor analysis was conducted on the coded questionnaire results by using VARIMAX rotation method, which is one of principle component analysis (PCA) methods and assumes Table 1. Composition of general samples
Classification Number of Person
Percentage
(%) Classification Number of
Person
Percentage (%)
Question
1st Survey 156 35.3
Logistics
General 43 37.4
2nd Survey 232 52.5 Expert 72 62.6
3rd Survey 54 12.2 Total 115 100.0
Total 442 100.0
Job (Specialized
Field)
Company employee 370 83.7
Category of business
Manufacture 174 39.4 Researcher 38 8.6
Retailer 153 34.6 Professor 34 7.7
Logistics 115 26.0 Total 442 100.0
Total 442 100.0
Position
manager 159 43.0
Manufacture
General 70 40.2 vice-chief 110 29.7
Importer 64 36.8 Exaggeration 68 18.4
PB 40 23.0 Agency 33 8.9
Total 174 100.0 Total 370 100.0
Distributor
Discount Store 53 34.6
Period
3~10 Year 143 32.4
M.W.C. 53 34.6 11~20 Year 248 56.1
General 47 30.8 21~30 Year 51 11.5
Total 153 100.0 Total 442 100.0
Consumer Job
Homemaker 114 64.4
Consumer Shopping Period
1~5 Year 52 29.4
Company employee 38 21.5 6~10 Year 72 40.7
Student 17 9.6 11~15 Year 43 24.3
Official 8 4.5 16~25 Year 10 5.6
Total 177 100.0 Total 177 100.0
Table 2. Results of variables’ fitness and significant tests
Kaiser-Meyer-Olkin Test for Sampling Adequacy 0.880
Bartlett’s Test of Sphericity
Approximation 2803.197
Degree of Freedom 120
p-value 0.000
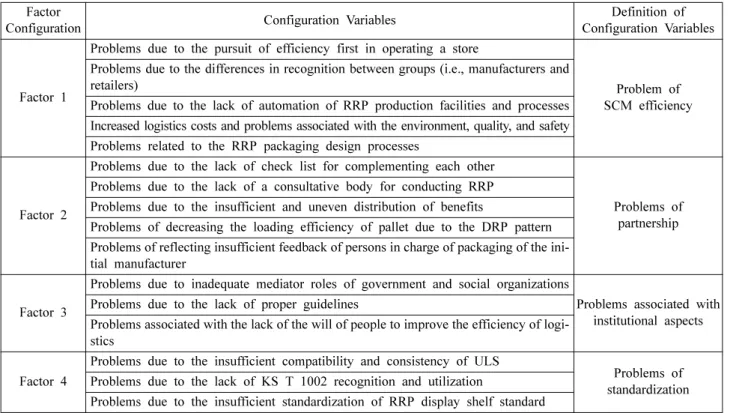
independence between factors. It was confirmed that factors were grouped into four principle components (Table 4).
First, factor 1 is the problem of SCM efficiency, factor 2 was the problems of partnership, factor 3 was the problems asso- ciated with institutional aspects, and factor 4 was the problems
of standardization (Table 5).
The results of the reliability test showed that Cronbach’s α coefficient was 0.951, indicating very high reliability. There- fore, it was concluded that the results of the survey reflected the contents of the survey adequately (Table 6).
Table 3. Explained total variance
Component Initial Eigenvalue Summed Load of Extract Squared Sum of Rotation Squared Total % Variance % Load Total % Variance % Load Total % Variance % Load
1 9.350 58.437 58.437 9.350 58.437 58.437 3.992 24.950 24.950
2 1.960 12.252 70.689 1.960 12.252 70.689 3.943 24.645 49.595
3 1.263 7.896 78.585 1.263 7.896 78.585 2.878 17.986 67.581
4 1.026 6.410 84.996 1.026 6.410 84.996 2.786 17.415 84.996
5 0.504 3.148 88.144
6 0.410 2.560 90.703
7 0.299 1.866 92.569
8 0.226 1.413 93.983
9 0.200 1.250 95.233
10 0.180 1.122 96.355
11 0.146 0.914 97.269
12 0.120 0.749 98.018
13 0.112 0.697 98.715
14 0.090 0.565 99.280
15 0.071 0.441 99.721
16 0.045 0.279 100.000
Table 4. Results of factor analysis Classification Component
Variable Contents
1 2 3 4
VAR00003 .846 .231 .198 .138 Problems associated with pursuing the efficiency in operating a store
VAR00002 .837 .269 .057 .192 Problems caused by the difference in recognition between groups (i.e., manufacturers and distributors)
VAR00004 .821 .224 .004 .101 Problems due to the lack of automation of RRP production facilities and processes VAR00001 .812 .219 .222 .276 Increased logistics costs and problems associated with the environment, quality, and
safety
VAR00011 .742 .329 .212 .226 Problems related to the RRP packaging design processes
VAR00007 .288 .835 .252 .222 Problems due to the lack of Check List for complementing each other VAR00006 .359 .821 .280 .141 Problems due to the lack of a consultative body for conducting RRP VAR00008 .246 .802 .314 .220 Problems due to the insufficient and uneven distribution of benefits
VAR00005 .302 .749 .188 .289 Problems of decreasing the loading efficiency of pallet due to the DRP pattern VAR00009 .297 .743 .251 .260 Problems of reflecting insufficient feedback of persons in charge of packaging of the
initial manufacturer
VAR00016 .188 .249 .877 .213 Problems due to inadequate mediator roles of government and social organizations VAR00015 .135 .298 .875 .183 Problems due to the lack of proper guidelines
VAR00014 .125 .327 .830 .310 Problems associated with the lack of the will of people to improve the efficiency of logistics
VAR00013 .286 .229 .202 .864 Problems due to the insufficient compatibility and consistency of ULS VAR00010 .217 .214 .234 .858 Problems due to the lack of KS T 1002 recognition and utilization
VAR00012 .211 .359 .289 .816 Problems due to the insufficient standardization of RRP display shelf standard
Table 5. Definition of variables according to common factors Factor
Configuration Configuration Variables Definition of
Configuration Variables
Factor 1
Problems due to the pursuit of efficiency first in operating a store
Problem of SCM efficiency Problems due to the differences in recognition between groups (i.e., manufacturers and
retailers)
Problems due to the lack of automation of RRP production facilities and processes Increased logistics costs and problems associated with the environment, quality, and safety Problems related to the RRP packaging design processes
Factor 2
Problems due to the lack of check list for complementing each other
Problems of partnership Problems due to the lack of a consultative body for conducting RRP
Problems due to the insufficient and uneven distribution of benefits
Problems of decreasing the loading efficiency of pallet due to the DRP pattern Problems of reflecting insufficient feedback of persons in charge of packaging of the ini- tial manufacturer
Factor 3
Problems due to inadequate mediator roles of government and social organizations
Problems associated with institutional aspects Problems due to the lack of proper guidelines
Problems associated with the lack of the will of people to improve the efficiency of logi- stics
Factor 4
Problems due to the insufficient compatibility and consistency of ULS
Problems of standardization Problems due to the lack of KS T 1002 recognition and utilization
Problems due to the insufficient standardization of RRP display shelf standard
Table 7. Item statistics
Classification Mean Standard
Deviation N Variable Contents
VAR00001 4.9679 1.22036 156 Increased logistics costs and problems associated with the environment, quality, and safety
VAR00002 5.3654 1.20261 156 Problems due to the differences in recognition between groups (i.e., manufacturers and retailers)
VAR00003 5.1859 1.30411 156 Problems due to the pursuit of efficiency first in operating a store
VAR00004 4.9936 1.28262 156 Problems due to the lack of automation of RRP production facilities and processes VAR00005 4.7372 1.39636 156 Problems of decreasing the loading efficiency of pallet due to the DRP pattern VAR00006 4.5256 1.51742 156 Problems due to the lack of a consultative body for conducting RRP
VAR00007 4.4808 1.46120 156 Problems due to the lack of check list for complementing each other VAR00008 4.6218 1.58356 156 Problems due to the insufficient and uneven distribution of benefits
VAR00009 4.8333 1.33360 156 Problems of reflecting insufficient feedback of persons in charge of packaging of the ini- tial manufacturer
VAR00010 4.2308 1.42261 156 Problems due to the lack of KS T 1002 recognition and utilization VAR00011 5.0256 1.36287 156 Problems related to the RRP packaging design processes
VAR00012 4.3013 1.56337 156 Problems due to the insufficient standardization of RRP display shelf standard VAR00013 4.3397 1.52610 156 Problems due to the insufficient compatibility and consistency of ULS
VAR00014 4.4231 1.65408 156 Problems associated with the lack of the will of people to improve the efficiency of logistics
VAR00015 4.1923 1.55383 156 Problems due to the lack of proper guidelines
VAR00016 4.4423 1.74593 156 Problems due to inadequate mediator roles of government and social organizations Table 6. Reliability statistics
Cronbach’s α Item Number
0.951 16
Table 8. Total item statistics
Classification Mean scale when an item is deleted
Variance of scale when an item is deleted
Adjusted Items – Total Correlation
Cronbach’s α when an item is deleted
VAR00001 69.6987 280.483 0.737 0.948
VAR00002 69.3013 283.876 0.660 0.949
VAR00003 69.4808 280.638 0.681 0.949
VAR00004 69.6731 286.312 0.556 0.951
VAR00005 69.9295 274.634 0.767 0.947
VAR00006 70.1410 269.077 0.818 0.946
VAR00007 70.1859 270.978 0.810 0.946
VAR00008 70.0449 268.327 0.795 0.946
VAR00009 69.8333 275.985 0.775 0.947
VAR00010 70.4359 277.847 0.679 0.949
VAR00011 69.6410 276.928 0.734 0.948
VAR00012 70.3654 269.911 0.773 0.947
VAR00013 70.3269 273.744 0.713 0.948
VAR00014 70.2436 269.811 0.728 0.948
VAR00015 70.4744 274.857 0.676 0.949
VAR00016 70.2244 269.543 0.689 0.949
Table 9. Measurements of RRP’s recognition according to the respondent’s characteristics (Manufacturer: a, Distributor: b, and Logis- tics: c)
Classification N Mean Standard Deviation F (p-value) Scheffe
Manufacture 101 4.41 0.494
5.191**
(0.006) c<b=a
Distributor 71 4.35 0.481
Logistics 60 4.17 0.376
*p<0.05, **p<0.01, ***p<0.001.
Table 10. Results of a reliability analysis on the second survey
Classification Cronbach’s α Item Number
SCM efficiency 0.632 5
Partnership 0.884 5
Institutional Aspect 0.797 3
Standardization 0.865 3
Table 11. Results of comparing means of business standards for sub-factors (Manufacturer: a, Distributor: b, and Logistics: c)
Factor Classification N Mean Standard Deviation F (p-value) Scheffe
SCM efficiency
Manufacture 101 3.90 0.33
53.900***
(0.000) b<c<a
Distributor 71 3.33 0.39
Logistics 60 3.74 0.35
Partnership
Manufacture 101 3.96 0.35
96.973***
(0.000) b<a=c
Distributor 71 3.21 0.48
Logistics 60 4.03 0.32
Institutional Aspect
Manufacture 101 4.12 0.33
104.298***
(0.000) b<a=c
Distributor 71 3.35 0.38
Logistics 60 4.06 0.40
Standardization
Manufacture 101 4.05 0.33
137.170***
(0.000) b<a=c
Distributor 71 3.14 0.49
Logistics 60 3.98 0.28
*p<0.05, **p<0.01, ***p<0.001.
The descriptive statistical analysis can predict the items with great impact and those with relatively low impact among the 16 items (Table 7).
Even Cronbach’s α value after deleting items showed that α values of all 16 items were higher than 0.9 (Table 8), and that reliability verification values were high without items to delete.
3) Reliability Analysis
The results is shown in (Table 9), (Table 10), and (Table 11).
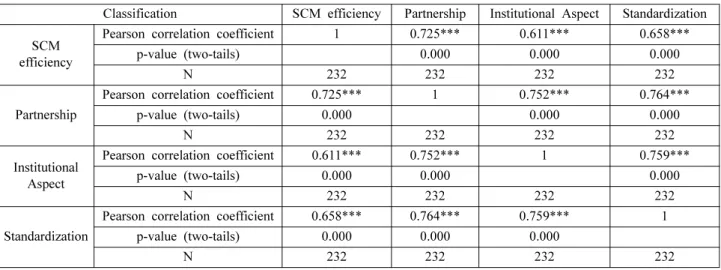
4) Correlation Analysis
Pearson’s correlation analysis was conducted to identify the
relationships among sub-factors. It was found that all variables were significantly (p<0.001) correlated (Table 12).
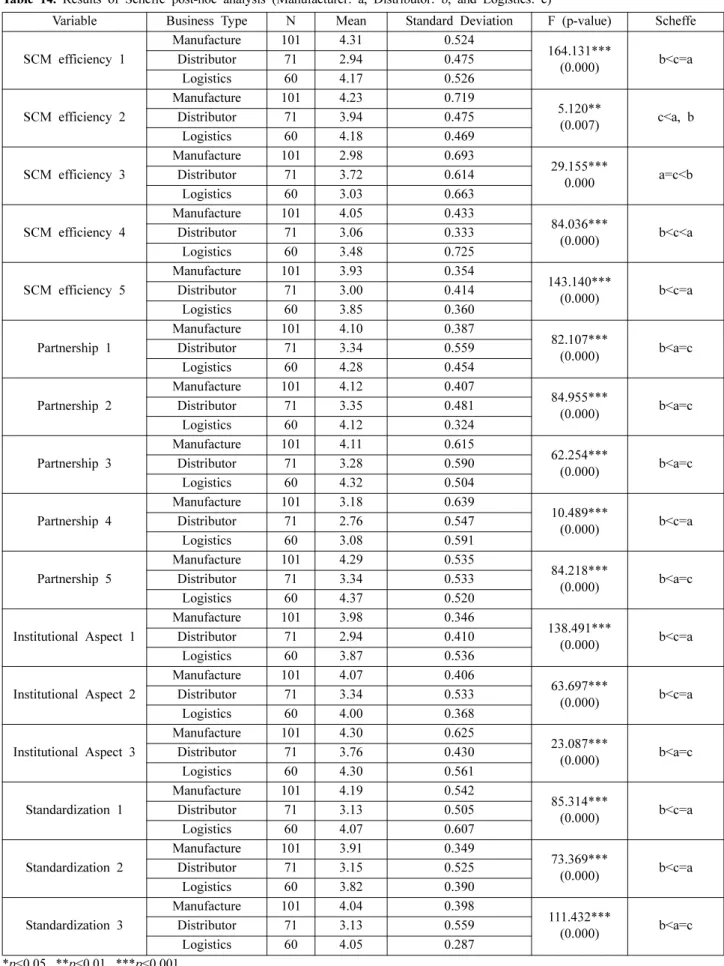
5) One-Way ANOVA and Scheffe post-hoc analysis The results of Scheffe post-hoc analysis showed that the means of all items were statistically significantly different from each other.
2. Verification of Study Models
Chi-square test was carried out for each measurement vari- able to verify the 16 study models set for this study. The res- ults of verification are as follows.
Table 12. Results of Pearson’s correlation analysis for sub-factors
Classification SCM efficiency Partnership Institutional Aspect Standardization SCM
efficiency
Pearson correlation coefficient 1 0.725*** 0.611*** 0.658***
p-value (two-tails) 0.000 0.000 0.000
N 232 232 232 232
Partnership
Pearson correlation coefficient 0.725*** 1 0.752*** 0.764***
p-value (two-tails) 0.000 0.000 0.000
N 232 232 232 232
Institutional Aspect
Pearson correlation coefficient 0.611*** 0.752*** 1 0.759***
p-value (two-tails) 0.000 0.000 0.000
N 232 232 232 232
Standardization
Pearson correlation coefficient 0.658*** 0.764*** 0.759*** 1
p-value (two-tails) 0.000 0.000 0.000
N 232 232 232 232
*p<0.05, **p<0.01, ***p<0.001.
Table 13. Results of one-way ANOVA Variable Business
Type N Mean Standard
Deviation
Standard Error
95% Confidence Interval
Minimum Maximum Minimum Maximum
SCM efficiency 1
Manufacture 101 4.31 0.524 0.052 4.20 4.41 3 5
Distributor 71 2.94 0.475 0.056 2.83 3.06 2 4
Logistics 60 4.17 0.526 0.068 4.03 4.30 3 5
Total 232 3.85 0.792 0.052 3.75 3.96 2 5
SCM efficiency 2
Manufacture 101 4.23 0.719 0.072 4.09 4.37 2 5
Distributor 71 3.94 0.475 0.056 3.83 4.06 3 5
Logistics 60 4.18 0.469 0.061 4.06 4.30 3 5
Total 232 4.13 0.603 0.040 4.05 4.21 2 5
SCM efficiency 3
Manufacture 101 2.98 0.693 0.069 2.84 3.12 2 5
Distributor 71 3.72 0.614 0.073 3.57 3.86 3 5
Logistics 60 3.03 0.663 0.086 2.86 3.20 2 4
Total 232 3.22 0.738 0.048 3.12 3.32 2 5
SCM efficiency 4
Manufacture 101 4.05 0.433 0.043 3.96 4.13 3 5
Distributor 71 3.06 0.333 0.040 2.98 3.14 2 4
Logistics 60 3.48 0.725 0.094 3.30 3.67 2 4
Total 232 3.60 0.657 0.043 3.51 3.68 2 5
Table 13. Results of one-way ANOVA (Continued) Variable Business
Type N Mean Standard
Deviation
Standard Error
95% Confidence Interval
Minimum Maximum Minimum Maximum
SSCM efficiency 5
Manufacture 101 3.93 0.354 0.035 3.86 4.00 3 5
Distributor 71 3.00 0.414 0.049 2.90 3.10 2 4
Logistics 60 3.85 0.360 0.046 3.76 3.94 3 4
Total 232 3.63 0.560 0.037 3.55 3.70 2 5
Partnership 1
Manufacture 101 4.10 0.387 0.039 4.02 4.18 3 5
Distributor 71 3.34 0.559 0.066 3.21 3.47 2 4
Logistics 60 4.28 0.454 0.059 4.17 4.40 4 5
Total 232 3.91 0.604 0.040 3.84 3.99 2 5
Partnership 2
Manufacture 101 4.12 0.407 0.041 4.04 4.20 3 5
Distributor 71 3.35 0.481 0.057 3.24 3.47 3 4
Logistics 60 4.12 0.324 0.042 4.03 4.20 4 5
Total 232 3.88 0.542 0.036 3.81 3.95 3 5
Partnership 3
Manufacture 101 4.11 0.615 0.061 3.99 4.23 2 5
Distributor 71 3.28 0.590 0.070 3.14 3.42 2 4
Logistics 60 4.32 0.504 0.065 4.19 4.45 3 5
Total 232 3.91 0.718 0.047 3.82 4.00 2 5
Partnership 4
Manufacture 101 3.18 0.639 0.064 3.05 3.30 2 5
Distributor 71 2.76 0.547 0.065 2.63 2.89 2 4
Logistics 60 3.08 0.591 0.076 2.93 3.24 2 4
Total 3.03 0.624 0.041 2.95 3.11 2 5
Partnership 5
Manufacture 101 4.29 0.535 0.053 4.18 4.39 3 5
Distributor 71 3.34 0.533 0.063 3.21 3.46 2 4
Logistics 60 4.37 0.520 0.067 4.23 4.50 3 5
Total 232 4.02 0.696 0.046 3.93 4.11 2 5
Institutional Aspect 1
Manufacture 101 3.98 0.346 0.034 3.91 4.05 3 5
Distributor 71 2.94 0.410 0.049 2.85 3.04 2 4
Logistics 60 3.87 0.536 0.069 3.73 4.01 3 5
Total 232 3.63 0.624 0.041 3.55 3.71 2 5
Institutional Aspect 2
Manufacture 101 4.07 0.406 0.040 3.99 4.15 3 5
Distributor 71 3.34 0.533 0.063 3.21 3.46 2 4
Logistics 60 4.00 0.368 0.048 3.90 4.10 3 5
Total 232 3.83 0.547 0.036 3.76 3.90 2 5
Institutional Aspect 3
Manufacture 101 4.30 0.625 0.062 4.17 4.42 3 5
Distributor 71 3.76 0.430 0.051 3.66 3.86 3 4
Logistics 60 4.30 0.561 0.072 4.15 4.45 3 5
Total 232 4.13 0.606 0.040 4.06 4.21 3 5
Standardization 1
Manufacture 101 4.19 0.542 0.054 4.08 4.30 3 5
Distributor 71 3.13 0.505 0.060 3.01 3.25 2 4
Logistics 60 4.07 0.607 0.078 3.91 4.22 3 5
Total 232 3.83 0.722 0.047 3.74 3.93 2 5
Standardization 2
Manufacture 101 3.91 0.349 0.035 3.84 3.98 3 5
Distributor 71 3.15 0.525 0.062 3.03 3.28 2 4
Logistics 60 3.82 0.390 0.050 3.72 3.92 3 4
Total 232 3.66 0.536 0.035 3.59 3.72 2 5
Standardization 3
Manufacture 101 4.04 0.398 0.040 3.96 4.12 3 5
Distributor 71 3.13 0.559 0.066 2.99 3.26 2 4
Logistics 60 4.05 0.287 0.037 3.98 4.12 3 5
Total 232 3.76 0.603 0.040 3.68 3.84 2 5
Table 14. Results of Scheffe post-hoc analysis (Manufacturer: a, Distributor: b, and Logistics: c)
Variable Business Type N Mean Standard Deviation F (p-value) Scheffe
SCM efficiency 1
Manufacture 101 4.31 0.524
164.131***
(0.000) b<c=a
Distributor 71 2.94 0.475
Logistics 60 4.17 0.526
SCM efficiency 2
Manufacture 101 4.23 0.719
5.120**
(0.007) c<a, b
Distributor 71 3.94 0.475
Logistics 60 4.18 0.469
SCM efficiency 3
Manufacture 101 2.98 0.693
29.155***
0.000 a=c<b
Distributor 71 3.72 0.614
Logistics 60 3.03 0.663
SCM efficiency 4
Manufacture 101 4.05 0.433
84.036***
(0.000) b<c<a
Distributor 71 3.06 0.333
Logistics 60 3.48 0.725
SCM efficiency 5
Manufacture 101 3.93 0.354
143.140***
(0.000) b<c=a
Distributor 71 3.00 0.414
Logistics 60 3.85 0.360
Partnership 1
Manufacture 101 4.10 0.387
82.107***
(0.000) b<a=c
Distributor 71 3.34 0.559
Logistics 60 4.28 0.454
Partnership 2
Manufacture 101 4.12 0.407
84.955***
(0.000) b<a=c
Distributor 71 3.35 0.481
Logistics 60 4.12 0.324
Partnership 3
Manufacture 101 4.11 0.615
62.254***
(0.000) b<a=c
Distributor 71 3.28 0.590
Logistics 60 4.32 0.504
Partnership 4
Manufacture 101 3.18 0.639
10.489***
(0.000) b<c=a
Distributor 71 2.76 0.547
Logistics 60 3.08 0.591
Partnership 5
Manufacture 101 4.29 0.535
84.218***
(0.000) b<a=c
Distributor 71 3.34 0.533
Logistics 60 4.37 0.520
Institutional Aspect 1
Manufacture 101 3.98 0.346
138.491***
(0.000) b<c=a
Distributor 71 2.94 0.410
Logistics 60 3.87 0.536
Institutional Aspect 2
Manufacture 101 4.07 0.406
63.697***
(0.000) b<c=a
Distributor 71 3.34 0.533
Logistics 60 4.00 0.368
Institutional Aspect 3
Manufacture 101 4.30 0.625
23.087***
(0.000) b<a=c
Distributor 71 3.76 0.430
Logistics 60 4.30 0.561
Standardization 1
Manufacture 101 4.19 0.542
85.314***
(0.000) b<c=a
Distributor 71 3.13 0.505
Logistics 60 4.07 0.607
Standardization 2
Manufacture 101 3.91 0.349
73.369***
(0.000) b<c=a
Distributor 71 3.15 0.525
Logistics 60 3.82 0.390
Standardization 3
Manufacture 101 4.04 0.398
111.432***
(0.000) b<a=c
Distributor 71 3.13 0.559
Logistics 60 4.05 0.287
*p<0.05, **p<0.01, ***p<0.001.
3. Implication Based on the Results of Study Model Verification
Study Model 1 showed that the efficiency of logistics could be reduced when the packaging is composed by prioritizing the efficiency of shop operation. It was indicated that the effi- ciency of logistics would be improved when a packaging sys- tem is operated by considering the overall efficiency of the supply network. It can be said that it is necessary to establish an organic cooperation system between the parties and to complement the institutional aspect to support mutually ben- eficial management in order to manage a packaging system rationally based on the results of (Study Model 2). Study Mo- del 3 confirmed that the efforts to reduce SKU could facilitate the introduction of automation to manufacturing facilities and
processes in the future. Study Model 4 implied that the diverse entities constituting the supply network should make various efforts to reduce social costs and complement institutions in diverse aspects. The results of Study Model 5 explained that the establishment of a packaging process would have a pos- itive impact on the efficiency of SCM regardless of the pro- cess of any industry. Furthermore, the results implied that col- laboration would be needed in terms of the partnership. Study Model 6 suggested that it should be required to prepare a checklist which reflects broad opinions of government, social organizations, distributors, manufacturers and logistics com- panies to improve the efficiency of logistics. Research Model 6 suggests that a checklist should be prepared that collects broad opinions from government and social organizations, dis- Table 15. Results of the overall Chi-square test
Study Model Verification χ2 (p-value)
Study Model 1
The overall efficiency of the supply network will be improved if the design factor of packaging is an operation considering SCM aspect instead of prioritizing the efficiency of the store operation.
178.500***
(0.000) Study
Model 2
The efficiency of packaging containers and eliminating the differences in the perceptions related to a design factor between a manufacturer and a distributor will improve the overall efficiency of the supply network.
32.675***
(0.000) Study
Model 3
The RRP production facility in the manufacturer and the establishment of a process automation sys- tem will affect the improvement of the efficiency of logistics.
49.107***
(0.000) Study
Model 4
The packaging system and distribution process between a manufacturer and a distributor will affect logistics cost, environment and quality and safety.
152.606***
(0.000) Study
Model 5
The promotion of RRP through manufacturer's packaging system will improve the efficiency of logistics.
140.133***
(0.000) Study
Model 6
An objective checklist related to the operation of the packaging system will show a complementary function.
121.864***
(0.000) Study
Model 7
The establishment and operation of a consultative body related to the operation of a packaging sys- tem will have a positive impact on the improvement of the efficiency of logistics.
120.068***
(0.000) Study
Model 8
The establishment of a profit sharing and profit distribution system related to the packaging system operation will have a positive impact on the rational operation.
106.730***
(0.000) Study
Model 9
The establishment of a profit sharing and profit distribution system related to the packaging system operation will have a positive impact on the rational operation.
23.258***
(0.001) Study
Model 10
From the early stage of a new product preparation, the participation and feedback of the persons in charge of manufacturer’s packaging will improve the efficiency of logistics.
114.422***
(0.000) Study
Model 11
The mediator role of government and social organization regarding issues associated with the pack- aging system management will have a positive impact on rational operation.
148.916***
(0.000) Study
Model 12
The guideline that is prepared by collecting various opinions on the operation of a packaging system will positively affect the rational operation of the system.
95.781***
(0.000) Study
Model 13
The reasonable packaging system procedure to improve the efficiency of logistics and the will- ingness to comply with the system of logistics company’s relevant personnel related to the pack- aging design will positively affect the improvement in the efficiency of logistics.
41.625***
(0.000) Study
Model 14
The delivery system of the discount warehouse store considering the compatibility and consistency of ULS will improve the efficiency of logistics.
117.483***
(0.000) Study
Model 15 The recognition and utilization of KS T 1002 will improve the efficiency of loading. 95.158***
(0.000) Study
Model 16 The standardization of RRP display shelves will improve the efficiency of loading. 136.882***
(0.000)
*p<0.05, **p<0.01, ***p<0.001.
tributors, manufacturers, and logistics companies to improve logistics efficiency. Study Model 7 implied that manufacturers, distributors, and consumers could share profits only when these entities composed a consultative body and applied a new pac- kage design concept adequately that could create a win-win situation through collaboration. Study Model 8 suggested that it should be possible to practice a win-win management bet- ween distributors and manufacturers by establishing a system that shares and distributes profits owing to RRP. The results of Study Model 9 implied that the pallet display pattern preferred by customers and the efficiency of logistics should be con- sidered at the same time. Study Model 10 confirmed that the efficiency of logistics would be improved if the opinions of people in charge of manufacturers’ packaging could be reflec- ted from the early stage. The results of Study Model 11 sug- gested that government and social organizations should need to identify issues related to packaging systems between the manufacturers and distributors and show the willingness to mediate these issues. The results of Study Model 12 showed that the guideline for the rational operation of a packaging sys- tem could contribute to resolving differences in recognition between distributors and manufacturers. Study Model 13 con- firmed that it would be necessary to review policy support and tax relief such as rewards and certificate systems for dis- tributors and stakeholders contributing to improving the effi- ciency of logistics. The results of Study Model 14 indicated that, in the case of RRP, the compatibility of ULS and the will- ingness to comply with consistency were very important issues. The results of Study Model 15 implied that the adap- tation and usage of KS T 1002 could improve the efficiency of loading in many workplaces. However, the results of the one-way ANOVA test showed that it’ rate was 3.66%, which was lower than the overall mean. It can be interpreted as the presence of limitations in the utilization of standards because people felt there were too many complex standards. The results of Study Model 16 confirmed that the compatibility of pallet could be secured by standardizing the RRP display shelves of supermarkets.
Conclusion
The present paper conducted research on an operation me- thod for a packaging system for improving the efficiency of logistics between manufacturers and distributors, whose rel- evant studies have been limited. This study aimed to present an operation method of a packaging system for improving the efficiency of logistics between manufacturers and distributors in the future by identifying the problems and improvements associated with the packaging system between manufacturers and distributors through RRP and deriving solutions and ac- tion plans. The study conducted a chi-square analysis for 16 validation items, which were set to meet the study objectives.
The results showed that all validation items were statistically significant (p<0.001). The results obtained from the verificat- ion of each item can be summarized as follows.
The test results on the efficiency aspect of SCM revealed that the packaging system or a delivery system that prioritiz- ing the efficiency of a store operation would decrease the effi- ciency of logistics (χ2=178.500, p<0.001). The analysis results showed that the efficiency of logistics would be improved by having manufacturers participate in the process and consid- ering the overall efficiency of the supply network so that prod- ucts are configurable by an established process such as a load- ing efficiency simulation with maintaining the compatibility between the out-box specifications of the product and the pal- let while a distributor plans a new product (χ2=140.133, p<
0.001). It was also confirmed that it would be required to red- uce SKU by considering the specifications of display shelves and pallets in the many products and a small quantity of RRP pattern so it would be easy to establish the RRP production facilities in the facilities of manufacturers and the automation of processes (χ2=49.107, p<0.001). Additionally, the efficiency of SCM should be improved and, at the same time, the part- nership should be enhanced to reduce the disparity in view- points between manufacturers and distributors.
When the partnership aspect was examined, the presence of a mutual checklist could complement the functions of both parties objectively and rationally (χ2=121.864, p<0.001). More- over, the establishment and operation of a consultative body related to a packaging system could contribute to resolving the differences in recognition (χ2=120.068, p<0.001). Moreover, RRP could contribute to the win-win management by establi- shing a system of sharing and distributing profits (χ2=106.730, p<0.001). It is clear that the efficiency of logistics will be imp- roved if people in charge of the manufacturers’ packaging par- ticipate in the early stage of the new product development by enhancing partnership and if opinions for increasing the effi- ciency of loading such as specifications considering the com- patibility with a pallet are reflected (χ2=114.422, p<0.001).
The test of the institutional aspect showed that playing a mediator role of the government and social organizations would be needed to resolve issues (χ2=148.916, p<0.001). Moreover, the guideline reflecting diverse opinions would be essential for operating a packaging system rationally. Additionally, it would be required to complement the institutions so people could have the willingness to improve the efficiency of logistics (χ2= 95.781, p<0.001). The results of this study showed that the manufacturers and the distributors clearly have different per- spectives, which caused issues related to operating a packag- ing system. If even efforts to identify issues are not given des- pite those related to the packaging system existing, it may res- ult in social issues as the conflicts between the manufacturers and the distributors will be exacerbated. On the other hand, the contribution to improving the efficiency of logistics needs an