Correlations between the Cross-Sectional Area and Moment Arm Length of the Erector Spinae Muscle and the Thickness of the Psoas
Major Muscle as Measured by MRI and the Body Mass Index in Lumbar Degenerative Kyphosis Patients
1Hyun Lee, M.D.1, Sangjin Lee, M.D.2, Sangho Lee, M.D.2
1Department of Diagnostic Radiology, Busan Wooridul Spine Hospital
2 Department of Neurosurgery, Busan Wooridul Spine Hospital
This study was supported by a grant from the Wooridul Spine Foundation.
Received September 1, 2005 ; Accepted November 25, 2005
Address reprint requests to : Hyun Lee, M.D., Department of Diagnostic Radiology, Busan Wooridul Spine Hospital, 205-10 Nakmin-dong Dongrae-gu, Busan 607-040, Korea
Tel. 82-51-552-2100 Fax. 82-51-556-8150 E-mail: [email protected]
Purpose: Lumbar degenerative kyphosis (LDK) is a subgroup of the flatback syndrome, which is a condition caused by spinal degeneration. LDK is reported to be the most frequent cause of lumbar spine deformity in the farming districts of the ‘oriental’ countries. We inves- tigated the relationship between the cross-sectional area (CSA) and the moment arm length (MAL) of the erector spinae muscle and the thickness of the psoas major muscle (PT) and the body mass index (BMI) by performing statistical analysis, and we tried to show the crucial role of these variables for diagnosing LDK.
Materials and Methods: From July 2004 to April 2005, we retrospectively reviewed 17 LDK patients who had undergone anterior lumbar interbody fusion (ALIF) with posterior stabi- lization. We measured both the CSA & MAL on the transverse cross-sectional MR image of the trunk at the fourth to fifth vertebrae (L4/5). The MAL was defined as the anterior-posteri- or distance between the center of the erector spinae muscle and that of the vertebral body. A comparative study was undertaken between the LDK group and the matched (according to age & gender) control group with regard to the CSA, MAL, PT and BMI.
Results: The 17 LDK patients were all females [age: 62.5±4.93 years, height: 157±6.19 cm, weight: 55.59±4.7 kg, and BMI: 22.58±2.08 kg/m2]. The control group patients were all fe- males [age: 63.6±2.27 years, height: 156±5.05 cm, weight: 59.65±7.39 kg and BMI: 24.38
±2.94 kg/m2]. Spearman’s rho indicated a positive association between the CSA & BMI (rho=0.49, p=0.046), between the MAL & BMI (rho=0.808, p=0.000) and between the CSA
& PT (rho=0.566, p=0.018) in the LDK patients. In terms of the CSA versus MAL, there was a positive association in both groups (rho=0.67, p=0.000, MAL=0.023CSA+5.454 in the LDK group; rho=0.564, p=0.018, MAL=0.02CSA+5.832 in the control group with using linear regression analysis). Independent t-tests revealed that both groups had statistically dif- ferent mean values (p=0.000) in terms of the CSA & MAL.
Conclusion: This study showed that the patients with LDK not only had atrophied erector spinae muscles, but also atrophied psoas major muscles and short MALs, which is harmful because of the increased lower back load in the aged patients. Along with BMI, measure- ment of the CSA, MAL & PT on the MR images provides an objective assessment of the di- mension & severity of the muscle atrophy in the LDK patients.
Index words :Spine, curvature Spine, MR
Lumbar degenerative kyphosis (LDK) is a subgroup of the flatback syndrome, which is caused by degenera- tion, and LDK is reported to be the most frequent cause of lumbar spine deformity in the farming districts of the
‘oriental’ countries (1). Flatback syndrome is mostly re- lated to previous scoliosis surgery and particularly to the placement of Harrington rods that extend to the lumbar spine in the ‘western’ countries. Patients with LDK show a kyphosis or a marked loss of lordosis, and this is probably caused by degenerative changes in the middle- aged and elderly patients.
LDK is a syndrome of sagittal imbalance. A tendency of leaning forward when walking or standing is most common clinical sign for patients with LDK (2). The ma- jority of patients are unable to hold objects in front of them, and they have to support themselves with their el- bows while washing dishes or their faces. These are car- dinal symptoms of LDK (3), and they are often associat- ed with back pain that commences in the lumbar region and it progressively ascends. In an attempt to maintain a vertical posture, muscle fatigue causes back pain that persists until the condition is rectified.
The study by Takemitsu et al (1) only mentioned about the atrophy & fatty infiltration of the lumbar ex- tensors in LDK patients, and there remains a scarcity of published reports with respect to the quantitative evalu- ation of the back muscles of LDK patients.
We have noticed the presence of ‘slender’ psoas major muscles as well as atrophy with fatty infiltration in the erector spinae muscles on the MR studies of the LDK patients. We utilized the concept of the cross-sectional area (CSA) & the moment arm length (MAL) of the erec- tor spinae in the lumbar spine, which has been intro- duced into the literatures (4, 5), in order to quantitative- ly evaluate muscle atrophy. We investigated the rela- tionship between the CSA and the MAL of the erector spinae muscle, and the thickness of the psoas major muscle (PT) and body mass index (BMI) by performing statistical analysis. We tried to show the crucial role of these variables for diagnosing LDK.
Materials and Methods
From July 2004 to April 2005, we retrospectively re- viewed seventeen consecutive LDK patients who had undergone ALIF with posterior stabilization. All the sub- jects were female. The age, height and weight of the subjects were recorded. The body mass index (weight/height2) was calculated, which is an index that
expresses the body composition of the subject.
All patients had standing anteroposterior & lateral ra- diographs available for review. On the lateral radi- ographs, the lumbar lordosis was measured from the top of L1 to the sacral endplate by using Cobb’s method dur- ing the preoperative period and also at the latest follow- up. The radiographic evaluation included the standing 3-foot lateral radiograph that was taken with the knees and hips fully extended and the hands resting at waist level.
The control group was composed of seventeen female outpatient patients of similar ages and they had only spinal canal stenosis or herniated disks. The clinical records and radiographs of all the patients were re- viewed.
Spin echo T1-weighted (TR=717 msec and TE=12 msec) MR scans were performed on a 1.0 T supercon- ductive MRI scanner (Magnetom Harmony, Siemens Medical Systems, Erlangen, Germany). The axial scans were located through the lumbar intervertebral disk spaces and they were oriented parallel to the interverte- bral disk with the patient in the supine position. The im- ages were 512×225 pixel digital images & they were stored in PACS. A transverse cross-sectional image of the trunk at the fourth to fifth lumbar vertebrae (L4/L5) was chosen to measure the variables.
We measured the CSA & MAL based on the method of Reid et al (6). All the measurements were performed with use of a software program.
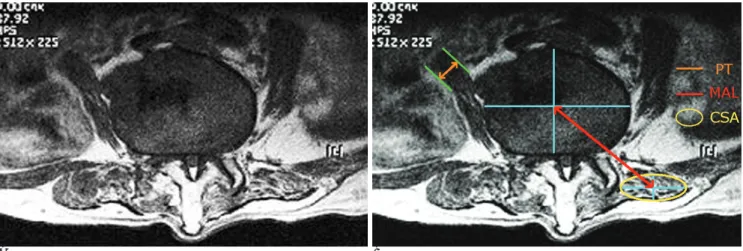
MAL was defined as the anterior-posterior distance between the center of the erector spinae muscle and that of the vertebral body. The centers of the muscle and the vertebral body were the intersections of their long and short axes with assuming that their cross-sec- tional shape was an ellipse (Fig. 1).
The statistical analysis was performed using the Statistical Package for Social Sciences (SPSS, Chicago, IL), Version 12.0.
To determine if a statistical correlation existed be- tween the BMI and the muscle atrophy of the erector spinae, Spearman’s rank correlation coefficient was per- formed for the mean BMI versus the CSA, MAL and PT.
All variables were considered to be ordinal, nonpara- metric data.
The relationship between the CSA and PT was also studied. Independent t-tests were done to determine the mean values of the CSA & MAL of the two groups.
Results
The 17 LDK patients were all females [age: 62.5±4.93 years, height: 157±6.19 cm, weight: 55.59±4.7 kgs, BMI: 22.58±2.08 kg/m2]. The control group subjects were all females [age: 63.6±2.27 years, height: 156±
5.05 cm, weight: 59.65±7.39 kg, BMI: 24.38±2.94 kg/m2] (Table 1).
Spearman’s rho correlations were analyzed for deter- mining the correlation of BMI, CSA, MAL & PT (Table 2). Spearman’s rho correlation analysis showed a signifi- cant correlation between the BMI and MAL in the LDK groups (rho=0.808, p=0.000), while there was a posi- tive association between the BMI and MAL in the con- trol group (rho=0.661, p=0.004). Thus, the lower the BMI, the lower was the MAL in the LDK patients.
Spearman’s rho correlation analysis showed a signifi- cant correlation between the BMI and CSA in the LDK
group (rho=0.49, p=0.046). This study verified that the BMI was significantly associated with atrophy of the erector spinae muscles in the LDK patients. Thus, the lower the BMI, the more prominent was the atrophy of erector spinae muscles in LDK patients. There was no statistically significant correlation between the BMI and PT in both groups.
Table 3 shows that there was a statistically significant association between the CSA and PT in the LDK pa- tients (rho=0.566, p=0.018). This supported the fact that atrophic change of the psoas major muscles was seen along with atrophy of the erector spinae muscles in the LDK patients. Such a change in the back muscles probably has detrimental effects on the spine of the
A B
Fig. 1. Lumbar degenerative kyphosis. (A) Note the atrophy with fatty infiltration of the erector spinae muscles and also the slender psoas muscles at the L4-5 level. (B) Measurement of the cross sectional area & the moment arm length of the erector spinae muscle and the thickness of the psoas major muscle.
Table 2. Correlations between the Body Mass Index and the Cross-Sectional Area of the Erector Spinae Muscle, the Moment Arm Length of the Erector Spinae Muscle and the thickness of the Psoas Major Muscle in Both the LDK and Control Groups, According to Spearman’s Rho Correlation Analysis
BMI correlation
LDK group (n=17) Control group (n=17) rho p rho p
CSA 0.490 0.046 0.449 0.071
MAL 0.808 0.000 0.661 0.004
PT 0.415 0.980 0.124 0.636
The values are given as means±standard deviation.
LDK= lumbar degenerative kyphosis; BMI= body mass index (kg/m2); CSA= cross sectional area of the erector spinae (cm2);
MAL= moment arm length of the erector spinae (cm); PT= thick- ness of the psoas major muscle (cm).
A p value of <0.05 was considered to indicate statistical signifi- cance.
Significant at the 0.001 level Significant at the 0.05 level Table 1. The Characteristics of the LDK & Control Subjects
LDK patients (n=17) Matched controls (n=17)
Age(yr) 62.5±4.93 63.6±2.27
Height(cm) 157±6.19 156±5.05
Weight(kg) 55.59±4.7 59.65±7.39
BMI(kg/m2) 22.58±2.08 24.38±2.94 CSA(cm2) 33.771±9.145 52.406±8.897 MAL(cm) 6.239±0.458 6.859±0.397 PT(cm) 2.1±0.53 2.7±0.33 The values are given as means±standard deviation.
LDK= lumbar degenerative kyphosis; BMI= body mass index;
CSA= cross sectional area of the erector spinae; MAL= moment arm length of the erector spinae; PT= thickness of the psoas ma- jor muscle
LDK patients. However, there was no statistical associa- tion between the CSA & PT in the control group (rho=- 0.408, p=0.104).
In terms of the CSA versus MAL, there was a positive association for both groups (rho=0.67, p=0.000, MAL=0.023CSA+5.454 in the LDK group; rho=0.564, p=0.018, MAL=0.02CSA+5.832 in the control group with performing linear regression analysis).
Independent t tests were performed to define any sig- nificant differences between the LDK group and the control group for the CSA & MAL. There were signifi- cant differences for the CSA & MAL between the LDK group and the control group (p=0.000). The mean CSA
& MAL of the LDK patients were markedly lower than those of the control subjects (Table 4).
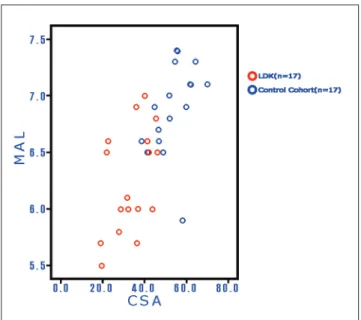
In the scatterplot (Fig. 2), the data from the LDK pa- tients were primarily in the lower left quadrant, while
the control group’s data had a trendency to be in the up- per right quadrant. The lower the values of the coupled CSA & MAL, the greater are the atrophic changes of the erector spinae muscles. In other words, the results sug- gested that the CSA and MAL might be well correlated with the severity of disease in the patients with LDK.
Sagittal contours were given as positive and negative angle values if they had kyphotic and lordotic patterns, respectively. The mean preoperative lumbar lordosis for LDK patients was 15.2°kyphosis (range: -17°lordosis to 38°kyphosis); after surgery, this was reduced to a mean of -30.8°lordosis (range: -21 to -55°). There was a substantial correction of the sagittal kyphosis in the operated patients.
Table 3. Correlations between the Cross-Sectional Area of the Erector Spinae Muscle and the Moment Arm Length of the Erector Spinae Muscle and the Thickness of the Psoas Major Muscle in both the Lumbar Degenerative Kyphosis Group and the Control Group, According to Spearman’s Rho Correlation Analysis
CSA correlation
LDK group (n=17) Control group (n=17) MAL=0.023CSA+5.454 MAL=0.02CSA+5.832
rho p rho p
MAL 0.67 0.000 -0.564 0.018
PT 0.566 0.018 -0.408 0.104
The values are given as means±standard deviation.
LDK= lumbar degenerative kyphosis; CSA= cross sectional area of the erector spinae (cm2); MAL= moment arm length of the erector spinae (cm); PT= thickness of the psoas major muscle (cm).
A p value of <0.05 was considered to indicate statistical signifi- cance.
Significant at the 0.001 level Significant at the 0.05 level
Table 4. Independent T-Test for the Cross-Sectional Area of the Erector Spinae Muscle and the Moment Arm Length of the Erector Spinae Muscle between the Lumbar Degenerative Kyphosis Group and the Control Group
CSA MAL
mean Std. deviation Std. error mean mean Std. deviation Std. error mean
LDK group (n=17) 33.771 9.1448 2.2179 6.23894 0.456223 0.111135
Control group (n=17) 52.406 8.8965 2.1577 6.85882 0.396955 0.096276
independent t-test p=0.000 p=0.000
Std. deviation= standard deviation; Std. Error mean=standard error mean
LDK= lumbar degenerative kyphosis; CSA= cross sectional area of the erector spinae (cm2); MAL= moment arm length of the erector spinae (cm).
A p value of <0.05 was considered to indicate statistical significance.
Fig. 2. Scatterplot of coupled cross sectional area & the mo- ment arm length of the erector spinae muscle in the lumbar degenerative kyphosis group and the control group. Note that the data from the lumbar degenerative kyphosis patients are primarily in the lower left quadrant, while the control group had a trendency to be in the upper right quadrant.
Discussion
In 1976, Moe and Denis (7) reported on 16 patients who showed a loss of lumbar lordosis after undergoing thoracolumbar fusions, and Moe and Denis introduced the term flat-back syndrome. Other causes of this syn- drome include prior spinal trauma and a systemic rheumatological illness such as ankylosing spondylitis (8). The resulting sagittal deformity produces increased biomechanical demands on surrounding muscles, liga- ments and intervertebral discs, and this can cause back pain and progressive degeneration. According to DeWald (9), flat-back syndrome is characterized by the loss of the normal lumbar lordosis, and this results in a typical clinical syndrome that is characterized by 1) for- ward inclination of the trunk, 2) inability to stand erect without knee flexion, and 3) pain. The lumbar spine is at a biomechanical disadvantage, and this leads to fatigue as the day progresses. Patients may also complain of an- terior thigh pain or knee pain secondary to the constant flexion at the knees that is necessary to maintain their forward horizontal gaze (10).
Takemitsu et al (1) introduced the term LDK in 1988;
they only mentioned that the patients who had LDK showed a definite weakness of the lumbar extensors compared to the flexors upon isokinetic measurement, and atrophy of these muscles with fatty infiltration was seen on CT scans.
There remains a paucity of published literature with respect to the quantitative evaluation of the back mus- cles. We have noticed ‘slender’ psoas major muscles as well as atrophy with fatty infiltration in the erector spinae muscles on the MRI studies of LDK patients. We can see these ‘outstanding’ muscles easily on the axial MR images of the lumbar spine. The erector spinae muscles are the chief extensors of the vertebral column;
acting bilaterally, all three columns of the erector spinae extend the head and also part or all of the vertebral col- umn. The psoas major is used to balance the trunk;
when sitting, it acts inferiorly with the iliacus to flex the trunk. Acting superiorly with the iliacus, it flexes the thigh and then acting superiorly, it flexes vertebral col- umn laterally. The main contributor to the anterior pelvic tilt is usually the psoas major (11).
We utilized the concept of CSA & MAL in the lumbar spine, which has been previously introduced into the medical literature (12, 13), in order to quantitatively evaluate muscle atrophy. Jorgensen (4) revealed that the
maximum anatomical CSA was located between the L3/L4 and L4/L5 level in the neural posture, and the PT is largest at L4/L5. Therefore, we measured the vari- ables at the L4/L5 level.
The decrease in the CSA of muscles, which is directly related to the decrease in muscle volume, also increases the muscle activity because the lower volume muscles can generate the same contraction forces at a higher muscle activity (14). According to the lower back biome- chanical model, the lumbar disc compression force and trunk muscle load depend on the MAL and CSA of the trunk muscles. The lumbar compression force increases with the trunk muscle activity and the body weight. The elongation of the MAL is effective in suppressing the compression force by reducing the muscle activity (15).
In other words, the shortage of MAL and the decrease in muscle volume corresponding to the decrease in height and weight will therefore result in poor compensation for the lower back load. A decrease in trunk muscle effi- ciency has been shown to increase the load on the lum- bar discs and ligaments (9). This may leave the lum- bopelvic region vulnerable to strain, instability or injury (16). Kumbar (13) claimed there was no effect of age on the MAL. Age was not shown to be related to the CSA for either gender (13).
We investigated if the relationship between the CSA, MAL, PT and BMI had statistical significance in the LDK group and the matched (age & gender) control group.
To the best of our knowledge, no previous study has directly evaluated the association between BMI and the CSA & PT in the LDK patients. BMI is an index that shows the body composition of the subjects, so we spec- ulated that the BMI might be associated with the deep back muscles. Concerning MAL, Reid et al (12) have found significant correlation with height & weight.
MRI offers advantages for visualizing muscle atrophy.
Spearman’s rho allows estimation of the strength of the association between two variables. Correlation shows association and not causation. One important finding in the present study is that there was a positive association between the BMI & CSA in the LDK patients, while there was no statistical association in the control group.
Thus, it would be expected that the lower the BMI, the more prominent is the atrophy of the erector spinae muscles in the LDK patients.
Another important finding is that there was a statisti- cally significant association between the CSA and the PT in the LDK patients. However, there was no statistical
association between the CSA & PT in the control group.
This fact warranted the conclusion that atrophic change could be found in the psoas muscles as well as the erec- tor spinae muscles in the LDK patients. Such a change in the back muscles could have detrimental effects on the spine of the LDK patients.
The other important finding is that LDK patients were primarily in the lower left quadrant in the scatterplot di- agram of the coupled CSA & MAL, while the control group had a trend to be in the upper right quadrant. A positive correlation was found between the CSA and the MAL in the LDK and control groups. The mean CSA &
MAL of the LDK patients were markedly lower than those of the control subjects. The MAL of trunk muscles such as the erector spinae to the lumbar vertebra and the CSA of these muscles are biomechanical parameters that can help estimate the lower back load. Significant correlations were observed between the size of the paraspinal muscles and the isometic back extension strength (p=0.0001) (17). So, we may speculate that MRI can be used as an adjunctive tool for the evaluation &
prediction of the severity of the LDK. Yet grading of muscle atrophy on the MR images was not attempted in this study. Further investigation is warranted with using a prospective cohort study design.
Therefore, we could say that measurement of the CSA, MAL and PT along with the BMI may help physi- cians reach a more confident diagnosis for the patients with ‘clinically suspicious’ LDK.
Indications for the surgical treatment of kyphosis are based on the stiffness of the curve, the level of the pa- tient’s symptoms, the cosmetic concerns and the radi- ographic measurement of magnitude and progression of the curve (18).
We performed ALIF with pedicle screw fixation for the patients with LDK. The objective of the surgery is to correct the spinal alignment and to obtain a stable, well balanced spinal column. Although the relative values of lumbar lordosis show a wide range in the normal popu- lation, with using this technique it was possible to ob- tain a resultant sagittal plane correction of up to 55°lor- dosis.
It should be noted that a number of limitations exist in this investigation. First, the study is retrospective in na- ture. As a retrospective review, this study may be sub- ject to the sampling problems that are inherent to this mode of investigation. Second, this study included a rel- atively small number of patients, which may have af- fected the statistical power for identifying the differ-
ences between the LDK and control groups. Further re- search with a larger sample size will be required to con- firm the results of the present study, even if the matched-cohort design was intended to strengthen the analysis.
In conclusion, the patients with LDK not only had at- rophied erector spinae muscles, but they also had atro- phied psoas major muscles and short MAL measure- ments, which is detrimental because of increased lower back load in the aged. Along with BMI, measurement of the CSA, MAL & PT on the MR images provides for ob- jective assessment of the dimension & severity of mus- cle atrophy in the LDK patients.
Acknowledgments
The authors thank Ms. Hansoon Lee and Inkyung Ha, Department of Research and Education at Wooridul Spine Hospital, for their assistance during the statistical analysis.
References
1. Takemitsu Y, Harada Y, Iwahara T, Miyamoto M, Miyatake Y.
Lumbar Degenerative Kyphosis: clinical, radiological and epidemi- ological studies. Spine 1988;13:1317-1326
2. Farcy JP, Schwab FJ. Management of flatback and related kyphot- ic decompensation syndromes. Spine 1997;22:2452-2457
3. Lee CS, Kim YT, Kim EG. Clinical study of Lumbar Degenerative Kyphosis. J Korean Spine Surg 1997;4:27-35
4. Jorgensen MJ, Marras WS, Gupta P. Cross-sectional area of the lumbar back muscles as a function of torso flexion. Clin Biomech 2003;18:280-286
5. Chaffin DB, Redfern MS, Erig M, Goldstein SA. Lumbar muscle size and locations from CT scans of 96 women of age 40 to 63 years. Clin Biomech 1990;5:9-16
6. Reid JG, Costigan PA. Trunk muscle balance and muscular force.
Spine 1987;12:783-786
7. Moe JH, Denis F. The iatrogenic loss of lumbar lordosis. Orthop Trans 1977;1:131
8. Bridwell KH, Lenke LG, Lewis SJ. Treatment of spinal stenosis and fixed sagittal imbalance. Clin Orthop Relat Res 2001;384:35-44 9. DeWald RL. Revision surgery for spinal deformity. Instr Course
Lect 1992;41:235-250
10. Hasday CA, Passoff TL, Perry J. Gait abnormalities arising from ia- trogenic loss of lumbar lordosis secondary to Harrington instru- mentation in lumbar fractures. Spine 1983;8:501-511
11. Moore KL, Dalley AF. Clinically oriented anatomy. 4th ed.
Philadelphia: Lippincott Williams & Wilkins, 1999:299-300 12. Reid JG, Costigan PA, Comrie W. Prediction of trunk muscle areas
and moment arms by use of anthropometric measures. Spine 1987;12:273-275
13. Kumbar S. Moment arms of spinal musculature determined from CT scans. Clin Biomech 1988;3:137-144
14. McGill SM. A myoelectrically based dynamic three-dimensional model to predict loads on lumbar spine tissues during lateral bend- ing. J Biomech 1992;25:395-414
15. Chaffin DB, Andersson Gunnar BJ, Martine BJ. Occupational Biomechanics. 3th ed. New York:Wiley-Interscience, 1999 16. Gibbons LE, Latikka P, Videman T, Manninen H, Battie MC. The
association of trunk muscle cross-sectional area and magnetic reso- nance image parameters with isokinetic and psychophysical lifting strength and static back muscle endurance in men. J Spinal Disord 1997;10:398-403
17. Kaser L, Mannion AF, Rhyner A, Weber E, Dvorak J, Muntener M. Active therapy for chronic low back pain: part 2. effects on paraspinal muscle cross-sectional area, fiber type size, and distrib- ution. Spine 2001;26: 909-919
18. Stotts AK, Smith JT, Santora SD, Roach JW, D’Astous JL.
Measurement of spinal kyphosis; implications for the manage- ment of Scheuermann’s kyphosis. Spine 2002;27:2143-2146
대한영상의학회지 2006;54:203-209
퇴행성 요추 후만증에서 MR상 측정한 척주 기립근의 단면적 및 모멘트 팔 길이와 대요근의 두께와 체 질량 계수의 상관관계
11부산우리들병원 영상의학과, 2신경외과 이 현1・이상진2・이상호2
목적: 퇴행성 요추 후만증(Lumbar degenerative kyphosis, LDK)은 퇴행성 변화에 의해 생기는 편평 요추 증후군 의 한 형태로서 우리나라 농촌 지역에서 요추 변형의 가장 흔한 원인이다. 저자들은 MR 영상에서 측정한 척주 기 립근의 단면적 및 모멘트 팔 길이 와 대요근의 두께와 체 질량 계수 사이의 상관관계를 조사하여 퇴행성 요추 후 만증의 진단 시에 이들 변수가 도움을 줄 수 있는 지를 밝히고자 하였다.
대상과 방법: 2004년 7월에서 2005년 4월 까지 전방 요추체간 유합술과 척추경 나사못 고정술을 시행한 17명의 전형적인 퇴행성 요추 후만증 환자를 대상으로 후향적으로 분석하였다. 요추 제 4/5 레벨에서 척주 기립근의 단면 적(CSA)과 모멘트 팔 길이(MAL)와 대요근의 두께(PT)를 측정하였다. 모멘트 팔 길이란 척주기립근의 중심과 추 체의 중심사이의 전후 거리이며, 이것이 퇴행성 요추 후만증군과 성별과 나이를 고려한 대조군사이에 측정한 변수 CSA, MAL, PT, 체 질량 계수(BMI) 사이에 상관관계가 있는 지를 조사하였다.
결과: 17명의 퇴행성 요추 후만증 환자는 모두 여성이었고 평균 나이는 62.5±4.93세, 키는 157±6.19 cm, 체중은 55.59±4.7 kg, BMI는 22.58±2.08 kg/m2이었다. 대조군은 17명의 여성 외래 환자이었고 평균 나이는 63.6±2.27 세, 키는 156±5.05 cm, 체중은 59.65±7.39 kg, BMI는 24.38±2.94 kg/m2이었다. Spearman씨 rho 상관 분석 검 사에서 환자군에서 CSA와 BMI 사이에 양성 관련성을 보였고(rho=0.49, p=0.046), MAL과 BMI 사이에 강한 양 성 관련성을 보였고(rho=0.808, p=0.000), CSA와 PT사이에 양성 관련성을 보였다(rho=0.566, p=0.018). 선형 계수 분석법에 의하면 퇴행성 요추 후만증 환자에선 CSA과 MAL사이에 양성 관련성이 있고 (rho=0.67, p=0.000, MAL=0.023CSA+5.454), 대조군에서도 CSA와 MAL 사이에 양성 관련성이 있었다(rho=0.564, p=0.018, MAL=0.02CSA+5.832). 환자군과 대조군 사이에 CSA와 MAL을 대상으로 독립 t-검사(Independent t-test)를 시행하였을 때 평균치가 통계적으로 유의한 차이를 보였다(p=0.000).
결론: 퇴행성 요추 후만증 환자의 MR영상 분석에서 척주 기립근의 위축 뿐 만 아니라 대요근의 두께가 상당히 감 소하였고 모멘트 팔 길이가 짧아진 것을 알 수 있었다. 이는 노인에서 허리에 가해지는 부하가 증가되어 악영향을 미치고 있음을 시사한다. 임상적으로 퇴행성 요추 후만증이 의심될 경우 체 질량 계수를 구하고 MRI를 시행하여 척주 기립근의 단면적과 모멘트 팔 길이와 대요근의 두께를 측정하면 근위축의 정도를 객관적으로 정량적으로 파 악할 수 있다.