Relationship between Blood Pressure Variability and the Quality of Life
Jidong Sung,
1,2Jong-Min Woo,
3,4Won Kim,
3,4Seoung-Kyeon Lim,
5and Ahn-Soo Chung
41Division of Cardiology, Department of Medicine, Cardiac and Vascular Center,
2Health Promotion Center, Samsung Medical Center, Sungkyunkwan University School of Medicine, Seoul;
3Department of Psychiatry, Seoul Paik Hospital, Inje University School of Medicine, Seoul;
4Stress Research Institute, Inje University, Seoul;
5Korean Employee Assistance Professionals Association, Seoul, Korea.
Received: May 7, 2013 Revised: August 1, 2013 Accepted: August 11, 2013
Corresponding author: Dr. Jong-Min Woo, Department of Psychiatry,
Seoul Paik Hospital,
Inje University School of Medicine, 9 Mareunnae-ro, Jung-gu, Seoul 100-032, Korea.
Tel: 82-2-2270-0940, Fax: 82-2-2270-0344 E-mail: [email protected]
∙ The authors have no financial conflicts of interest.
© Copyright:
Yonsei University College of Medicine 2014 This is an Open Access article distributed under the terms of the Creative Commons Attribution Non- Commercial License (http://creativecommons.org/
licenses/by-nc/3.0) which permits unrestricted non- commercial use, distribution, and reproduction in any medium, provided the original work is properly cited.
Purpose: Blood pressure variability (BPV) is emerging as an important cardiovas- cular prognostic factor in addition to average blood pressure level. While there have been some suggestions for the determinants of the blood pressure variability, little is known about the relationship between the blood pressure variability and health-re- lated quality of life (QOL). Materials and Methods: Fifty-six men and women with mild hypertension were enrolled from local health centers in Republic of Ko- rea, from April to October 2009. They self-monitored their blood pressure twice daily for 8 weeks. Pharmacological treatment was not changed during the period.
Standard deviation and coefficient of variation of blood pressure measurements were calculated as indices of BPV. Measurements of QOL were done at initial and at 8-week follow-up visits. Results: Study subjects had gender ratio of 39:41 (male:female) and the mean age was 64±10 years. The mean home blood pressure’s at week 4 and 8 did not differ from baseline. Total score of QOL at follow-up visit and change of QOL among two measurements were negatively correlated to BPV indices, i.e., higher QOL was associated with lower BPV. This finding persisted af- ter adjustment for age, gender and the number of antihypertensive agents. Among dimensions of QOL, physical, mental and hypertension-related dimensions were associated particularly with BPV. Conclusion: QOL may be a significant determi- nant of BPV. Improvement of QOL may lead to favorable changes in BPV.
Key Words: Blood pressure variability, quality of life, hypertension
INTRODUCTION
While main focus in the diagnosis and treatment of hypertension is still on the
mean blood pressure, blood pressure variability (BPV) has been suggested as a
significant prognostic indicator in recent studies,
1,2independent of average blood
pressure level. However, not much is known regarding determinants of BPV, Some
studies showed that BPV may be influenced by the choice of antihypertensive
agents,
3,4and other associated factors such as sleep disorders,
5environmental stim-
Paik Hospital, Inje University, Seoul, Republic of Korea.
Blood pressure measurements
Manual office BP measurements by mercury sphygmoma- nometers were done in the local health centers at initial visit and after completing the program (at the day 3 in the con- trol group) by a research nurse, maintaining the same envi- ronment in both groups by the conventional methods.
11Home BP monitoring was done for 8 weeks as follows and used for calculation of day-to-day BPV: after 5 min rest, seated, one measurements were done in the morning before drug intake (6-10 am) and the other in the evening (6-10 pm) with designated BP monitor (UA-767, A&D, To- kyo, Japan) and recorded by patients. Measurements on the other timings were not prohibited. All values measured on the first day were excluded from analysis.
Quality of life
A QOL measurement tool developed by Kim, et al.
12was used, which is based on widely used existing QOL tools such as CHO-60, MOS SF-36, and Duke-UNC Health pro- file. This consists of 5 domains which are general health (GH), physical (PD), mental (MD), social (SD), and hy- pertension (HTN)-related dimension. The number of ques- tions is 23 and each question has 5-point Likert scale. The total score ranges from 23 to 115, the higher the score, the better the QOL. This tool is a version of ‘disease-specific’
QOL measurement tool which includes some questions spe- cific for hypertensive patients and can be used for evalua- tion of QOL in hypertensive patients. Measurements were done at initial visits and at 8 weeks.
Statistical analysis
Day-to-day variability of blood pressure was defined as the standard deviation (SD) and coefficient of variation (CV=
SD/mean) of measurements of 8 weeks total, morning BP’s and evening BP’s, respectively. Continuous variables were described as mean±SD, or median (25-75 percentile) if a variable was not normally distributed. Comparisons of means between the 2 groups were done by Student’s t-test, or Wilcoxon’s rank sum test in variables not normally dis- tributed. All comparisons were done by 2-tailed tests. In t- test with unequal variances between the groups, Satterth- waite degrees of freedom were used. To compare overall longitudinal BP change between 2 groups, repeated mea- sure ANOVA was used with addition of interaction term between group and measurement timing. To determine pre- uli,
6age, personality and alcohol consumption
7have also
been described. Previous observational study
8indicated that cardiovascular diseases are associated with anxiety and de- pressive symptoms, which can potentially influence various hemodynamic factors including blood pressures. Wider fluc- tuation of blood pressure may be related to perception of life quality either appropriate or not. Sakakura, et al.
9reported the association of exaggerated BPV with cognitive dysfunction and poor quality of life (QOL) in the elderly, and Okano, et al.
10showed that base blood pressure during sleep is related to health-related QOL. These two studies evaluated BPV on 24-hour ambulatory blood pressure monitoring. The aim of this work is to investigate the association of day-to-day BPV with health-related QOL in hypertensive patients.
MATERIALS AND METHODS
Subjects
Subjects were participants of clinical trial evaluating the ef- fect of cognitive behavior therapy-based ‘forest therapy’
program in hypertensive patients. Fifty-six men and women were enrolled for the study, being referred from two local health centers. Recruitment was mainly done by self-refer- ral by local advertisement and referral from physicians in the health centers. Subjects had stage I hypertension or pre- hypertension, with or without antihypertensive medications.
They were assigned to either to the experimental group who participated in the forest therapy program or the control group who did only self-monitoring of blood pressure for 8 weeks without participation to the program. This was done by convenient assignment and not true randomization, con- sidering the subjects’ preference and feasibility to actual par- ticipation of the forest therapy program, i.e., patients chose whether to participate in the forest therapy program or not.
They were instructed not to change their antihypertensive medication during the study period, and if prescribing local physician requested the change of their regimen, the patient was dropped out. Finally, 28 persons in each groups fin- ished 8-week follow-up schedule. Inclusion and exclusion criteria, process of enrollment and the contents of the forest therapy program and the additional test such as salivary cortisol level are described in previously published results of the trial.
11Informed written consents were obtained from all the
subjects before the participation of the study. This study
was approved by the Institutional Review Board of Seoul
included as explanatory variables. Starting with stepwise regression applying backward selection with elimination p=0.15, empirical exploration was done to maximize ex- planatory power of the model. p-value below 0.05 was con- sidered as being statistically significant. The statistical package used for the analysis was Stata/MP 12.1 for Win- dows (32-bit) (College Station, TX, USA).
RESULTS
General characteristics of the study subjects are described in Table 1. Blood pressure control status seemed to be good in the majority of patients with mean systolic blood pressure and diastolic blood pressure in 130’s and 70’s. Antihyper- tensive medication was being taken by 79% of the subjects, and the number of medication was mainly 1 or 2 except for 6 subjects. Home BP did not change significantly during 8 weeks. Total score of QOL was significantly improved at 8th week compared to the baseline. As previously published, general clinical characteristics were not different between the groups, and QOL improvement was significantly great- er in forest therapy group (data not shown).
11Correlates of BPV as standard deviation of SBP’s during 8 weeks are shown in Table 2. Older age and larger number of antihypertensive medication were associated with high BPV.
Total score of QOL correlated inversely with BPV. BPV as coefficient of variation showed same pattern of association.
Parameters of BPV were not significantly different between male and female subjects (as SD, male 10.4±0.8, female 10.3±0.5, p=0.92) and not influenced by the treatment group (as SD, control group 10.6±0.7, forest therapy group 10.1±
0.6, p=0.60). Fig. 1 is a scatter plot showing the relationship between total score of QOL and BPV as coefficient of vari- ation of SBP’s. Even though the forest therapy group (shown in solid dots) apparently tended to have higher QOL score than the control group (shown in hollow dots), BPV was not different between the two groups.
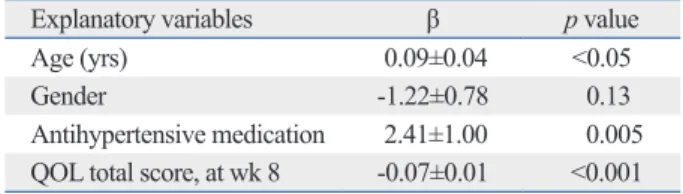
Multiple regression model with standard deviation of SBP’s during 8 weeks as a dependent variable (Table 3) showed that higher total score of QOL was associated with lower BPV af- ter adjustment for age, gender and use of antihypertensive medication (p<0.0001).
Among various domains of QOL, physical, mental and hypertension-related dimension were inversely correlated to BPV at 8th week measurement, while GH and social dimen- sion were not (Table 4). Any domain of the baseline QOL dictors of BPV, multiple regression models with BPV pa-
rameters as dependent variables and variables which showed significant association with BPV in bivariate analysis were Table 1. General Characteristics of Study Subjects
Variables Mean±SD
(range) p value*
Age (yrs) 64±10 (40-83)
Male (%) 39
Number of antihypertensive
medication 1.3±1.0 (0-4)
Baseline clinic SBP (mm Hg) 133±15 Baseline clinic DBP (mm Hg) 77±12
BMI (kg/m2) 24±3
Home SBP at wk 1 (mm Hg) 123±11
Home SBP at wk 8 (mm Hg) 121±9 NS
Home DBP at wk 1 (mm Hg) 76±7
Home DBP at wk 8 (mm Hg) 75±6 NS
QOL total score, baseline 48±10
QOL total score, at wk 8 77±21 <0.001 QOL, quality of life; SBP, systolic blood pressure; DBP, diastolic blood pres- sure; BMI, body mass index; NS, not significant.
*p for difference compared to values at week 1 or baseline.
Table 2. Correlates of Blood Pressure Variability (Standard Deviation of SBP during 8 Weeks)
Variables R p value
Age 0.41 <0.005
Number of antihypertensive
medication 0.29 <0.05
Baseline clinic SBP -0.07 NS
Baseline clinic DBP -0.31 <0.05
BMI -0.004 NS
QOL total score, baseline -0.14 NS
QOL total score, at wk 8 -0.45 <0.001 QOL, quality of life; SBP, systolic blood pressure; DBP, diastolic blood pres- sure; BMI, body mass index; NS, not significant.
Quality of life, total score
CV of SBP
0 0.05 0.1 0.15
20 40 60 80 100 120
Control Forest therapy
r=-0.46, p<0.001
Fig. 1. Scattergram showing the association between blood pressure vari- ability [coefficient of variation of systolic blood pressure (CV of SBP)] and the total score of quality of life.
ported that lower QOL in hypertensive patients was related to the awareness of the disease and consequently negative psychological response and not the disease itself.
16Proba- bly, intervention of forest therapy may influence QOL posi- tively in treatment group, which made the distribution of the QOL score wider thus increasing statistical power in testing the association between the QOL and BPV. There is a possibility that forest therapy intervention had favorable effect on BPV, although the control group also showed non- specific increase of the QOL, diluting the between-group difference. Thus, our present result may not be applicable to the general population in the absence of a particular inter- vention designed for improving QOL. Larger scale inter- ventional study may be needed to confirm that improve- ment of the QOL can lead to decreased BPV.
We do not have detailed information on medications used by the study subjects, which is a significant limitation be- cause antihypertensive medication is known to have some influence on BPV.
3,4However, because we excluded pa- tients who needed regimen change during the study period, confounding by the medication effect could be minimized.
Subjects with medication showed larger BPV than those who were not in pharmacological treatment. While previous studies showed antihypertensive agents usually decreasing BPV with some difference between the antihypertensive agent classes, comparison of BPV between the medicated hypertensive group and non-medicated less severe hyper- tensive group has not been done. Considering that the base- measurement was not significantly associated with BPV.
DISCUSSION
This study is the first to show the relationship between the QOL and day-to-day BPV. Previous studies
9,10,13which re- ported the association of QOL and BPV utilized 24-hour ambulatory BP monitoring and mainly focused on diurnal pattern. However, recent studies suggested that day-to-day or visit-to-visit BPV, rather than diurnal variation, is an im- portant prognostic indicator.
1,2,14Our results showed the BPV over 8-week period, calculated from daily measure- ments of home BP, had significant association with the QOL evaluated by hypertension-specific QOL measurement tool.
While not much has been known for determinants of BPV, it is highly probable that some psychological and/or cogni- tive factors are closely related, because blood pressure shows prompt and wide variation in response to environmental stimuli and its consequential psychological response.
15QOL reflects subjective perception and appraisal to the current sta- tus of life and estimated poor QOL may mean that perception of daily environment stimuli tends to be in a predominantly negative direction. In addition to subjective aspects of per- ceptive process, if life quality of a certain person is truly compromised, he or she would be more likely to experience frequent and/or strong daily environmental stimuli eliciting negative emotions, which may result in increased BPV.
The reason is not clear why certain domains of the QOL were more closely related to BPV than the others. In our data, physical, mental and hypertension-related domains significantly correlated to BPV while general health and so- cial domains did not. And it is also not well-explained why QOL at week 8 follow-up showed significant association with BPV while baseline QOL did not. There may be some possible influence of behavioral intervention which this study originally intended.
The study subjects were participants of clinical trial to in- vestigate the effect of the cognitive behavior therapy-based
‘forest therapy’ program in hypertensive patients. Previous- ly published results of the trial showed that forest therapy group showed significantly more improvement of QOL and decrease of salivary cortisol at 8-week follow up while BP change was not different between groups.
11While the QOL increased more in forest therapy group, control group also showed some increase of QOL, probably reflecting nonspe- cific regression to mean. Previous cross-sectional study re-
Table 4. Correlation between Blood Pressure Variability (Standard Deviation of SBP during the 8th Week) and Do- mains of Quality of Life at the 8th Week
Domains r p value
General health 0.15 NS
Physical -0.39 <0.005
Mental -0.50 <0.0005
Social -0.06 NS
Hypertension-related -0.45 <0.001
SBP, systolic blood pressure; NS, not significant.
Table 3. Multivariate Model Explaining Blood Pressure Vari- ability (Standard Deviation of SBP ’s during 8 Weeks)
Explanatory variables β p value
Age (yrs) 0.09±0.04 <0.05
Gender -1.22±0.78 0.13
Antihypertensive medication 2.41±1.00 0.005 QOL total score, at wk 8 -0.07±0.01 <0.001 QOL, quality of life; SBP, systolic blood pressure.
R2=0.42.
3. Webb AJ, Fischer U, Mehta Z, Rothwell PM. Effects of antihyper- tensive-drug class on interindividual variation in blood pressure and risk of stroke: a systematic review and meta-analysis. Lancet 2010;375:906-15.
4. Zhang Y, Agnoletti D, Safar ME, Blacher J. Effect of antihyper- tensive agents on blood pressure variability: the Natrilix SR versus candesartan and amlodipine in the reduction of systolic blood pressure in hypertensive patients (X-CELLENT) study. Hyperten- sion 2011;58:155-60.
5. Nabe B, Lies A, Pankow W, Kohl FV, Lohmann FW. Determinants of circadian blood pressure rhythm and blood pressure variability in obstructive sleep apnoea. J Sleep Res 1995;4(S1):97-101.
6. van den Meiracker AH, Man in ‘t Veld AJ, van Eck HJ, Wenting GJ, Schalekamp MA. Determinants of short-term blood pressure variability. Effects of bed rest and sensory deprivation in essential hypertension. Am J Hypertens 1988;1:22-6.
7. Puddey IB, Jenner DA, Beilin LJ, Vandongen R. Alcohol con- sumption, age and personality characteristics as important deter- minants of within-subject variability in blood pressure. J Hyper- tens Suppl 1988;6:S617-9.
8. Serafini G, Pompili M, Innamorati M, Iacorossi G, Cuomo I, Della Vista M, et al. The impact of anxiety, depression, and suicidality on quality of life and functional status of patients with congestive heart failure and hypertension: an observational cross-sectional study.
Prim Care Companion J Clin Psychiatry 2010;12.
9. Sakakura K, Ishikawa J, Okuno M, Shimada K, Kario K. Exag- gerated ambulatory blood pressure variability is associated with cognitive dysfunction in the very elderly and quality of life in the younger elderly. Am J Hypertens 2007;20:720-7.
10. Okano Y, Tochikubo O, Umemura S. Relationship between base blood pressure during sleep and health-related quality of life in healthy adults. J Hum Hypertens 2007;21:135-40.
11. Sung J, Woo JM, Kim W, Lim SK, Chung EJ. The effect of cogni- tive behavior therapy-based “forest therapy” program on blood pressure, salivary cortisol level, and quality of life in elderly hy- pertensive patients. Clin Exp Hypertens 2012;34:1-7.
12. Kim KY, Chun BY, Kam S, Lee SW, Park KS, Chae SC. [Devel- opment of measurement scale for the quality of life in hyperten- sive patients]. J Prev Med Public Health 2005;38:61-70.
13. Okano Y, Hirawa N, Tochikubo O, Mizushima S, Fukuhara S, Ki- hara M, et al. Relationships between diurnal blood pressure varia- tion, physical activity, and health-related QOL. Clin Exp Hyper- tens 2004;26:145-55.
14. Rothwell PM. Limitations of the usual blood-pressure hypothesis and importance of variability, instability, and episodic hyperten- sion. Lancet 2010;375:938-48.
15. Falkner B. Blood pressure response to mental stress. Am J Hyper- tens 1991;4:621S-3S.
16. Korhonen PE, Kivelä SL, Kautiainen H, Järvenpää S, Kantola I.
Health-related quality of life and awareness of hypertension. J Hy- pertens 2011;29:2070-4.
line SBP did not differ significantly between medicated and non-medicated group (medicated 132±15 mm Hg vs. non- medicated 136±16 mm Hg, p=0.47), non-medicated group probably had less severe hypertension than medicated group, which may be a possible reason why they had less variability in blood pressures.
There are several other limitations in this study. This study was not originally designed to evaluate the relationship be- tween QOL and BPV, but as a clinical trial to evaluate the effect of behavioral intervention. Larger-scale study is need- ed to confirm the study finding. A behavioral intervention trial has inherent difficulty in randomization because pa- tients’ willingness to participate is crucial for proper appli- cation of the experimental treatment. Our trial also has that limitation. However, because the effect of forest therapy pro- gram is not a main focus of this study, we think that this convenient and non-random assignment may not have cru- cial influence on the study result. Sample size was small, including only patients with mild hypertension.
In conclusion, blood pressure variability has significant association with the QOL in a small group of mildly hyper- tensive patients. Improvement of QOL may induce favor- able change in blood pressure variability.
ACKNOWLEDGEMENTS
Financial support came from ‘Forest Science & Technolo- gy Projects (S11113L020100)’ from Korea Forest Service (PI, Woo).
REFERENCES
1. Kikuya M, Ohkubo T, Metoki H, Asayama K, Hara A, Obara T, et al. Day-by-day variability of blood pressure and heart rate at home as a novel predictor of prognosis: the Ohasama study. Hyperten- sion 2008;52:1045-50.
2. Rothwell PM, Howard SC, Dolan E, O’Brien E, Dobson JE, Dahlöf B, et al. Prognostic significance of visit-to-visit variability, maximum systolic blood pressure, and episodic hypertension.
Lancet 2010;375:895-905.
![Fig. 1. Scattergram showing the association between blood pressure vari- vari-ability [coefficient of variation of systolic blood pressure (CV of SBP)] and the total score of quality of life.](https://thumb-ap.123doks.com/thumbv2/123dokinfo/5487518.667414/3.892.84.424.592.768/scattergram-showing-association-pressure-coefficient-variation-systolic-pressure.webp)