• 검색 결과가 없습니다.

The Relationship Between Ambulatory Arterial Stiffness Index and Blood Pressure Variability in Hypertensive Patients

N/A
N/A
Protected

Academic year: 2022

Share "The Relationship Between Ambulatory Arterial Stiffness Index and Blood Pressure Variability in Hypertensive Patients"

Copied!
6
0
0

로드 중.... (전체 텍스트 보기)

전체 글

(1)

235

Open Access

The Relationship Between Ambulatory Arterial Stiffness Index and Blood Pressure Variability in Hypertensive Patients

Hyung Tak Lee, MD

1

, Young-Hyo Lim, MD

1

, Bae Keun Kim, MD

1

, Kang Won Lee, MD

1

, Jae Ung Lee, MD

1

, Kyung Soo Kim, MD

1

, Soon Gil Kim, MD

1

, Jeong Hyun Kim, MD

1

, Heon Kil Lim, MD

1

, Jinho Shin, MD

1

, and Yu-Mi Kim, MD

2

1

Division of Cardiology, Department of Internal Medicine, Hanyang University College of Medicine, Seoul,

2

Department of Preventive Medicine, Dong-A University College of Medicine, Busan, Korea

ABSTRACT

Background and Objectives: Ambulatory arterial stiffness index (AASI) is well known as a predictor of cardiovascular mor- tality in hypertensive patients. Mathematically, AASI reflect the standard deviation (SD) of blood pressure (BP) variation.

AASI is measured higher levels in non-dipper than dipper. Thus, AASI has a possibility of not only reflecting arterial stiffness but also BP variability and/or autonomic nervous dysfunction. Subjects and Methods: Consecutive data from 418 untreat- ed hypertensive patients were analyzed retrospectively. We examined the association between the 24-hour ambulatory BP mo- nitoring (ABPM) parameters and AASI. Results: AASI had a simple correlation with age (R=0.189, p<0.001), relative wall thickness (RWT) (R=0.115, p=0.019), left ventricular mass index (LVMI) (R=0.192, p<0.001), average systolic BP (SBP) (R=

0.232, p<0.001), average pulse pressure (PP) (R=0.363, p<0.001), SD of diastolic BP (DBP) (R=-0.352, p<0.001), SD of PP (R=

0.330, p<0.001), SD of heart rate (HR) (R=-0.268, p<0.001), and nocturnal dipping (R=-0.137, p=0.005). In multiple linear regression analysis model including clinical parameters and 24 hour-ABPM parameters, independent predictors of AASI were SD of PP (β=1.246, p<0.001), SD of DBP (β=-1.067, p<0.001), SD of SBP (β=-0.197, p<0.001), and non-dipper (β=0.054, p=0.033). Conclusion: AASI is closely correlated with BP variability. The result of this study shows that AASI is not only a parameter for arterial stiffness, but also a parameter for BP variability. (Korean Circ J 2011;41:235-240)

KEY WORDS: Blood pressure; Blood pressure monitoring, ambulatory; Autonomic nervous system diseases.

Received: July 2, 2010

Revision Received: September 7, 2010 Accepted: September 10, 2010

Correspondence: Jinho Shin, MD, Division of Cardiology, Department of Internal Medicine, Hanyang University College of Medicine, 17 Haeng- dang-dong, Seongdong-gu, Seoul 133-792, Korea

Tel: 82-2-2290-8308, Fax: 82-2-2298-9183 E-mail: [email protected]

• The authors have no financial conflicts of interest.

cc

This is an Open Access article distributed under the terms of the Cre- ative Commons Attribution Non-Commercial License (http://creativecom- mons.org/licenses/by-nc/3.0) which permits unrestricted non-commer- cial use, distribution, and reproduction in any medium, provided the origi- nal work is properly cited.

Introduction

Ambulatory arterial stiffness index (AASI) is a marker of ar- terial stiffness suggested by Li et al.

1)

AASI is a well known pre- dictor of cardiovascular mortality in hypertensive patients.

2)

In the dynamic relation between systolic and diastolic blood pressure (BP), for a given increase in diastolic BP (DBP), the increase in systolic BP (SBP) is smaller in a compliant artery

than in a stiff artery.

3)

According to this basic principle, Li et al.

1)

calculated the regression slope of DBP on SBP from the BP value of 24 hour ambulatory BP monitoring (ABPM), to quantify the increase in DBP for a given SBP change. One mi- nus the slope corresponds to AASI, which is known to reflect arterial stiffness.

1)

However, the biological mechanisms underlying AASI as a parameter of arterial stiffness is not yet fully understood. First, by using ABPM, AASI is inevitably influenced by BP variabi- lity component. In other words, with a mathematical consi- deration, the standard deviation (SD) of DBP as a numerator of the regression slope is positively correlated with the regress- ion slope of DBP on SBP. Consequently, SD of DBP is inver- sely correlated with AASI (1-regression slope).

Second, BP variability has also been documented to be a pr-

ognostic marker in some reports.

4-7)

According to a previous

report, AASI has only weak correlations with the parameters

of arterial stiffness.

8)

There appears to be a possibility that AA-

SI, as a prognostic marker, is confounded by BP variability.

(2)

Moreover, some studies showed that AASI is strongly in- fluenced by factors unrelated to arterial stiffness, i.e., noctur- nal BP fall.

8)9)

According to Schillaci et al.

8)

AASI is higher in non-dippers than dippers. AASI has a possibility of reflecting not only arterial stiffness, but also diurnal BP variability and/

or autonomic nervous dysfunction. Therefore, we hypothesiz- ed that BP variability is a significant biologic mechanism un- derlying AASI, and elected to study the relationship between AASI and BP variability in hypertensive patients using ABPM data.

Subjects and Methods

Study population

The dataset of 644 consecutive patients was acquired from the ABPM database. The patients had undergone both ABPM and echocardiography at the Hanyang University Hospital, Seoul, the Republic of Korea from February 16th, 2006 to De- cember 31st, 2008. Among these 644 patients, only hyper- tensive patients who had not taken medication were enroll- ed. Hypertension was defined as clinic BP of at least 140/90 mmHg, or 24 hour average BP of at least 135/85 mmHg, or an- tihypertensive drug treatment in patients with history of hy- pertension. Finally, consecutive data from 418 patients were analyzed retrospectively.

Height, weight, clinical BP and heart rate (HR) were mea- sured before ABPM was performed. Diabetes was defined as a self-reported history of being told by a physician that dia- betes was present, or having a fasting glucose of 126 mg/dL or greater. Clinical information was collected by reviewing medical records. The study protocol was approved by the in- stitutional review board at the Hanyang University Hospital.

Measurement of office blood pressure and 24-hour ambulatory blood pressure monitoring

Clinic BP was measured by a mercury sphygmomanome- ter, and defined as the average of at least 2 measurements re- corded 3 minutes apart. Five physicians were involved in the measurement of clinic BP. Standardization quality was not va- lidated. ABPM was recorded during a routine day by a TM- 2430 device (A&D, Saitama, Japan). The device was applied to the non-dominant arm for 24 hours. BP was measured every 15 minutes during daytime, and every 30 minutes at night- time. Patients were instructed to maintain their usual activi- ties during monitoring, and to stay calm when the device start- ed to work. Daytime and nighttime periods were defined in- dividually according to the patients’ self-reported data. As dis- played in Fig. 1, raw data were examined by a scatter plot and the regression slope of DBP on SBP was computed to obtain an AASI (1-slope).

3)

The average mean arterial pressure (AM- AP), SBP, DBP, pulse pressure (PP) and HR were calculated.

The SDs of SBP, DBP, PP and HR were also calculated as pa- rameters of BP and HR variability. Nocturnal dipping (%) is

defined by percent decrease in nocturnal systolic BP compar- ed to daytime systolic BP. When patients exhibited nocturnal dipping of less than 10%, they were defined as non-dippers.

Measurement of echocardiography

Echocardiograms were carried out using a HP Sonos 2500 (Hewlett-Packard, Santa Clara, CA, USA) machine equipped with a 2.5 MHz probe. Left ventricular mass index (LVMI)

10-12)

and relative wall thickness (RWT)

13)14)

are associated with ar- terial stiffness. We have examined LVMI and RWT to eluci- date the relationship between AASI and LV structural change due to arterial stiffness. Left ventricular mass (LVM) was cal- culated from 2D-guided M-mode echocardiographic mea- surement of the left ventricle. Measurement of the left ventri- cle internal dimension, interventricular septal thickness, and posterior wall thickness were made during diastole accord- ing to methods established by the American Society of Echo- cardiography. LVM was calculated using the Devereux equa- tion.

15)

LVMI was calculated by dividing LVM by height

2.7

to minimize effects of age, gender, ethnicity, and overweight status.

16)17)

RWT was calculated as the ratio of 2×(posterior wall thickness/end diastolic diameter) to assess the concentric LV remodeling.

18)

Statistical analysis

All data are presented as means±SDs. Statistical analyses were performed using Statistical Package for the Social Sci- ences (SPSS) (version 13.0; SPSS Inc., Chicago, IL, USA). A p<0.05 was considered statistically significant.

Student’s t-test was used for comparison of the measured values from the two groups divided according to sex and ac- cording to nocturnal BP dipping status. Pearson correlation coefficients between AASI and clinical parameters or 24 ho- ur-ABPM parameters were calculated.

Fig. 1. Derivation of the ambulatory arterial stiffness index (AASI) from a 24 hour ambulatory blood pressure recording.

140 120 100 80 60 40

Regression slope=0.81 AASI=1-slope AASI=0.19

Systolic blood pressure (mmHg)

D ia sto lic b lo od p re ss ur e ( m m H g)

60 80 100 120 140 160 180 200

(3)

Multiple linear regression analyses were performed to ad- just associated variables. Two multiple linear regression an- alysis models were used to estimate the independent corre- lation of AASI with clinical parameters and 24 hour-ABPM parameters. The first model included age, sex, height, wei- ght, LVMI, RWT, diabetes mellitus, lipid profile, and 24 ho- ur-ABPM parameters. Twenty-four hour ABPM parameters, included average MAP, average SBP, SD of SBP, average DBP, SD of DBP, average PP, SD of PP, average HR, SD of HR, and dipping status. In the second model, as another method to ad- just the BP level, we introduced coefficient of variation (CV).

CV was defined as the ratio of the SD to the mean. The crite- rion for entry into stepwise multiple linear regression analysis was p<0.05, while removal criterion was p>0.10.

Results

General characteristics of study subjects

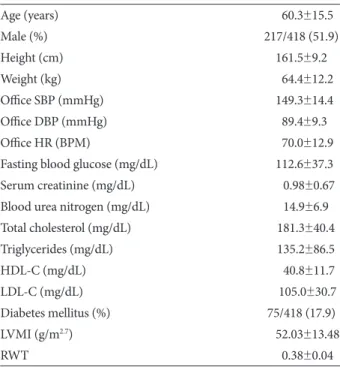
The clinical characteristics of the study population are sum- marized in Table 1. The mean (±SD) age of the subjects was 60.3±15.5, and proportion of male was 51.9%. The mean (±

SD) office SBP was 149.3±14.4 mmHg and the mean (±SD) office DBP was 89.4±9.3 mmHg.

The results of 24 hour ambulatory blood pressure monitoring

Twenty-four hour ABPM parameters of the study popula- tion are listed in Table 2. The mean (±SD) of average SBP was

144.5±13.9 mmHg, the mean (±SD) of average DBP was 84.2

±8.8 mmHg, and the mean (±SD) of average PP was 60.0±

10.7 mmHg. The proportion of non-dippers was 61.7%, and the mean (±SD) of AASI was 0.583±0.133.

Crude association between ambulatory arterial stiffness index and clinical parameters

AASI was not different between female and male (0.576±

0.126 vs. 0.589±0.139; p=0.311). Bivariate correlations of AA- SI with clinical parameters are listed in Table 3. AASI had sig- nificant correlation with age (R=0.189, p<0.001), RWT (R=

0.115, p=0.019), and LVMI (R=0.192, p<0.001).

Crude association between ambulatory arterial stiffness index and 24 hour ambulatory blood pressure monitoring parameters

AASI was significantly higher in non-dippers than in dip-

Table 1. Clinical characteristics of patients

Age (years) 0060.3±15.5

Male (%) 217/418 (51.9)

Height (cm) 161.5±9.2

Weight (kg) 0064.4±12.2

Office SBP (mmHg) 0149.3±14.4

Office DBP (mmHg) 089.4±9.3

Office HR (BPM) 0070.0±12.9

Fasting blood glucose (mg/dL) 0112.6±37.3

Serum creatinine (mg/dL) 00.0.98±0.67

Blood urea nitrogen (mg/dL) 0.14.9±6.9

Total cholesterol (mg/dL) 0.181.3±40.4

Triglycerides (mg/dL) 0.135.2±86.5

HDL-C (mg/dL) 00.40.8±11.7

LDL-C (mg/dL) 00105.0±30.7

Diabetes mellitus (%) 75/418 (17.9)

LVMI (g/m

2.7

) 0052.03±13.48

RWT 000.38±0.04

Data are reported as mean (±SD) or percentage. SBP: systolic blood pressure, DBP: diastolic blood pressure, HR: heart rate, BPM: beats per minute, HDL-C: high density lipoprotein-cholesterol, LDL-C: low density lipoprotein-cholesterol, LVMI: left ventricular mass index, RWT: relative wall thickness

Table 2. 24-hour ABPM parameters

Average SBP (mmHg) 144.5±13.9

Average DBP (mmHg) 84.2±8.8

Average PP (mmHg) 060.0±10.7

Average MAP (mmHg) 104.3±9.60

Average HR (BPM) 71.2±9.4

SD of SBP (mmHg) 19.8±5.2

SD of DBP (mmHg) 15.5±4.1

SD of PP (mmHg) 17.5±4.3

SD of HR (BPM) 10.3±3.3

CV for SBP 00.138±0.037

CV for DBP 00.186±0.051

CV for PP 00.298±0.082

Nocturnal dipping (%) 007.2±11.0

Non-dipper (%) 258/418 (61.7)

AASI 00.583±0.133

Data are reported as mean (±SD) or percentage. ABPM: ambulatory BP monitoring, SBP: systolic blood pressure, DBP: diastolic blood pressure, PP: pulse pressure, MAP: mean arterial pressure, HR: heart rate, BPM: beats per minute, SD: standard deviation, CV: coeffici- ent of variation, AASI: ambulatory arterial stiffness index Table 3. Bivariate correlation of AASI with clinical parameters Variable Pearson’s correlation coefficient p

Age (years) 0.189 <0.001

Height (cm) -0.054 0.279

Weight (kg) -0.002 0.962

Triglycerides (mg/dL) 0.067 0.210

HDL-C (mg/dL) -0.102 0.059

LDL-C (mg/dL) -0.014 0.800

RWT 0.115 0.019

LVMI 0.192 <0.001

AASI: ambulatory arterial stiffness index, HDL-C: high density li-

poprotein-cholesterol, LDL-C: low density lipoprotein-cholesterol,

RWT: relative wall thickness, LVMI: left ventricular mass index

(4)

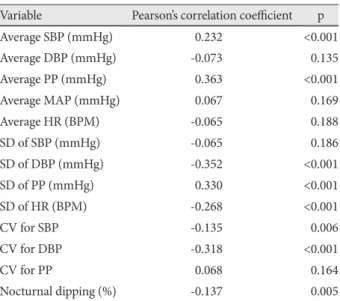
pers (0.602±0.133 vs. 0.552±0.128; p<0.001). Bivariate cor- relations of AASI with 24 hour ABPM variables are listed in Table 4. AASI had significant correlation with average SBP (R=0.232, p<0.001), average PP (R=0.363, p<0.001), SD of DBP (R=-0.352, p<0.001), SD of PP (R=0.330, p<0.001), SD of HR (R=-0.268, p<0.001), CV for SBP (R=-0.135, p=0.006), CV for DBP (R=-0.318, p<0.001), and nocturnal dipping (R=

-0.137, p=0.005) (Fig. 2).

Independent predictors of higher ambulatory arterial stiffness index

In the first model including age, sex, height, weight, LV-

MI, RWT, diabetes mellitus, lipid profile, average MAP, aver- age PP, SD of PP, average SBP, SD of SBP, average DBP, SD of DBP, average HR, SD of HR, and dipping status, statistically significant predictors of higher AASI were SD of PP (β=1.246, p<0.001), SD of DBP (β=-1.067, p<0.001), SD of SBP (β=

-0.197, p<0.001), and non-dipper status (β=0.054, p=0.033) (Table 5). In the second model including age, sex, height, weight, LVMI, RWT, diabetes mellitus, lipid profile, average MAP, CV for SBP, CV for DBP, CV for PP, average HR, SD of HR, and dipping status, statistically significant predictors of higher AASI included CV for PP (β=0.692, p<0.001), CV for DBP (β=-0.658, p<0.001), age (β=0.211, p<0.001), SD of HR (β=-0.217, p<0.001), non-dipper status (β=0.115, p=0.016), and diabetes mellitus (β=0.106, p=0.018) (Table 5).

Discussion

This study demonstrated that AASI is closely related with Table 4. Bivariate correlation of AASI with 24-hour ABPM param-

eters

Variable Pearson’s correlation coefficient p

Average SBP (mmHg) 0.232 <0.001

Average DBP (mmHg) -0.073 0.135

Average PP (mmHg) 0.363 <0.001

Average MAP (mmHg) 0.067 0.169

Average HR (BPM) -0.065 0.188

SD of SBP (mmHg) -0.065 0.186

SD of DBP (mmHg) -0.352 <0.001

SD of PP (mmHg) 0.330 <0.001

SD of HR (BPM) -0.268 <0.001

CV for SBP -0.135 0.006

CV for DBP -0.318 <0.001

CV for PP 0.068 0.164

Nocturnal dipping (%) -0.137 0.005

AASI: ambulatory arterial stiffness index, ABPM: ambulatory blood pressure monitoring, SBP: systolic blood pressure, DBP: diastolic blood pressure, PP: pulse pressure, MAP: mean arterial pressure, HR:

heart rate, BPM: beats per minute, SD: standard deviation, CV: co- efficient of variation

Table 5. Independent predictors of higher AASI in stepwise mul- tiple linear regression analysis models

Variable First model Second model

β p β p

Age (years) 0.019 0.451 0.211 <0.001

Male 0.017 0.492 0.047 0.306

Height (cm) 0.008 0.750 0.028 0.575

Weight (kg) 0.002 0.948 0.047 0.331

Diabetes mellitus 0.014 0.569 0.106 0.018 Triglycerides (mg/dL) 0.005 0.852 0.018 0.698

HDL-C (mg/dL) -0.011 0.657 0.014 0.758

LDL-C (mg/dL) 0.014 0.565 0.027 0.550

RWT -0.046 0.063 0.026 0.562

LVMI (g/m

2.7

) 0.034 0.170 0.046 0.320

Non-dipper 0.054 0.033 0.115 0.016

Average HR (BPM) -0.025 0.309 -0.046 0.331 SD of HR (BPM) -0.018 0.525 -0.217 <0.001

Average SBP (mmHg) 0.023 0.360 - -

SD of SBP (mmHg) -0.197 <0.001 - -

Average DBP (mmHg) 0.009 0.708 - -

SD of DBP (mmHg) -1.067 <0.001 - -

Average PP (mmHg) 0.020 0.447 - -

SD of PP (mmHg) 1.246 <0.001 - -

Average MAP (mmHg) 0.016 0.510 -0.036 0.450

CV for SBP - - 0.038 0.644

CV for DBP - - -0.658 <0.001

CV for PP - - 0.692 <0.001

AASI: ambulatory arterial stiffness index, HDL-C: high density li- poprotein-cholesterol, LDL-C: low density lipoprotein-cholesterol, RWT: relative wall thickness, LVMI: left ventricular mass index, HR:

heart rate, BPM: beats per minute, PP: pulse pressure, SD: standard deviation, MAP: mean arterial pressure, SBP: systolic blood pres- sure, DBP: diastolic blood pressure, CV: coefficient of variation Fig. 2. Correlation of ambulatory arterial stiffness index with noc-

turnal dipping.

0.90 0.80 0.70 0.60 0.50 0.40 0.30 0.20

n=418 R=-0.137 p=0.005

Nocturnal dipping (%)

Am bu lat or y a rte ria l s tiff ne ss in de x

-60.00 -40.00 -20.00 0.00 20.00 40.00

(5)

BP variability. Furthermore, AASI has a much stronger rela- tionship with BP variability than with BP itself. BP variabili- ty and BP is known to be relevant to the adverse consequ- ence of hypertension.

4-7)

These findings suggest that AASI reflects BP variability and arterial stiffness.

Mathematically, DBP variability is inversely correlated with AASI. After adjusting the associated variables, our results are consistent with this principle. Increased BP variability could potentially be caused by increased average BP. However, af- ter adjusting the average BP, BP variability was still an inde- pendent risk factor for higher AASI. This result suggests that AASI is closely related to BP variability.

In the first regression model, PP variability was a positive determinant of AASI after adjusting the PP. PP is one of the most important parameters for arterial stiffness. This result sug- gests that SD of PP may be a predictor for prognosis. We also documented that BP variability factors are stronger determi- nants of AASI than average BP. In the first model, SD of PP was the strongest independent predictor of higher AASI.

Considering that variability size is dependent on the mean value, CV appears to be a better indicator. In the second model, CV for PP and DBP, age, SD of HR, non-dipper, and diabetes mellitus were independent predictors. From these independent predictors, CV for PP was the strongest inde- pendent predictor of AASI. Thus, CV for PP or the SD of PP, which represents PP variability, is better related to AASI than PP itself, which is a well-known parameter of arterial stiffness.

In this study, AASI is significantly higher in non-dipper than in dipper, as demonstrated in a previous study. Non-dip- per is known to be associated with several conditions, includ- ing autonomic dysregulation and target organ damage.

19)20)

In addition, HR variability was independently and inversely correlated with AASI. HR variability is decreased in patients with autonomic dysfunction.

20)

Furthermore, a previous study had documented that reduced HR variability estimated by ABPM has prognostic significance for cardiovascular mor- tality.

6)

According to our study, there is a possibility that non- dipper or autonomic dysregulation may confound AASI in predicting cardiovascular outcome.

On the contrary, LVH is associated with arterial stiffness

10-12)

and with increased PP.

21-23)

In our study, LVMI was positively correlated with AASI in the crude relationship. However, in regression analysis models, the relationship between AASI and LVMI did not survived. Concentric left ventricular re- modeling is also associated with arterial stiffeness

13)14)

and with left ventricular pressure overload.

24)

RWT was positively correlated with AASI in the crude relationship. However, in the regression analysis model, RWT was not an independent predictor of AASI. These results imply that AASI have weak relationship with increased afterload resulted from arterial stiffness.

The finding that AASI has a weak correlation with PP and

with SBP in this study may be interpreted as AASI reflects dif- ferent aspects of arterial stiffness as measured by PP. It is con- sistent with the outcomes of a previous study that AASI was a significant predictor of stroke in a general population, after having adjusted for PP.

25)

PP is mainly affected by stroke volume and arterial elastici- ty, which determines both arterial compliance and wave re- flection.

26)

When symphathetic tone increases and parasym- phathetic nervous activity decreases, the variability of stroke volume rises.

27)

On the other hand, as arterial distending pres- sure increases, the elasticity decreases.

28)

Thus, increased st- roke volume might cause decreased elasticity, which causes both reduced arterial compliance and increased pulse wave velocity. Therefore, autonomic dysfunction, which increases stroke volume variability, may give rise to increased PP vari- ability.

We have demonstrated that AASI has much stronger rela- tionship with PP variability than with PP itself. Thus, we mig- ht speculate that AASI which is regarded as a parameter of ar- terial stiffness may reflect PP variability, autonomic nervous dysfunction, or increased sympathetic tone.

There are limitations in this study. First, we have not dem- onstrated a direct relationship between PP variability and autonomic cardiovascular regulation. Therefore, the relation- ship between PP variability and autonomic cardiovascular regulation remains conjectural. However, there is other evid- ence that AASI is affected by autonomic cardiovascular reg- ulation. According to our results, AASI is inversely correlat- ed with the SD of HR. HR variability decreases in patients with autonomic dysfunction.

20)

Furthermore, non-dipper was an independent predictor of higher AASI after adjusting cli- nical variables. These results support that AASI is affected by autonomic dysregulation. Second, pulse wave velocity, wh- ich is regarded as standard method to measure arterial stiff- ness, was not available in this study. Therefore, there is some limitation to demonstrate the relationship between AASI and arterial stiffness. However, we have suggested average PP, LVMI and RWT as parameters of arterial stiffness. Average PP, LVMI

10-12)

and RWT

13)14)

also represent arterial stiffness.

None of these parameters were independently associated with AASI. These results suggest that AASI have a weak relation- ship with arterial stiffness.

In conclusion, AASI is closely related to BP variability. This suggests that AASI is not only a parameter for arterial stiff- ness, but also a parameter for BP variability.

REFERENCES

1) Li Y, Wang JG, Dolan E, et al. Ambulatory arterial stiffness index derived from 24-hour ambulatory blood pressure monitoring. Hyper- tension 2006;47:359-64.

2) Dolan E, Thijs L, Li Y, et al. Ambulatory arterial stiffness index as a

predictor of cardiovascular mortality in the Dublin Outcome Study. Hy-

pertension 2006;47:365-70.

(6)

3) Dolan E, Li Y, Thijs L, et al. Ambulatory arterial stiffness index: ra- tionale and methodology. Blood Press Monit 2006;11:103-5.

4) Kikuya M, Ohkubo T, Metoki H, et al. Day-by-day variability of blo- od pressure and heart rate at home as a novel predictor of prognosis:

the Ohasama study. Hypertension 2008;52:1045-50.

5) Mancia G, Parati G, Hennig M, et al. Relation between blood pres- sure variability and carotid artery damage in hypertension: baseline data from the European Lacidipine Study on Atherosclerosis (ELSA).

J Hypertens 2001;19:1981-9.

6) Kikuya M, Hozawa A, Ohokubo T, et al. Prognostic significance of blood pressure and heart rate variabilities: the Ohasama study. Hy- pertension 2000;36:901-6.

7) Frattola A, Parati G, Cuspidi C, Albini F, Mancia G. Prognostic value of 24-hour blood pressure variability. J Hypertens 1993;11:1133-7.

8) Schillaci G, Parati G, Pirro M, et al. Ambulatory arterial stiffness in- dex is not a specific marker of reduced arterial compliance. Hypertens- ion 2007;49:986-91.

9) Baumann M, Dan L, Nurnberger J, Heemann U, Witzke O. Association of ambulatory arterial stiffness index and brachial pulse pressure is restricted to dippers. J Hypertens 2008;26:210-4.

10) Darne B, Girerd X, Safar M, Cambien F, Guize L. Pulsatile versus steady component of blood pressure: a cross-sectional analysis and a prospective analysis on cardiovascular mortality. Hypertension 1989;13:392-400.

11) Girerd X, Laurent S, Pannier B, Asmar R, Safar M. Arterial distensibi- lity and left ventricular hypertrophy in patients with sustained essen- tial hypertension. Am Heart J 1991;122:1210-4.

12) Rhee B, Park J, Kim H, et al. Increased aortic stiffness is associated with increased left ventricular mass and diastolic dysfunction. Kore- an Circ J 2005;35:525-32.

13) Shin J, Lee J, Lim H, Lee B, Kim M, Choi B. The relationship be- tween the pulse wave velocity (PWV) and the left ventricular geome- try: a community-based cross-sectional study. Korean Circ J 2005;35:

683-9.

14) Roman MJ, Ganau A, Saba PS, Pini R, Pickering TG, Devereux RB.

Impact of arterial stiffening on left ventricular structure. Hypertension 2000;36:489-94.

15) Devereux RB, Alonso DR, Lutas EM, et al. Echocardiographic assess- ment of left ventricular hypertrophy: comparison to necropsy findings.

Am J Cardiol 1986;57:450-8.

16) Daniels SR, Kimball TR, Morrison JA, Khoury P, Meyer RA. Index- ing left ventricular mass to account for differences in body size in chil-

dren and adolescents without cardiovascular disease. Am J Cardiol 1995;76:699-701.

17) de Simone G, Daniels SR, Devereux RB, et al. Left ventricular mass and body size in normotensive children and adults: assessment of al- lometric relations and impact of overweight. J Am Coll Cardiol 1992;20:1251-60.

18) Muscholl MW, Hense HW, Brockel U, Doring A, Riegger GA, Sc- hunkert H. Changes in left ventricular structure and function in pa- tients with white coat hypertension: cross sectional survey. BMJ 1998;

317:565-70.

19) Abate G, D’Andrea L, Battestini M, Zito M, Di Iorio A. Autonomic nervous activity in elderly dipper and non-dipper patients with es- sential hypertension. Aging (Milano) 1997;9:408-14.

20) Kohara K, Nishida W, Maguchi M, Hiwada K. Autonomic nervous function in non-dipper essential hypertensive subjects: evaluation by power spectral analysis of heart rate variability. Hypertension 1995;

26:808-14.

21) Park JS, Park CG, Park MY, et al. Relation of blood pressure compo- nents to left ventricular hypertrophy and coronary heart disease with aging. Korean Circ J 2004;34:142-50.

22) Khattar RS, Acharya DU, Kinsey C, Senior R, Lahiri A. Longitudi- nal association of ambulatory pulse pressure with left ventricular mass and vascular hypertrophy in essential hypertension. J Hypertens 1997;

15:737-43.

23) Pannier B, Brunel P, el Aroussy W, Lacolley P, Safar ME. Pulse pres- sure and echocardiographic findings in essential hypertension. J Hy- pertens 1989;7:127-32.

24) Grossman W, Jones D, McLaurin LP. Wall stress and patterns of hy- pertrophy in the human left ventricle. J Clin Invest 1975;56:56-64.

25) Hansen TW, Staessen JA, Torp-Pedersen C, et al. Ambulatory arterial stiffness index predicts stroke in a general population. J Hypertens 2006;

24:2247-53.

26) Dart AM, Kingwell BA. Pulse pressure: a review of mechanisms and clinical relevance. J Am Coll Cardiol 2001;37:975-84.

27) Akselrod S, Amitayt Y, Lang RM, Mor-Avi V, Keselbrener L. Spectral analysis of left ventricular area variability as a tool to improve the un- derstanding of cardiac autonomic control. Physiol Meas 2000;21:

319-31.

28) Gkaliagkousi E, Douma S. The pathogenesis of arterial stiffness and

its prognostic value in essential hypertension and cardiovascular dise-

ases. Hippokratia 2009;13:70-5.

수치

Fig. 1. Derivation of the ambulatory arterial stiffness index (AASI)  from a 24 hour ambulatory blood pressure recording.
Table 2. 24-hour ABPM parameters
Table 5. Independent predictors of higher AASI in stepwise mul- mul-tiple linear regression analysis models

참조

관련 문서

In this population arterial stiffness, which was known as an independent cardiovascular risk factor, was related to augmented seasonal variation of blood pressure. These

TyG = triglyceride glucose, CAN = cardiac autonomic neuropathy, HbA1c = glycated haemoglobin, SBP = systolic blood pressure, DBP = diastolic blood pressure, TC = total

BMI, body mass index; WC, waist circumference; VAT, visceral adipose tissue; TFM, total fat mass; SBP, systolic blood pressure; DBP, diastolic blood pressure; FSG, fasting

The aim of this study was to characterize the systolic blood pressure (SBP), diastolic pressure (DBP), pulse pressure (PP), glucose, creatine, and lipid profile.. This study

BSA: body surface area, SBP: systolic blood pressure, DBP: diastolic blood pres- sure, HR: heart rate, LVEDD: left ventricular end diastolic dimension, LVESD: left ventricular

BMI: body mass index, SBP: systolic blood pressure, DBP: diastolic blood pressure, TC: total cholesterol, HDL-C: high density lipoprotein cholesterol, LDL-C: low

Abbreviation: BMI, Body mass index; SBP, systolic blood pressure; DBP, diastolic blood pressure; TC, Total cholesterol; LDL, LDL-cholesterol; HDL, HDL-cholesterol; TG,

Effects of the early (EP) and late (LP) follicular phases of the menstrual cycle on changes (∆) in systolic blood pressure (SBP), diastolic blood pressure (DBP), mean arterial