J Clin Hypertens. 2021;23:85–95. wileyonlinelibrary.com/journal/jch
|
85 DOI: 10.1111/jch.14125O R I G I N A L P A P E R
Optimal combinations of systolic and diastolic blood pressure
in Korea: A nationwide population-based cohort study
Won-Jun Choi MD
1,2| Hye-Sun Lee PhD
3| Jung Hwa Hong MS
4|
Hyuk-Jae Chang MD, PhD
5| Ji-Won Lee MD, PhD
1Won-Jun Choi and Hye-Sun Lee contributed equally to this work. Hyuk-Jae Chang and Ji-Won Lee contributed equally to this work.
1Department of Family Medicine, Gangnam Severance Hospital, Yonsei University, Seoul, Korea
2Department of Medicine, Graduate School, Yonsei University, Seoul, Korea 3Biostatistics Collaboration Unit, Yonsei University College of Medicine, Seoul, Korea
4Institute of Health Insurance & Clinical Research, National Health Insurance Service Ilsan Hospital, Goyang, Republic of Korea
5Division of Cardiology, Severance Cardiovascular Hospital, Yonsei University College of Medicine, Yonsei University Health System, Seoul, Republic of Korea Correspondence
Hyuk-Jae Chang, MD, PhD, Department of Cardiology, Severance Cardiovascular Hospital, Yonsei University College of Medicine, 50-1, Yonsei-ro, Seodaemun-gu, Seoul 03722, Korea.
Email: [email protected]
Ji-Won Lee, MD, PhD, Family Medicine, Yonsei University College of Medicine Gangnam Severance Hospital, 211 Eonju-ro, Gangnam-gu, Seoul 06273, Korea.
Email: [email protected] Funding information
Ministry of Trade, Industry and Energy, Grant/Award Number: 20002781; Ministry of Science, ICT and Future Planning, Grant/Award Number: NRF-2018R1D1A1B07049223
Abstract
We investigated the optimal combinations of systolic blood pressure (SBP) and dias-tolic blood pressure (DBP) levels for lowest mortality in participants not taking hyper-tensive medication at the study baseline using nationwide representative databases. Survival rates and hazard ratios (HRs) were calculated using Kaplan-Meier curves and multivariable Cox regression analyses. The discriminatory ability for clinical outcomes was assessed by Harrell's C-index analysis. A survival spline curve was presented, and Classification and Regression Tree (CART) analysis was performed. SBP ≥ 140 group and DBP ≥ 90 group had the highest risk of mortality. Within SBP < 120, the HR (95% CIs) for all-cause mortality (ACM) was the lowest for DBP 70-79. Within SBP 120-139, the HR (95% CIs) for ACM was significantly lower for DBP 70-79. Within SBP ≥ 140, the HR (95% CIs) for ACM was significantly lower for DBP 80-89. Conversely, within SBP ≥ 140, DBP < 70 showed the highest risk for ACM. Similar relationships were observed when survival spline curves and CART analysis were used. The combination of SBP and DBP discriminated better than SBP or DBP alone for mortality. The effect of DBP on mortality varies according to the SBP range. It is more effective to evaluate the effect of SBP and DBP jointly for clinical outcomes.
This is an open access article under the terms of the Creative Commons Attribution-NonCommercial-NoDerivs License, which permits use and distribution in any medium, provided the original work is properly cited, the use is non-commercial and no modifications or adaptations are made.
1 | INTRODUCTION
Hypertension is a well-established major risk factor for cardio-vascular morbidity and mortality.1 Largely based on the results of SPRINT (Systolic Pressure Intervention Trial), the 2017 American College of Cardiology/American Heart Association (AHA/ACC) guideline changed the landscape for blood pressure (BP) control goals, with a new definition for hypertension starting at a BP of 130/80 mmHg.2 The new guideline additionally recommends an-tihypertensive medication for adults at high risk of cardiovascular disease (CVD) with SBP 130-139 mmHg or DBP 80-89 mmHg. This is supported by the recent large-scale systematic reviews and me-ta-analyses that intensive BP lowering is beneficial in reducing CV outcomes, especially for those with high CV risk.3 However, con-flicting reports still exist. Intensive BP lowering is associated with increased incidence of treatment-associated adverse events, and several studies suggest that achieving both SBP < 120 mmHg and DBP < 70 mmHg increases the risk of cardiovascular events.4 In ad-dition, strict BP lowering in the elderly was significantly associated with myocardial infarction and chronic heart failure.5,6 Unlike SBP, the J-curve phenomenon between low DBP and cardiovascular events has been reported.7
Most recent studies have independently examined the effects of SBP or DBP on clinical outcomes, and few studies have considered SBP and DBP levels concurrently. Therefore, we hypothesized that ideal combinations of SBP and DBP levels would differ according to BP level. We investigated the optimal combinations of SBP and DBP levels to decrease all-cause and cardiovascular mortality in middle-aged and elderly adults using nationwide representative da-tabases. To analyze long-term blood pressure control and its effects, we selected participants who were not diagnosed with hypertension and did not take hypertensive medication at the baseline of the study.
2 | METHODS
2.1 | Study population and data collection
This study used data obtained from the National Health Insurance System–National Health Screening Cohort (NHIS-HEALS), a na-tional retrospective cohort study conducted by the Korea Centers for Disease Control and Prevention. The NHIS is a universal health coverage program, and all insured individuals and their dependents are required to undergo general health examinations every 2 years. Study populations were followed from January 1, 2006, until the date of a cardiovascular event, death, or December 31, 2015, which-ever came first.
We extracted 1 021 208 participants whose data were avail-able and excluded individuals who met any of the following criteria: younger than 40 or older than 75 years of age; history of hospital-ization for a diagnosis of myocardial infarction (MI; Korean Standard Classification of Diseases, KCD codes I21-I23) or stroke (KCD codes I60-I64); any type of malignant cancer; death in the year of enroll-ment; single medical record after 2006; and those with missing SBP, DBP, or death data. Hypertension was defined as having a record of prescriptions for antihypertensive medications or diagnosis of hypertension (KCD codes I10-I13). Participants who had prescrip-tion records for antihypertensive medicaprescrip-tions were also excluded. Following these exclusions, 79 983 participants were included in the final analysis (Figure 1).
Blood pressure was measured at local hospitals and clinics, each of which met the internal and external quality control procedures of the Korean Association of External Quality Assessment Service. After 5 minutes of rest in the sitting position, BP measurements were taken by digital or automatic monitors during the health examination. If the SBP measurement was > 120 mmHg, or the DBP > 80 mmHg,
T A B LE 1 B as el in e c ha ra ct er is tic s a cc or di ng t o S B P a nd D B P D o n ot t ak e h yp er te ns io n m ed ic at io n ( n = 79 9 83 ) H yp er te nsio n (n = 2 3 89 8) p-V alue a SBP DB P To ta l <1 20 (n = 31 8 42 ) 12 0 ~ 12 9 (n = 2 7 31 1) 13 0 ~ 13 9 (n = 1 5 42 8) ≥1 40 ( n = 54 02 ) p-V alue a <7 0 (n = 1 4 84 5) 70 ~ 7 9 (n = 4 9 297 ) 80 ~ 8 9 (n = 3 4 38 6) ≥9 0 ( n = 53 53 ) p-V alue a A ge 48 .8 4 ± 7. 4 51 .1 2 ± 8. 33 53 .1 6 ± 9. 08 55 .5 8 ± 9. 69 <. 00 1 49 .4 1 ± 7. 95 50 .9 5 ± 8. 48 51 .6 ± 8 .6 1 51 .5 8 ± 8. 96 <. 00 1 50 .9 1 ± 8. 48 57 .8 5 ± 9. 17 <. 00 1 Fe m al e s ex , N (% ) 17 9 33 ( 56 .3 2) 11 0 71 ( 40 .5 4) 58 97 ( 38 .2 2) 20 18 ( 37 .3 6) <. 00 1 92 05 ( 68 .5 3) 18 8 09 ( 46 .9 8) 80 76 ( 34 .5 ) 82 9 ( 26 .7 5) <. 00 1 36 9 19 ( 46 .1 6) 10 8 87 ( 45 .5 6) .1 01 H ei gh t, m 2 16 1. 74 ± 8 .3 16 3. 19 ± 8 .7 162 .8 5 ± 8. 84 162 .1 1 ± 8. 89 <. 00 1 16 0. 08 ± 7 .8 2 162 .3 7 ± 8. 63 16 3. 75 ± 8 .6 9 16 4. 5 ± 8. 53 <. 00 1 162 .4 8 ± 8. 61 16 0. 99 ± 9 <. 00 1 W ei gh t, k g 60 .0 6 ± 9. 44 64 .1 4 ± 10 .1 4 65 .1 4 ± 10 .62 64 .9 9 ± 10 .7 7 <. 00 1 57 .8 1 ± 8. 67 62 .3 8 ± 9. 8 65 .6 7 ± 10 .4 8 67 .4 3 ± 11 .0 7 <. 00 1 62 .7 7 ± 10 .2 5 64 .8 2 ± 10 .5 4 <. 00 1 B M I, k g/ m 2 22 .8 9 ± 2. 61 24 .0 1 ± 2. 73 24 .4 8 ± 2. 87 24 .6 5 ± 3. 07 <. 00 1 22 .5 1 ± 2. 54 23 .5 9 ± 2. 72 24 .4 1 ± 2. 84 24 .8 4 ± 3. 06 <. 00 1 23 .6 9 ± 2. 82 24 .9 4 ± 3. 05 <. 00 1 Ph ys ic al a ct iv it y, N (% ) 0 16 0 11 ( 51 .7 4) 13 1 51 ( 49 .5 8) 75 03 ( 49 .9 8) 27 46 ( 52 .2 4) <. 00 1 69 12 ( 53 ) 19 8 34 ( 50 .9 6) 11 1 70 ( 49 .0 6) 149 5 (49 .6 7) <. 00 1 39 4 11 ( 50 37 ) 11 8 11 ( 50 .9 5) <. 00 1 1-2 87 03 ( 28 .1 2) 76 86 ( 28 .9 8) 42 84 ( 28 .5 4) 13 41 ( 25 .5 1) 34 76 ( 26 .6 5) 10 8 95 ( 27 .9 9) 67 68 ( 29 .7 2) 87 5 (2 9. 07 ) 22 0 14 ( 28 .3 2) 56 93 ( 24 .5 6) 3-4 38 13 ( 12 .3 2) 33 42 (1 2. 6) 18 22 ( 12 .1 4) 59 3 ( 11 .2 8) 16 02 ( 12 .2 8) 47 57 ( 12 .2 2) 28 61 ( 12 .5 7) 35 0 ( 11 .6 3) 95 70 ( 12 .3 1) 28 25 ( 12 .1 9) 5-6 90 1 ( 2. 91 ) 78 2 ( 2. 95 ) 42 3 ( 2. 82 ) 14 7 ( 2. 8) 38 8 ( 2. 98 ) 11 47 ( 2. 95 ) 62 0 ( 2. 72 ) 98 ( 3. 26 ) 22 53 ( 2. 9) 78 9 ( 3. 4) A lm os t ev er yd ay 15 18 ( 4. 91 ) 15 62 ( 5. 89 ) 98 1 ( 6. 53 ) 43 0 ( 8. 18 ) 66 3 ( 5. 08 ) 22 86 ( 5. 87 ) 13 50 ( 5. 93 ) 19 2 ( 6. 38 ) 44 91 ( 5. 78 ) 20 62 ( 8. 9) H ou seh old in co m e, N (% ) 1-2 47 75 ( 15 .21 ) 42 26 ( 15 .7 5) 25 97 (17 .0 7) 96 0 (17 .9 5) <. 00 1 20 80 ( 15 .6 4) 63 31 ( 16 .0 8) 36 67 ( 15 .9 2) 48 0 ( 15 .6 3) <. 00 1 12 5 58 ( 15 .9 4) 40 08 (17 ) <. 00 1 3-4 39 01 ( 12 .4 3) 34 14 ( 12 .7 3) 20 27 ( 13 .3 3) 80 5 ( 15 .0 6) 16 40 ( 12 .3 3) 51 09 ( 12 .9 7) 29 56 ( 12 .8 4) 44 2 ( 14 .3 9) 10 1 47 ( 12 .8 8) 31 18 (1 3. 23 ) 5-6 41 62 ( 13 .2 6) 39 41 ( 14 .6 9) 23 21 ( 15 .2 6) 96 5 ( 18 .0 5) 17 33 (1 3. 03 ) 56 62 ( 14 .3 8) 34 68 ( 15 .0 6) 52 6 (17 .1 2) 11 3 89 ( 14 .4 6) 3497 (1 4. 83 ) 7-8 70 29 ( 22 .3 9) 63 43 ( 23 .6 4) 26 09 ( 23 .7 3) 11 89 ( 22 .2 4) 28 24 ( 21 .2 4) 9187 (2 3. 33 ) 54 41 ( 23 .6 3) 71 8 ( 23 .3 7) 18 1 70 ( 23 .0 7) 53 73 ( 22 .7 9) 9-1 0 11 5 24 ( 36 .7 1) 89 03 ( 33 .1 9) 46 57 ( 30 .62 ) 14 28 ( 26 .7 1) 50 21 ( 37 .7 6) 13 0 88 ( 33 .2 4) 7497 (3 2. 55 ) 90 6 ( 29 .4 9) 26 5 12 ( 33 .6 5) 75 78 ( 32 .1 5) Sm ok er s, N (% ) 84 46 ( 27 .3 3) 927 7 ( 35 .0 5) 53 32 ( 35 .5 3) 18 84 ( 36 ) <. 00 1 27 43 ( 21 .0 9) 12 2 29 ( 31 .45 ) 86 58 ( 38 .1 1) 13 09 ( 43 .62 ) <. 00 1 24 9 39 ( 32 .1 3) 63 83 ( 27 .5 3) <. 00 1 A lc oh ol d rin ke rs , N (% ) N on -d rin ke r 19 3 06 ( 61 .8 5) 14 1 49 ( 52 .8 6) 78 24 ( 51 .5 9) 26 63 (5 0. 31 ) <. 00 1 90 53 ( 68 .7 9) 22 5 54 ( 57 .4 3) 11 1 12 ( 48 .3 7) 12 23 ( 40 .3 4) <. 00 1 43 9 42 ( 56 .0 2) 14 2 51 ( 60 .8 8) <. 00 1 Int er m it te nt dr in ke r 11 3 40 ( 36 .3 3) 11 7 16 ( 43 .7 7) 66 55 ( 43 .8 8) 22 94 ( 43 .3 4) 39 16 ( 29 .7 5) 15 5 98 ( 39 .7 2) 10 8 60 ( 47 .27 ) 16 31 ( 53 .7 9) 32 0 05 ( 40 .8 ) 82 09 ( 35 .0 7) D ai ly d rin ke r 56 8 ( 1. 82 ) 90 1 ( 3. 37 ) 68 8 ( 4. 54 ) 33 6 ( 6. 35 ) 19 2 ( 1. 46 ) 11 21 ( 2. 85 ) 10 02 ( 4. 36 ) 17 8 ( 5. 87 ) 24 93 (3 .1 8) 94 8 ( 4. 05 ) SB P, m m H g 11 1. 67 ± 1 0. 32 12 3. 89 ± 1 0. 31 13 3. 81 ± 1 1. 58 14 6. 61 ± 1 5. 3 <. 00 1 10 8. 68 ± 1 1 12 0. 14 ± 1 1. 98 13 1. 42 ± 13 .3 1 14 4. 77 ± 1 6. 28 <. 00 1 12 2. 47 ± 1 5. 22 13 3. 91 ± 1 7. 79 <. 00 1 D B P, m m H g 70 .7 1 ± 8. 04 77 .9 4 ± 8. 01 83 .2 4 ± 8. 85 89 .4 7 ± 10 .8 5 <. 00 1 66 .1 4 ± 6. 94 75 .1 6 ± 7. 44 83 .6 4 ± 8. 04 94 .1 5 ± 10 .4 3 <. 00 1 76 .8 6 ± 10 .2 3 82 .7 6 ± 11 .2 6 <. 00 1 Fa st in g G lu co se , m g/d l 92 .6 6 ± 20 .0 6 96 .4 9 ± 24 .6 1 98 .7 3 ± 25 .5 5 10 2. 28 ± 3 1. 14 <. 00 1 91 .7 8 ± 18 .9 3 95 .5 9 ± 24 .0 8 97 .8 4 ± 25 .0 5 10 0. 25 ± 2 6. 95 <. 00 1 95 .7 9 ± 23 .8 1 10 4. 24 ± 3 2. 85 <. 00 1 To ta l c ho le st er ol , m g/d l 19 3. 25 ± 3 5. 36 19 9. 4 ± 36 .1 2 20 2. 09 ± 3 6. 39 20 4. 22 ± 3 8. 15 <. 00 1 19 1. 62 ± 3 5. 52 19 7. 44 ± 3 6. 06 20 1. 18 ± 3 6. 22 20 3. 5 ± 37 .4 4 <. 00 1 19 7. 8 ± 36 .2 3 20 0. 37 ± 3 8. 17 <. 00 1 A ST , m g/ dl 24 .2 3 ± 15 .3 2 26 .2 4 ± 21 .4 4 27 .6 4 ± 32 .8 29 .1 9 ± 24 .1 5 <. 00 1 23 .7 ± 1 9. 05 25 .5 4 ± 24 .6 5 27 .2 4 ± 18 .0 4 30 .0 8 ± 31 .1 5 <. 00 1 25 .9 1 ± 22 .3 6 27 .4 8 ± 17 .8 3 <. 00 1 A LT , m g/ dl 22 .5 7 ± 20 .3 3 26 .1 1 ± 23 .1 2 27 .62 ± 3 5. 9 28 .21 ± 2 5. 79 <. 00 1 21 .1 1 ± 20 .8 6 24 .6 1 ± 27 .5 27 .7 1 ± 23 .4 9 29 .8 8 ± 26 .21 <. 00 1 25 .1 4 ± 25 .4 1 27 .2 ± 21 .3 7 <. 00 1 N ote : D at a a re e xp re ss ed a s t he m ea n ± SD o r f re qu en cy ( pe rc en ta ge ). A bb re vi at io ns : D B P, d ia st ol ic b lo od p re ss ur e; S B P, s ys to lic b lo od p re ss ur e. a p-V al ue s w er e c al cu la te d u si ng A N O VA , C hi -s qu ar e t es t.
BP was measured repeatedly. All BP measurements, including BP data before the index period, were used to calculate mean BP.
Self-reported physical activity, cigarette smoking, and alcohol consumption were determined from questionnaires. Physical activ-ity was divided into five groups: 0, 1-2, 3-4, 5-6, and “almost every day” according to the number of days of exercise during the week. Current smokers were classified as smokers. Alcohol drinkers were categorized as non-drinker, intermittent drinker (≤3-4 times a week), or daily drinker. Household income is divided into five groups based on decile data from the NHIS-HEALS dataset.
The study was approved by the Institutional Review Board of Yonsei University Health System (IRB number: 3-2018-0160), and the requirement for informed consent was waived.
2.2 | Outcome measurement
The primary outcomes of the study were all-cause mortality (ACM) and all cardiogenic mortality. All cardiovascular death (ACD) was de-fined as death from a disease of the circulatory system (KCD codes I00-I99). We selected MI (KCD codes I21-I23), hemorrhagic stroke (KCD codes I60-I62), and ischemic stroke (KCD code I63) among the detailed causes of cardiovascular mortality and named it as major cardiovascular death (MACE).
2.3 | Statistical analysis
Systolic blood pressure and DBP were classified into 4 groups. For SBP groups, <120, 120-129, 130-139, and ≥ 140 were categorized. For DBP groups, <70, 70-79, 80-89, and ≥ 90 were categorized. We
performed analyses of combinations of SBP and DBP, more specifi-cally by categorizing DBP groups within the same SBP group. For example, the SBP < 120 mmHg group was subdivided into 4 groups according to DBP as follows: SBP < 120/DBP < 70, SBP < 120/DBP 70-79, SBP < 120/DBP 80-89, and SBP < 120/DBP ≥ 90.
The characteristics of the study population were compared using one-way analysis of variance (ANOVA) for continuous variables and the chi-squared test for categorical variables, respectively.
The survival rates of each group according to the adjustment cri-teria presented in each BP group were analyzed by Kaplan-Meier curve and log-rank test. Hazard ratios (HRs) and 95% confidence intervals (CIs) were calculated according to BP levels using multi-variable Cox regression analysis after adjusting for age, sex, BMI, physical activity, household income, smoking status, alcohol status, fasting glucose, and total cholesterol.
Harrell's C-index analysis was performed to evaluate the discrim-ination ability of SBP, DBP, and combdiscrim-ination BP status. A survival spline curve was presented, and Classification and Regression Tree (CART) analysis was performed.
All statistical analyses were performed using SAS software, ver-sion 9.4 (SAS Institute Inc, Cary, NC, USA), which incorporates sam-ple weights and adjusts for the comsam-plex samsam-ple design of the survey. All statistical tests were two-sided, and statistical significance was determined at p < .05.
3 | RESULTS
Table 1 presents baseline characteristics according to SBP and DBP. At baseline in 2006, 23% (n = 23 898) of participants had a previous hypertension diagnosis and were taking antihypertensive
F I G U R E 2 Kaplan-Meier curves and log-rank test for all-cause death, all cardiovascular death, and major cardiovascular death according
medications, and 77% (n = 79 983) of participants had no hyper-tension history. There was a significant difference in all variables between participants taking antihypertensive medications or not. As SBP and DBP increased, participants not taking medication for hypertension at the study baseline tended to be older, men, current smokers, consumed more alcohol, had a higher BMI, and had higher fasting glucose, total cholesterol, and liver function enzymes.
Figure 2 shows the cumulative incidence of the three outcomes: ACM, ACD, and MACE (acute myocardial infarction, ischemic strokes, hemorrhagic strokes) according to BP using Kaplan-Meier curves and log-rank test. A total of 2549 ACM, 367 ACD, and 185 MACE events occurred during follow-up. There was a significant
linear trend toward an increased risk of all three outcomes, with worse SBP and DBP control. As a result, the SBP ≥ 140 and DBP ≥ 90 groups had the highest risk of mortality. Within the same SBP levels, we analyzed the risk of mortality according to DBP levels (Figure 3). For SBP 120-129, ACM was higher in the DBP ≥ 90 group. Within the SBP 130-139 and ≥ 140 groups, ACM was higher in the DBP < 70 group.
Tables 2, 3, and 4 show HRs (95% CIs) for ACM, ACD, and MACE according to separated SBP and DBP groups or combinations of SBP and DBP groups after adjusting for age, sex, BMI, physical activity, household income, smoking status, alcohol status, fasting glucose, and total cholesterol. Because SBP is more discriminating than DBP,
F I G U R E 3 Kaplan-Meier curves and log-rank test for all-cause death, all cardiovascular death, and major cardiovascular death according
we performed SBP and DBP combination analysis by categorizing DBP groups within the same SBP group.
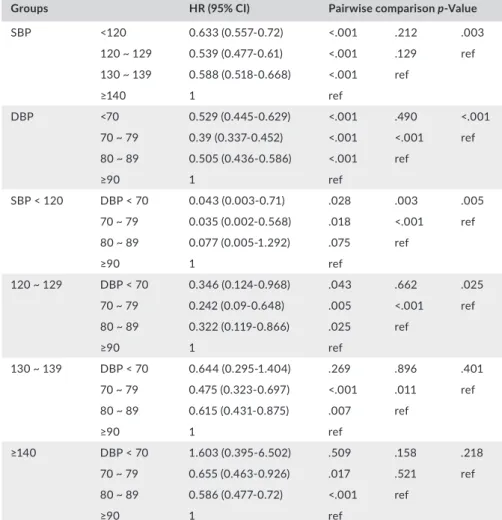
Table 2 shows the HRs (95% CIs) for ACM analysis. The HR (95% CIs) was highest for the SBP ≥ 140 and DBP ≥ 90 groups, and this trend was similar in ACD and MACE analyses. Similar relationships were ob-served when survival spline curves were used to treat SBP and DBP as continuous variables (Figure 4). SBP higher than 120 mmHg was asso-ciated with a risk for all three outcomes in a dose-responsive manner. Similarly, DBP higher than 70 mmHg gradually increased the risk of clinical outcomes. Within SBP < 120, the HR (95% CIs) for ACM was lowest in the DBP 70-79 group, followed by the DBP < 70, DBP 80-89, and DBP ≥ 90 groups. Within SBP 120-139, the HR (95% CIs) for ACM was significantly lower in the DBP 70-79 group. Within SBP ≥ 140, the HR (95% CIs) for ACM was significantly lower in the DBP 80-89 group. Conversely, within SBP ≥ 140, the DBP < 70 group showed the highest risk for ACM. In other words, the effect of DBP on ACM varies accord-ing to the range of SBP.
We observed a similar trend in ACD analysis. As for ACM, HRs (95% CIs) for ACD were highest for the SBP ≥ 140 and DBP ≥ 90 groups. Within the SBP < 120 and SBP 120-129 groups, the HRs
(95% CIs) for ACD were significantly lower in the DBP < 70 group. But within the SBP 130-139 and SBP ≥ 140 groups, the HRs (95% CIs) for ACD showed the lowest risk in the DBP 70-79 group. Consistent with the ACM analysis, the DBP < 70 group showed the highest risk for ACD within the SBP ≥ 140 group. (Table 3).
Table 4 shows HR (95% CIs) analysis for MACE. HRs (95% CIs) for MACE were highest for the SBP ≥ 140 and DBP ≥ 90 groups. The DBP 70-79 group showed the lowest HRs (95% CIs) for MACE in all SBP ranges. As in the two analyzes described above, the DBP < 70 group showed the highest risk for MACE within the SBP ≥ 140 group.
To evaluate the potential discriminatory ability of SBP, DBP, and SBP and DBP in combination for clinical outcomes, Harrell's C-indexes were calculated (Table 5). These results suggest that SBP alone and the combination of SBP and DBP are more discrim-inating than DBP alone in all three outcomes. In ACM analysis, the combination of SBP and DBP discriminated better than SBP alone. But in ACD and MACE analyses, there was no difference in discrimination ability between SBP alone and the combination of SBP and DBP.
Groups HR (95% CI) Pairwise comparison p-Value
SBP <120 0.633 (0.557-0.72) <.001 .212 .003 120 ~ 129 0.539 (0.477-0.61) <.001 .129 ref 130 ~ 139 0.588 (0.518-0.668) <.001 ref ≥140 1 ref DBP <70 0.529 (0.445-0.629) <.001 .490 <.001 70 ~ 79 0.39 (0.337-0.452) <.001 <.001 ref 80 ~ 89 0.505 (0.436-0.586) <.001 ref ≥90 1 ref SBP < 120 DBP < 70 0.043 (0.003-0.71) .028 .003 .005 70 ~ 79 0.035 (0.002-0.568) .018 <.001 ref 80 ~ 89 0.077 (0.005-1.292) .075 ref ≥90 1 ref 120 ~ 129 DBP < 70 0.346 (0.124-0.968) .043 .662 .025 70 ~ 79 0.242 (0.09-0.648) .005 <.001 ref 80 ~ 89 0.322 (0.119-0.866) .025 ref ≥90 1 ref 130 ~ 139 DBP < 70 0.644 (0.295-1.404) .269 .896 .401 70 ~ 79 0.475 (0.323-0.697) <.001 .011 ref 80 ~ 89 0.615 (0.431-0.875) .007 ref ≥90 1 ref ≥140 DBP < 70 1.603 (0.395-6.502) .509 .158 .218 70 ~ 79 0.655 (0.463-0.926) .017 .521 ref 80 ~ 89 0.586 (0.477-0.72) <.001 ref ≥90 1 ref
Note: Adjusted for age, sex, BMI, physical activity, household income, smoking status, alcohol
status, fasting glucose, total cholesterol.
Abbreviations: DBP, diastolic blood pressure; SBP, systolic blood pressure.
TA B L E 2 Hazard ratios for all-cause
According to the result of Harrell's C-indexes, we performed CART analysis, considering the joint effects of SBP and DBP simul-taneously for the lowest mortality (Figure 5). In ACM analysis, re-gardless of DBP, the SBP < 120 group had low risk and SBP ≥ 140 had high risk. Prognosis was poor in the SBP 120-129 group when DBP was < 70 and ≥ 90, and in the SBP 130-139 group when DBP was < 70. In the ACD analysis, as in the ACM analysis, the SBP < 120 group had low risk and SBP ≥ 140 had high risk regardless of DBP. The SBP 120-129 group showed poor prognosis with DBP ≥ 90, and SBP 130-139 showed poor prognosis with DBP < 70 and ≥ 90. In MACE analysis, there was no cut-off value of poor prognosis in SBP < 120, 120-129, and 130-139. Poor prognosis in the SBP ≥ 140 group was when DBP < 70.
4 | DISCUSSION
The 2017 ACC/AHA guideline emphasized strict BP control and recommended to reduce SBP/DBP < 130/80 mmHg.2 The 2018 European Society of Cardiology/European Society of Hypertension
(ESC/ESH) guidelines maintain the diagnostic threshold of hy-pertension at 140/90 mmHg and redefined office BP treatment targets according to age stratification and CV risk profiles.8 It is still unknown whether excessive BP reduction results in improved clinical outcomes. Previous studies did not account for the com-plex relationships between BP components and mortality. We ex-amined the effects of SBP and DBP on mortality simultaneously, rather than assessing each BP component separately. Although high BP (SBP ≥ 140 and DBP ≥ 90) has a poor prognosis and is consistent with the results of previous experiments, prognosis was poor in the SBP 120-129 group when DBP was < 70 and ≥ 90, and in the SBP 130-139 group when DBP was < 70. In addition, the lowest risk of DBP was 70-79, not < 70, with a J-shape in the spline curve analysis, meaning it is more effective and appropriate to evaluate the effect of SBP and DBP jointly in clinical outcomes. This is supported by our Harrell's C-index analysis, and the com-bination analysis showed higher discrimination ability than that of SBP or DBP alone.
Previous studies have shown similar results. Glynn et al (2000) showed the lowest mortality at SBP ≤ 130 and DBP 80-90, and
Groups HR (95% CI) Pairwise comparison p-Value
SBP <120 0.301 (0.215-0.42) <.001 .152 .136 120 ~ 129 0.381 (0.286-0.507) <.001 .954 ref 130 ~ 139 0.384 (0.284-0.52) <.001 ref ≥140 1 ref DBP <70 0.155 (0.093-0.258) <.001 <.001 .0914 70 ~ 79 0.229 (0.165-0.318) <.001 <.001 ref 80 ~ 89 0.372 (0.269-0.513) <.001 ref ≥90 1 ref SBP < 120 DBP < 70 0.003 (0.001-0.059) <.001 .004 .087 70 ~ 79 0.005 (0.001-0.095) <.001 .033 ref 80 ~ 89 0.013 (0.001-0.315) .007 ref ≥90 1 ref 120 ~ 129 DBP < 70 0.142 (0.016-1.296) .084 .163 .931 70 ~ 79 0.149 (0.02-1.093) .061 .001 ref 80 ~ 89 0.298 (0.04-2.199) .235 ref ≥90 1 ref 130 ~ 139 DBP < 70 0.257 (0.031-2.103) .205 .882 .952 70 ~ 79 0.241 (0.104-0.562) .001 .421 ref 80 ~ 89 0.299 (0.14-0.639) .002 ref ≥90 1 ref ≥140 DBP < 70 3.255 (0.441-24.012) .247 .085 .077 70 ~ 79 0.487 (0.215-1.104) .085 .719 ref 80 ~ 89 0.564 (0.366-0.87) .010 ref ≥90 1 ref
Note: Adjusted for age, sex, BMI, physical activity, household income, smoking status, alcohol
status, fasting glucose, total cholesterol.
Abbreviations: DBP, diastolic blood pressure; SBP, systolic blood pressure.
TA B L E 3 Hazard ratios for all
cardiovascular death according to blood pressure groups
the highest mortality at SBP > 160 and DBP < 70.9 In a recent study, patients with atrial fibrillation (AF) undergoing hypertension treatment showed a U-shaped relationship of major cardiovascu-lar events, with SBP 120-129 and DBP < 80 mmHg as the optimal BP treatment target.10 Several studies suggested that 70 mmHg was the optimal DBP target and an increased risk of death for DBP ≤ 70 mmHg, especially in the elderly.11,12 Recently, our group found that participants in the DBP < 70 mmHg group who took hy-pertension drugs had a high risk of mortality regardless of SBP sta-tus, and the highest mortality was observed in the DBP < 70 mmHg and SBP ≥ 140 mmHg groups.13
Although the precise mechanism for the relationship between SBP, DBP, and mortality remains unknown, this could be partly ex-plained by pulse pressure (PP). PP is higher due to the tendency of SBP to increase and DBP to decrease with age, which is attributed to a loss of arterial wall elasticity and arterial stiffness.14 Apart from high BP, wide PP is also known to increase cardiovascular or all-cause mortality.15 The association between PP and CVD incidence was previously reported by Blacher et al, in which hypertensive
patients had a 17% increased risk of CVD per 10 mmHg higher PP.16 However, PP alone, without appropriate attention to SBP and DBP components, is an inadequate risk indicator for prognos-tic and therapeuprognos-tic decisions.17 Increasing PP by increasing SBP was consistently associated with increased risk, while increasing PP by decreasing DBP could be associated with increased risk, de-creased risk, or no change in risk depending on age and BP level.17 Similarly in our results, for a fixed DBP, increasing PP by increasing SBP was associated with higher mortality, while decreasing PP by increasing DBP above 90 mmHg increased risk for death. Overall, our observations emphasize that PP in conjunction with SBP and DBP might be effective to identify patients at high risk of CVD and all-cause mortality. Future clinical studies are needed to validate these findings.
There are some limitations in this study. First, because the current study was an observational study, potentially unmea-sured confounding factors could overestimate or underestimate the impact of BP on clinical outcomes. Second, although BP-measuring equipment of all health examination institutions is
Groups HR (95% CI) Pairwise comparison p-Value
SBP <120 0.197 (0.121-0.319) <.001 .120 .023 120 ~ 129 0.335 (0.229-0.489) <.001 .540 ref 130 ~ 139 0.294 (0.193-0.447) <.001 ref ≥140 1 ref DBP <70 0.08 (0.034-0.191) <.001 .001 .02 70 ~ 79 0.211 (0.136-0.327) <.001 .004 ref 80 ~ 89 0.344 (0.224-0.53) <.001 ref ≥90 1 ref SBP < 120 DBP < 70 0.001 (0.001-0.011) <.001 .005 .029 70 ~ 79 0.001 (0.001-0.035) <.001 .098 ref 80 ~ 89 0.004 (0.001-0.136) .002 ref ≥90 1 ref 120 ~ 129 DBP < 70 0.264 (0.013-5.467) .389 .760 .504 70 ~ 79 0.179 (0.01-3.106) .238 .042 ref 80 ~ 89 0.316 (0.018-5.533) .431 ref ≥90 1 ref 130 ~ 139 DBP < 70 0.358 (0.016-8.042) .518 .995 .972 70 ~ 79 0.34 (0.094-1.225) .099 .873 ref 80 ~ 89 0.361 (0.112-1.162) .088 ref ≥90 1 ref ≥140 DBP < 70 2.814 (0.155-51.063) .484 .270 .212 70 ~ 79 0.4 (0.126-1.276) .122 .582 ref 80 ~ 89 0.552 (0.315-0.967) .038 ref ≥90 1 ref
Note: Adjusted for age, sex, BMI, physical activity, household income, smoking status, alcohol
status, fasting glucose, total cholesterol.
Abbreviations: DBP, diastolic blood pressure; SBP, systolic blood pressure.
TA B L E 4 Hazard ratios for major
cardiovascular death according to blood pressure groups
quality-qualified according to the Basic Act on National Health Examination, a lack of device uniformity and single visit mea-surements may have caused slight variability within results. However, recent guidelines have advocated that single visit mea-surements with automatic office-based devices represent a less
resource-intensive yet equally or more precise measurement of BP than multiple clinic visits.18 Third, our study participants are all Korean adults, so the results may not be generalized to other races or ethnic groups. Fourth, some of the 16 categories had small sample and event sizes, potentially limiting their statis-tical accuracy. Further research is needed with a larger sample size. Nevertheless, this study has several strengths. We used a large-scale Asian cohort in a real-world setting from the National Health Insurance System–National Health Screening Cohort (NHIS-HEALS), a reliable large national data set sampled from most adult health insurance subscribers in Korea. We also used various statistical approaches to adjust for multiple types of bias and improve the accuracy of predictive survival models with SBP and DBP in combination.
Taken together, the results are summarized as follows. High BP (SBP ≥ 140 and DBP ≥ 90) has a poor prognosis and is con-sistent with the results of previous experiments. However, lower BP does not always yield a better prognosis. With SBP 130 as the boundary, high DBP with lower SBP, and low DBP with higher SBP, showed high risk for mortality. In particular, the lowest DBP (<70) had a worse prognosis than other groups with the highest SBP. This study used a statistical model to examine a new perspective using a statistical model. If clinical research supports these find-ings, primary care providers may consider the optimal combina-tion of SBP and DBP, rather than SBP or DBP alone, in clinical decision-making.
F I G U R E 4 Survival spline curve for all-cause mortality, all cardiovascular death, and major cardiovascular death according to blood
pressure (BP) groups
TA B L E 5 Discrimination ability for all-cause death, all
cardiovascular death and major cardiovascular death according to systolic blood pressure
ACM C-index (95% CI)
Pairwise comparison P-value SBP 0.581(0.568-0.593) ref DBP 0.542(0.529-0.553) <0.001 ref SBP + DBP 0.588(0.576-0.6) 0.008 <0.001 ACD SBP 0.668(0.636-0.7) ref DBP 0.628(0.601-0.659) <0.001 ref SBP + DBP 0.667(0.635-0.7) 0.739 0.003 MACE SBP 0.7(0.661-0.739) ref DBP 0.659(0.617-0.739) 0.008 ref SBP + DBP 0.699(0.662-0.737) 0.617 0.012
Abbreviations: ACD, all cardiovascular death; ACM, all causes mortality; C-index, Concordance-index; MACE, major cardiovascular death.
ACKNOWLEDGEMENTS
This work was supported by the Bio and Medical Technology Development Program (NRF-2018R1D1A1B07049223) through the National Research Foundation of Korea funded by the Ministry of Science, ICT, and Future Planning (MSIP, Korea); and the Technology Innovation Program (20002781, A Platform for Prediction and Management of Health Risk Based on Personal Big Data and Lifelogging) funded by the Ministry of Trade, Industry & Energy (MOTIE, Korea).
CONFLIC T OF INTEREST
The authors declare no conflicts of interest. AUTHOR CONTRIBUTIONS
WJC, HSL, HJC, and JWL contributed to conceptualization. HSL contributed to methodology. HSL contributed to software. WJC and HSL contributed to validation. HSL and JWH contributed to formal analysis. WJC and HSL contributed to investigation. JWL contrib-uted to resources and data curation. WJC and HSL contribcontrib-uted to
F I G U R E 5 Classification and Regression Tree analysis of the joint effects of SBP and DBP. DBP, diastolic blood pressure; SBP, systolic
writing—original draft preparation. HJC and JWL contributed to writing—review and editing. JWH contributed to visualization. HJC and JWL contributed to supervision. HJC and JWL contributed to project administration. JWL contributed to funding acquisition. FUNDING INFORMATION
Ji-Won Lee has received two grants from the Bio and Medical Technology Development Program (NRF-2018R1D1A1B07049223) through the National Research Foundation of Korea funded by the Ministry of Science, ICT, and Future Planning (Korea); and the Technology Innovation Program (20002781, A Platform for Prediction and Management of Health Risk Based on Personal Big Data and Lifelogging) funded by the Ministry of Trade, Industry & Energy (MOTIE, Korea). For the remaining authors no other support sources were declared.
ORCID
Hye-Sun Lee https://orcid.org/0000-0001-6328-6948
Ji-Won Lee https://orcid.org/0000-0002-2666-4249
REFERENCES
1. Nwankwo T, Yoon SS, Burt V, Gu Q. Hypertension among adults in the United States: National Health and Nutrition Examination Survey, 2011–2012. NCHS Data Brief. 2013;133:1-8.
2. Whelton PK, Carey RM, Aronow WS, et al. 2017 ACC/AHA/AAPA/ ABC/ACPM/AGS/APhA/ASH/ASPC/NMA/PCNA guideline for the prevention, detection, evaluation, and management of high blood pressure in adults: executive summary: a report of the American College of Cardiology/American Heart Association Task Force on Clinical Practice Guidelines. Circulation. 2018;138(17):e426-e483.
3. Reboussin DM, Allen NB, Griswold ME, et al. Systematic review for the 2017 ACC/AHA/AAPA/ABC/ACPM/AGS/APhA/ASH/ASPC/ NMA/PCNA guideline for the prevention, detection, evaluation, and management of high blood pressure in adults: a report of the American College of Cardiology/American Heart Association Task Force on Clinical Practice Guidelines. Circulation. 2018;138(17):e59 5-e616.
4. Bohm M, Schumacher H, Teo KK, et al. Achieved blood pres-sure and cardiovascular outcomes in high-risk patients: re-sults from ONTARGET and TRANSCEND trials. Lancet. 2017;389(10085):2226-2237.
5. Res H. Principal results of the Japanese trial to assess optimal systolic blood pressure in elderly hypertensive patients (JATOS).
Hypertens Res. 2008;31(12):2115-2127.
6. Ogihara T, Saruta T, Matsuoka H, et al. Valsartan in elderly iso-lated systolic hypertension (VALISH) study: rationale and design.
Hypertens Res. 2004;27:657-661.
7. Lip S, Tan LE, Jeemon P, McCallum L, Dominiczak AF, Padmanabhan S. Diastolic blood pressure J-curve phenomenon in a tertiary-care hypertension clinic. Hypertension. 2004;27(9):657-661.
8. Williams B, Mancia G, Spiering W, et al. 2018 ESC/ESH guide-lines for the management of arterial hypertension. Eur Heart J. 2018;39(33):3021-3104.
9. Sesso HD, Stampfer MJ, Rosner B, et al. Systolic and diastolic blood pressure, pulse pressure, and mean arterial pressure as predictors of cardiovascular disease risk in men. Hypertension. 2000;36(5):801-807.
10. Kim T-H, Yang P-S, Yu HT, et al. Effect of hypertension duration and blood pressure level on ischaemic stroke risk in atrial fibrillation: nationwide data covering the entire Korean population. Eur Heart J. 2019;40(10):809-819.
11. Protogerou AD, Safar ME, Iaria P, et al. Diastolic blood pressure and mortality in the elderly with cardiovascular disease. Hypertension. 2007;50(1):172-180.
12. Somes GW, Pahor M, Shorr RI, Cushman WC, Applegate WB. The role of diastolic blood pressure when treating isolated systolic hy-pertension. Arch Intern Med. 1999;159(17):2004-2009.
13. Yun D-H, Lee H-S, Choi W-J, Chang H-J, Son D-H, Lee J-W. Association of optimal blood pressure with mortality in pa-tients taking antihypertensive medications. J Clin Hypertens. 2020;00:1-9.
14. Dart AM, Kingwell BA. Pulse pressure—a review of mechanisms and clinical relevance. J Am Coll Cardiol. 2001;37(4):975-984. 15. Domanski M, Mitchell G, Pfeffer M, et al. Pulse pressure and
cardiovascular disease–related mortality: follow-up study of the Multiple Risk Factor Intervention Trial (MRFIT). JAMA. 2002;287(20):2677-2683.
16. Blacher J, Staessen JA, Girerd X, et al. Pulse pressure not mean pressure determines cardiovascular risk in older hypertensive pa-tients. Arch Intern Med. 2000;160(8):1085-1089.
17. Pastor-Barriuso R, Banegas JR, Damin J, Appel LJ, Guallar E. Systolic blood pressure, diastolic blood pressure, and pulse pres-sure: an evaluation of their joint effect on mortality. Ann Intern Med. 2003;139(9):731-739.
18. Boonyasai RT, McCannon EL, Landavaso JE. Automated of-fice-based blood pressure measurement: an overview and guid-ance for implementation in primary care. Curr Hypertens Rep. 2019;21(4):29.
How to cite this article: Choi WJ, Lee HS, Hong JH, Chang HJ, Lee JW. Optimal combinations of systolic and diastolic blood pressure in Korea: A nationwide population-based cohort study. J Clin Hypertens. 2021;23:85–95.