311
혈중 납이 비흡연자들의 혈압에 미치는 영향
박윤숙· 박상신*·김태훈**·이상윤***·고영림****·이은희*****† 국립중앙의료원 중앙응급의료센터,
*Department of Veterinary Integrative Biosciences, College of Veterinary Medicine and Biomedical Sciences, Texas A&M University, **서울대학교 보건대학원 및 보건환경연구소,
***강원대학교 예방의학교실 및 인제대학교 해운대 백병원, ****을지대학교 보건환경안전학과,
*****극동대학교 안경광학과 및 보건과학대학원
The Effects of Blood Lead on Blood Pressure Among Non-smokers
Yun-Suk Pak, Sangsin Park*, Taehun Kim**, Sangyoon Lee***, Younglim Kho****, and Eun-Hee Lee*****†
The National Emergency Medical Center, National Medical Center, Daegu, Korea
*Department of Veterinary Integrative Biosciences, College of Veterinary Medicine and Biomedical Sciences, Texas A&M University, Texas, USA
**Graduate School of Public Health & Institute of Health and Environment, Seoul National University, Seoul, Korea
***Department of Preventive Medicine, Kangwon National University, Chuncheon and Occupational &
Environmental Medicine, Haeundae Paik Hosiptal, Inje University, Pusan, Korea
****Department of Health, Environment and Safety, Eulji University, Seongnam, Korea
*****Department of Visual Optics and Graduate School of Health Sciences, Far East University, Chungbuk, Korea
ABSTRACT
Objective: The effect of lead on blood pressure remains controversial in spite of the numerous studies which have been conducted in the recent years. The aim of this study was to evaluate the effects of exposure to lead on blood pressure among non-smokers.
Methods: In this cross sectional study, 1416 male and female non-smokers were enrolled, aged 20 years or older, from the Korean National Health and Nutrition Examination Survey 2008. Blood pressure, blood lead levels (BLLs), height, weight, and cotinine level were measured for all subjects.
Results: Geometric mean BLLs of the participants was 2.20 µg/dl. BLLs were higher in the older, male, and lower education groups than the younger, female and higher education groups. After adjusting for age, sex, education and BMI through multiple regression analysis, a significant positive association between systolic blood pressure (p = 0.0357), diastolic blood pressure (p = 0.0111) and BLLs. Also, among the normal BMI group (18.5 kg/m2 < BMI < 25 kg/m2), we also found a significant positive association between diastolic blood pressure and BLLs (p = 0.0370).
Conclusion: The present study showed that blood lead serves as a good predictor of blood pressure changes and that there was a statistically significant association between blood lead and blood pressure, especially diastolic blood pressure.
Keywords: blood lead level, blood pressure, diastolic blood pressure, non-smokers
†Corresponding author: Graduate School of Health Science, Far East University, Eumsung 369-700, Korea, Tel: +82- 43-879-3701, Fax: +82-43-879-3730, E-mail: [email protected]
Received: 4 June 2012, Revised: 12 July 2012, Accepted: 9 August 2012
I. 서 론
납은 주로 자동차 배기가스와 납 제련, 축전지 제 조, 인쇄업 등의 여러 산업장을 통해 배출되며 공기, 물, 토양, 분진, 음식물, 농작물 등 환경에 광범위하 게 존재하여 일상생활을 통하여도 노출이 될 수 있 다.1-3)지난 수 십 년 동안 납과 건강영향에 대한 연 구는 꾸준히 되어 왔고, 체내에 축적된 납은 빈혈, 신장손상, 복통 등 여러 질병을 야기하는 것으로 밝 혀졌다. 어린이의 경우 혈중 납 수준이 25 µg/dl 이 하의 농도에서 언어 발달이 지연되거나 집중력이 감 소하며,4) 10µg/dl 미만에서도 신경계 발달에 영향을 미친다고 한다.5)성인의 경우 저수준 노출에서도 신 장기능이나 혈압증가와 관련이 있다고 하였다.6)
최근 납과 건강과의 연관성을 본 연구들에서, 산 업장에서 납에 노출되는 근로자들에게서 납 노출은 심혈관계질환, 특히 혈압의 변화를 가져온다고 주장 하고 있다.7,8)
환경 중 납 노출은 매우 낮은 수준이기 때문에 고 농도로 노출되는 근로자들에 비해 낮은 것이 사실이 지만 혈중 납 증가는 신기능저하, 혈압상승7,9)등 저 농도에서도 건강영향이 있다고 보고되고 있다. 그러 나 역학연구를 통해 일반인구에서 저 농도 납 노출 과 혈압과의 연관성 관계는 아직 논란이 되고 있 다. 혈중 납과 혈압간의 강한 연관성이 있다고 보고 한 연구가 있는 반면에, 통계적으로 유의하지 않다 고 보고를 하거나,8)오히려 음의 상관관계가 나타난 다고 보고하는 연구들도 있다.
한편, 우리나라의 경우도 대부분 납과 혈압과의 연 관성 연구들을 해왔다. 그러나 주로 산업체 근로자 를 대상으로 수행되어10,11) 건강한 정상인의 납 노출 과 관련된 건강영향 연구는 미흡한 실정이다. 최근 학위논문으로 혈중 납과 수축기 혈압과의 양의 연관 성이 있다고 한 역학연구가 발표되었으나,12)대상이 서울시 일부 사무직 근로자들과 가족들로 한정되어 있다. 때문에 환경적 노출로 저 농도에서 노출되는 일반인구를 대상으로 혈중 납과 혈압과의 연관성을 본 연구가 필요하다고 생각되었다. 그러나 혈중 납 이나 혈압에 영향을 주는 요인들이 다양하게 존재하 므로 최대한 혼란요인을 줄이고자, 혈중 납과 혈압 에 영향을 주는 요인 중 주요 요인을 제거한 후 혈 중 납과 혈압과의 연관성을 밝히고자 하였다. 따라
서 혈중 납에 영향을 주는 흡연 요인과 혈압에 영 향을 줄 수 있는 비만요인을 배재한 후에도 혈중 납 과 혈압과 연관성이 있는지 알아보고자 했다. 이를 위해 본 연구는 일반인구 중 비흡연자들의 혈중 납 과 혈압이 어떠한 연관성이 있는지 밝히고자 한다.
II. 대상 및 방법 1. 연구대상
본 연구는 제 4기 국민건강영양조사에 참여한 성 인들 중 혈중 납 검사를 시행한 사람들을 대상으로 분석하였다. 국민건강영양조사의 기본 대상자는 인 구주택총조사 조사구를 모집단으로 하여 전국단위로 추출된 표본인구집단이다. 2008년도 국민건강영양조 사에 응하여, 혈압을 측정하고 혈중 납 검사를 시행 한 대상자는 총 2005명이었다.
이 중 Zielinska-Danch 등13)이 제시한 비흡연자 코 티닌 기준을 채택하여, 뇨 중 코티닌이 50 ng/ml 미 만인 사람들을 비흡연자로 정의하고, 20대 이상 비 흡연자들 1416명을 최종 연구대상자로 선택하였다.
연령은 조사시점의 만 나이를 기록하였고, 교육수 준은 초등학교 이하, 중학교, 고등학교, 전문대학 이 상으로 나누어 응답하도록 하였다.
혈압과 비만과 연관성이 높으므로 그룹에서 허리 둘레, HDL-콜레스테롤, 공복 시 혈당, 중성지방을 보정 한 후에도 혈중 납과 혈압과 관련성을 살펴보 았다.
또한 BMI를 기준으로 정상(18.5 kg/m2 ≤ BMI ≤ 25 kg/m2)인 그룹(n = 909, 64.2%)에서 다른 비만 요 인인 허리둘레, HDL-콜레스테롤, 공복 시 혈당, 중 성지방을 보정 한 후에도 혈중 납과 혈압과 관련성 을 살펴보았다.
2. 측정방법
연구대상자들의 키와 몸무게를 이용하여 체중(kg) 을 키(m)의 제곱근으로 나눈 Body mass index(BMI) 로 환산하였다.
혈압을 측정하기 위해서, 피검자는 5분 정도 휴식 을 취하고 혈압 측정 30분전에 흡연을 하지 않았는 지 확인을 하였다. 3번에 걸쳐서 혈압 측정을 실시 하였고, 그 중 2번째와 3번째 혈압 측정값을 통해 평균을 구하여 그 값을 혈압 측정치로 적용하였다.
혈중 납 검사는 네오딘의학연구소에서 원자흡광광도 법(AAS-600 Zeeman correction, Perkin Elmer, Singapore)을 이용하여 산출하였다.15)
3. 통계분석
통계분석은 SAS 9.2(SAS institute Inc, NC, USA) 를 이용하여 분석하였고, 유의성은 p < 0.05 수준에 서 검증하였다. 분석방법은 우선 단변량 분석을 통 해, 혈압에 영향을 주는 기본 요소인 연령, 성, 체질 량지수(Body Mass Index, BMI), 교육수준을 기본 모델로 구축하였다.
기본모델은 다음과 같다.
수축기 혈압(이완기 혈압) = β0+β1*나이+ β2*성별 +β3*체질량지수 + β4*교육수준
이후 확장 모델은 기본 모델에 허리둘레, HDL-콜 레스테롤, 혈당, 중성지방, 혈중 납을 하나씩 넣어 보았다. 최종 모델은 확장 모델에서 유의하게 결과 가 나온 변수를 기본 모델에 넣어 혈압과의 연관성 을 살펴보았다.
따라서 수축기 혈압에 연관이 있는 변수들과의 관 계를 알아보기 위해 최종 모델은 확장모델에서 관련 이 있다고 나온 혈당, 중성지방이 선택되었고, 최종 적으로 수축기 혈압과 이완기 혈압에 영향을 주는
여러 요인들을 보정한 후에도 혈중 납이 혈압에 영 향을 주는지 알아보았다.
수축기 혈압의 최종 모델은 다음과 같다.
수축기 혈압=β0+β1*나이+ β2*성별 + β3*체질량지수 +β4*교육수준 + β6* 공복시 혈당 + β6*중성지방 + β7* 혈중납
이완기 혈압에 연관이 있는 변수들과의 관계를 알 아보기 위해 최종 모델은 확장모델에서 관련이 있다 고 나온 HDL-콜레스테롤, 혈당, 중성지방, 혈중 납 이 선택되었다.
이완기 혈압의 최종 모델은 다음과 같다.
이완기 혈압=β0+β1*나이+ β2*성별 + β3*체질량지수 +β4*교육수준 + β5* HDL − 콜레스테롤
+β6* 공복시 혈당 + β7* 중성지방 + β8* 혈중납 같은 방법으로 비흡연자들 중 체질량지수가 정상 (18.5 kg/m2 ≤ BMI ≤ 25 kg/m2)인 그룹에서 수축기 혈압과 이완기 혈압에 영향을 주는 요인들을 살펴 보았다.
III. 연구결과
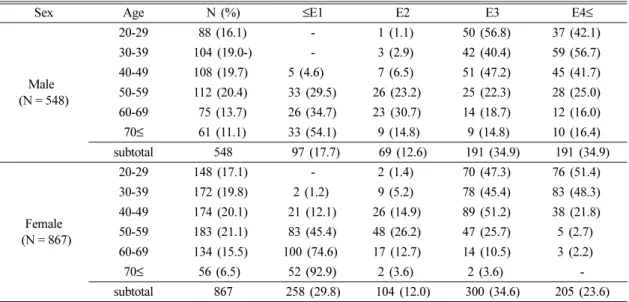
Table 1은 사회경제적 지표 중 교육수준이 비만과
Table 1. General characteristic of the study subjects by education groups
Sex Age N (%) ≤E1 E2 E3 E4≤
Male (N = 548)
20-29 88 (16.1) - 1 (1.1) 50 (56.8) 37 (42.1)
30-39 104 (19.0-) - 3 (2.9) 42 (40.4) 59 (56.7)
40-49 108 (19.7) 5 (4.6) 7 (6.5) 51 (47.2) 45 (41.7) 50-59 112 (20.4) 33 (29.5) 26 (23.2) 25 (22.3) 28 (25.0) 60-69 75 (13.7) 26 (34.7) 23 (30.7) 14 (18.7) 12 (16.0) 70≤ 61 (11.1) 33 (54.1) 9 (14.8) 9 (14.8) 10 (16.4)
subtotal 548 97 (17.7) 69 (12.6) 191 (34.9) 191 (34.9)
Female (N = 867)
20-29 148 (17.1) - 2 (1.4) 70 (47.3) 76 (51.4)
30-39 172 (19.8) 2 (1.2) 9 (5.2) 78 (45.4) 83 (48.3) 40-49 174 (20.1) 21 (12.1) 26 (14.9) 89 (51.2) 38 (21.8) 50-59 183 (21.1) 83 (45.4) 48 (26.2) 47 (25.7) 5 (2.7) 60-69 134 (15.5) 100 (74.6) 17 (12.7) 14 (10.5) 3 (2.2)
70≤ 56 (6.5) 52 (92.9) 2 (3.6) 2 (3.6) -
subtotal 867 258 (29.8) 104 (12.0) 300 (34.6) 205 (23.6) Education groups: E1 (≤Elementary school), E2 (Middle school), E3 (High school), E4 (College ≤)
*One female was not answered about the education question.
연관성이 있다14)고 알려져 있기 때문에 연구대상자 들의 교육수준을 살펴보았다. 연구 대상자들로 선택 된 사람들 중 여성(N = 867)이 61%로 남성(N = 548) 39%보다 많았고, 성별에 상관없이 나이가 많을 수 록 교육수준이 낮았다.
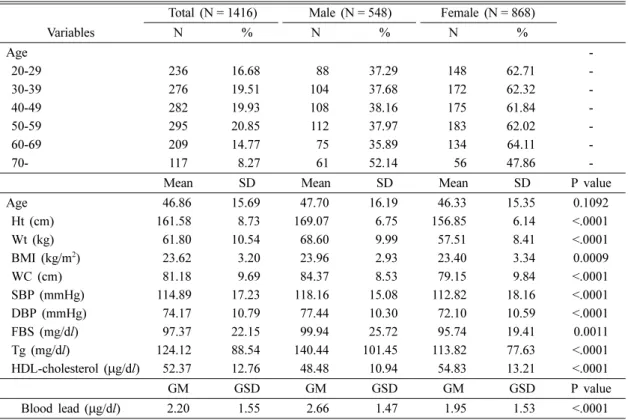
Table 2는 연구대상자들의 인구학적 특성 및 체내 납의 농도를 나타내었다. 이들은 직업적 납 노출이 없는 비흡연자 그룹이다. 공복 시 혈당이 남성 99.94 mg/dl로 여성 95.74 mg/dl보다 높았고(p=
0.0011), 중성지방도 남성 140.44 mg/dl로 여성 113.82 mg/dl보다 높았다(p < 0.0001). 그러나 HDL- 콜레스테롤은 여성이 54.83 µg/dl로 남성 48.48 µg/
dl보다 높았다(p < 0.0001). 이들의 납 농도의 기하평 균은 2.20 µg/dl로 낮은 수준이었으며, 남성의 혈중 납 농도의 기하평균은 2.66 µg/dl으로, 여성의 혈중 납의 기하평균인 1.96 µg/dl보다 높았다(p < 0.0001).
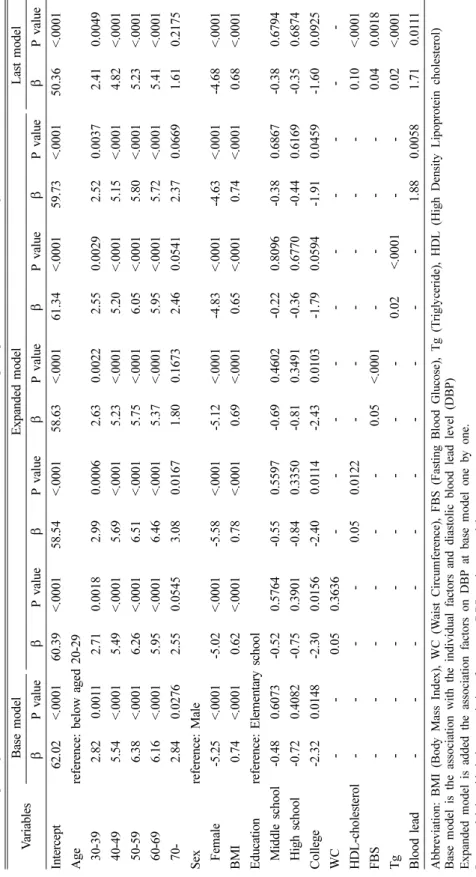
Table 3은 비흡연자 그룹에서 수축기 혈압에 영향 을 주는 요인들을 살펴보았다.
비흡연자의 수축기 혈압에 영향을 주는 기본 변수 들을 기본 모델에서 살펴보면, 연령이 20대에 비해 40대 이후로 갈수록(p < 0.0001), 남성이(p < 0.0001), BMI가 높을수록(p < 0.0001), 학력수준이 낮을수록 (p < 0.0001) 수축기 혈압이 통계적으로 유의하게 높 았다. 이러한 기본 모델에 혈압과 연관성이 있는 비 만 인자인 허리둘레, HDL-콜레스테롤, 공복 시 혈 당, 중성지방, 혈중 납을 각각 하나씩 넣어본 Expended model에서는 수축기 혈압과 공복 시 혈당(p < 0.0001), 중성지방(p < 0.0001), 혈중 납 농도(p=0.0445)와 각 각 양의 상관관계가 있었다.
최종적으로 이렇게 연관성이 있는 변수들을 보정 한 Last model의 결과, 혈중 납 농도가 높을수록 수 축기 혈압이 높아지는 것으로 나타났다(p=0.0357).
Table 4는 비흡연자 그룹에서 이완기 혈압에 영향 을 주는 요인들을 살펴보았다.
비흡연자의 이완기 혈압에 영향을 주는 기본 변수 들을 기본 모형에서 살펴보면, 연령이 증가할수록
Table 2. Distribution of mean or geometric mean of the study subjects
Total (N = 1416) Male (N = 548) Female (N = 868)
Variables N % N % N %
Age -
20-29 236 16.68 88 37.29 148 62.71 -
30-39 276 19.51 104 37.68 172 62.32 -
40-49 282 19.93 108 38.16 175 61.84 -
50-59 295 20.85 112 37.97 183 62.02 -
60-69 209 14.77 75 35.89 134 64.11 -
70- 117 8.27 61 52.14 56 47.86 -
Mean SD Mean SD Mean SD P value
Age 46.86 15.69 47.70 16.19 46.33 15.35 0.1092
Ht (cm) 161.58 8.73 169.07 6.75 156.85 6.14 <.0001
Wt (kg) 61.80 10.54 68.60 9.99 57.51 8.41 <.0001
BMI (kg/m2) 23.62 3.20 23.96 2.93 23.40 3.34 0.0009
WC (cm) 81.18 9.69 84.37 8.53 79.15 9.84 <.0001
SBP (mmHg) 114.89 17.23 118.16 15.08 112.82 18.16 <.0001
DBP (mmHg) 74.17 10.79 77.44 10.30 72.10 10.59 <.0001
FBS (mg/dl) 97.37 22.15 99.94 25.72 95.74 19.41 0.0011
Tg (mg/dl) 124.12 88.54 140.44 101.45 113.82 77.63 <.0001
HDL-cholesterol (µg/dl) 52.37 12.76 48.48 10.94 54.83 13.21 <.0001
GM GSD GM GSD GM GSD P value
Blood lead (µg/dl) 2.20 1.55 2.66 1.47 1.95 1.53 <.0001
Abbreviation: Ht (Height), Wt (Weight), WC (Waist Circumference), SBP (Systolic Blood Pressure), DBP (Diastolic Blood Pressure), FBS (Fasting Blood Glucose), Tg (Triglyceride), HDL (High Density Lipoprotein cholesterol)
http://www.kseh.org/ J Environ Health Sci 2012: 38(4): 311-322 Table 3. Multiple regression results of Systolic Blood Pressure (SBP) for the interrelationship of potential confounders among non-smokers (N=1,416) VariablesBase modelExpanded modelLast model βP valueβP valueβP valueβP valueβP valueβP valueβP value Intercept96.72 <.000193.56<.000194.16<.000188.90<.000195.79<.000194.23<.000186.58<.0001 Agereference: below aged 20-29 30-392.14 0.09712.010.12182.270.07951.710.17811.780.16511.810.16151.170.3602 40-496.96 <.00016.87<.00017.07<.00016.25<.00016.50<.00016.54<.00015.56<.0001 50-599.30 <.00019.03<.00019.40<.00017.86<.00018.86<.00018.67<.00017.06<.0001 60-6914.83 <.000114.40<.000115.04<.000113.00<.000114.54<.000114.35<.000112.51<.0001 70-20.83 <.000120.24<.000121.01<.000118.45<.000120.32<.000120.33<.000117.83<.0001 Sexreference: Male Female-4.98 <.0001-4.52<.0001-5.22<.0001-4.66<.0001-4.40<.0001-4.30 <.0001-3.58<.0001 BMI0.95 <.00010.710.00270.98<.00010.85<.00010.83<.00010.95<.00010.77<.0001 Education reference: Elementary school Middle school-3.67 0.0087-3.700.0083-3.720.0079-4.150.0027-3.320.0171-3.56 0.0110-3.720.0071 High school-4.59 0.0004-4.600.0004-4.680.0003-4.800.0002-4.100.0016-4.28 0.0011-4.100.0015 College-6.66 <.0001-6.64<.0001-6.72<.0001-6.91<.0001-5.93<.0001-6.22 <.0001-5.89<.0001 WC--0.100.2164--- HDL-cholesterol----0.040.2173--- FBS---0.11<.0001----0.10<.0001 Tg---0.02<.0001--0.020.0007 Blood lead---2.050.04452.100.0357 Abbreviation: BMI (Body Mass Index), WC (Waist Circumference), FBS (Fasting Blood Glucose), Tg (Triglyceride), HDL (High Density Lipoprotein cholesterol) Base model is the association with the individual factors and systolicblood leadlevel(SBP)S Expanded modelisadded the association factors on SBP atbase model one by one. Last model is addedthe association factors on SBP at basemodel.
J Environ Health Sci 2012: 38(4): 311-322 http://www.kseh.org/
Table 4. Multiple regression results of Diastolic Blood Pressure (DBP) for the interrelationship of potential confounders among non-smokers (N=1,416) VariablesBase modelExpanded modelLast model βP valueβP valueβP valueβP valueβP valueβP valueβP value Intercept62.02<.000160.39<.000158.54<.000158.63<.000161.34<.000159.73<.000150.36<.0001 Agereference: below aged 20-29 30-392.820.00112.710.00182.990.00062.630.00222.550.00292.520.00372.410.0049 40-495.54<.00015.49<.00015.69<.00015.23<.00015.20<.00015.15<.00014.82<.0001 50-596.38<.00016.26<.00016.51<.00015.75<.00016.05<.00015.80<.00015.23<.0001 60-696.16<.00015.95<.00016.46<.00015.37<.00015.95<.00015.72<.00015.41<.0001 70-2.840.02762.550.05453.080.01671.800.16732.460.05412.370.06691.610.2175 Sexreference: Male Female-5.25<.0001-5.02<.0001-5.58<.0001-5.12<.0001-4.83<.0001-4.63<.0001-4.68<.0001 BMI0.74<.00010.62<.00010.78<.00010.69<.00010.65<.00010.74<.00010.68<.0001 Education reference: Elementary school Middle school-0.480.6073-0.520.5764-0.550.5597-0.690.4602-0.220.8096-0.380.6867-0.380.6794 High school-0.720.4082-0.750.3901-0.840.3350-0.810.3491-0.360.6770-0.440.6169-0.350.6874 College-2.320.0148-2.300.0156-2.400.0114-2.430.0103-1.790.0594-1.910.0459-1.600.0925 WC--0.050.3636--- HDL-cholesterol----0.050.0122---0.10<.0001 FBS---0.05<.0001----0.040.0018 Tg---0.02 <.0001--0.02<.0001 Blood lead---1.880.00581.710.0111 Abbreviation: BMI (BodyMass Index), WC (Waist Circumference), FBS (Fasting Blood Glucose), Tg (Triglyceride), HDL (High Density Lipoprotein cholesterol) Base model is the association with the individual factors and diastolic blood lead level (DBP) Expanded model is added the association factors on DBP at base model one by one. Last model is added the association factors on DBP at base model.
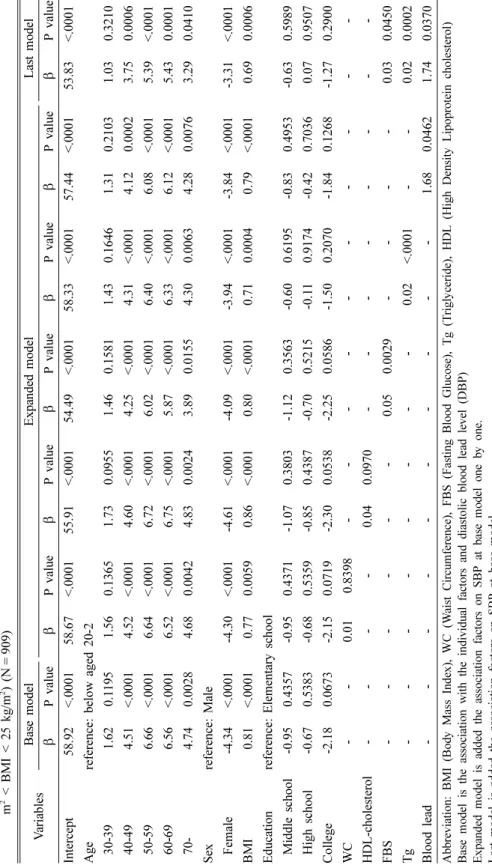
http://www.kseh.org/ J Environ Health Sci 2012: 38(4): 311-322 Table 5.Multiple regression results of Systolic Blood Pressure for the interrelationship of potential confounders among non-smokers of normal BMI group (18.5kg/ m2 < BMI<25 kg/m2 ) (N=909) VariablesBase modelExpanded modelLast model βP valueβP valueβP valueβP valueßP valueβP valueβP value Intercept100.53<.000199.18<.000199.28<.000189.78<.000199.71<.000199.75<.000190.91<.0001 Agereference: below aged 20-29 30-390.940.52840.880.55560.990.50850.560.70290.680.64660.780.60570.430.7712 40-495.680.00035.640.00045.720.00035.050.00115.400.00055.470.00064.940.0014 50-5910.48<.000110.30<.000110.51<.00018.92<.000110.11<.000110.17<.00018.90<.0001 60-6913.84<.000113.60<.000113.93<.000112.18<.000113.52<.000113.61<.000112.21<.0001 70-23.65<.000123.33<.000123.69<.000121.57<.000123.04<.000123.40<.000121.45<.0001 Sexreference: Male Female-5.32<.0001-5.08<.0001-5.43<.0001-4.73<.0001-4.75<.0001-5.05<.0001-4.40<.0001 BMI0.820.00480.650.10580.840.00430.790.0060.670.02010.810.00550.680.0174 Education reference: Elementary school Middle school-3.670.0357-3.620.0394-3.720.0337-4.080.018-3.180.0664-3.610.0393-3.650.0341 High school-4.710.0028-4.670.0032-4.790.0025-4.770.0022-3.930.0124-4.580.004-4.170.0074 College-6.88<.0001-6.87<.0001-6.93<.0001-7.04<.0001-5.930.0005-6.700.0001-6.300.0002 WC--0.06 0.5545--- HDL-cholesterol----0.02 0.6313--- FBS---0.12 <.0001----0.10 <.0001 Tg---0.02 <.0001--0.020.0016 Blood lead---0.890.4613-- Abbreviation: BMI (BodyMass Index), WC (Waist Circumference), FBS (Fasting Blood Glucose), Tg (Triglyceride), HDL (High Density Lipoprotein cholesterol) Base model is the association with the individual factors and systolic blood leadlevel(SBP) Expanded model is added the association factors on SBP at base model one by one. Last model is added the association factors on SBP at base model.
J Environ Health Sci 2012: 38(4): 311-322 http://www.kseh.org/
Table 6.Multiple regression results of Diastolic Blood Pressure for the interrelationship of potential confounders among non-smokers of normal BMI group (18.5kg/ m2 < BMI < 25 kg/m2 ) (N=909) VariablesBase modelExpanded modelLast model βP valueβP valueβP valueβP valueβP valueβP valueβP value Intercept58.92<.000158.67<.000155.91<.000154.49<.000158.33<.000157.44<.000153.83<.0001 Agereference: below aged 20-2 30-391.620.11951.560.13651.730.09551.460.15811.430.16461.310.21031.030.3210 40-494.51<.00014.52<.00014.60<.00014.25<.00014.31<.00014.120.00023.750.0006 50-596.66<.00016.64<.00016.72<.00016.02<.00016.40<.00016.08<.00015.39<.0001 60-696.56<.00016.52<.00016.75<.00015.87<.00016.33<.00016.12<.00015.430.0001 70-4.740.00284.680.00424.830.00243.890.01554.300.00634.280.00763.290.0410 Sexreference: Male Female-4.34<.0001-4.30<.0001-4.61<.0001-4.09<.0001-3.94<.0001-3.84<.0001-3.31<.0001 BMI0.81<.00010.770.00590.86<.00010.80<.00010.710.00040.79<.00010.690.0006 Education reference: Elementary school Middle school-0.950.4357-0.950.4371-1.070.3803-1.120.3563-0.600.6195-0.830.4953-0.630.5989 High school-0.670.5383-0.680.5359-0.850.4387-0.700.5215-0.110.9174-0.420.70360.070.9507 College-2.180.0673-2.150.0719-2.300.0538-2.250.0586-1.500.2070-1.840.1268-1.270.2900 WC--0.01 0.8398--- HDL-cholesterol----0.040.0970--- FBS---0.050.0029----0.030.0450 Tg---0.02<.0001--0.020.0002 Blood lead---1.680.04621.740.0370 Abbreviation: BMI (BodyMass Index), WC (Waist Circumference), FBS (Fasting Blood Glucose), Tg (Triglyceride), HDL (High Density Lipoprotein cholesterol) Base model is the association with the individual factors and diastolic blood lead level (DBP) Expanded model is added the association factors on SBP at base model one by one. Last model is added the association factors on SBP at base model.
http://www.kseh.org/ J Environ Health Sci 2012: 38(4): 311-322 (p < 0.05), 남성이 (p < 0.0001), BMI가 높을수록
(p < 0.0001) 이완기 혈압이 높았고, 초등학교 이하 의 학력수준을 가진 집단이 전문대학 이상의 학력수 준을 가진 집단보다 이완기 혈압이 더 높았다 (p = 0.0148). 비만인자들, 혈중 납과 혈압과의 영향 을 살 펴 본 결과, HDL-콜레스테롤이 높을 수록 (p = 0.0122), 공복 시 혈당이 높을 수록(p < 0.0001), 중성지방이 높을수록(p < 0.0001), 혈중 납 농도가 높 을수록(p=0.0058) 이완기 혈압이 높아지는 것으로 나타났다.
최종적으로 이렇게 연관성이 있는 변수들을 보정 한 Last model의 결과, 이완기 혈압에 영향을 미치 는 요인들을 다 보정 한 후에도 혈중 납 수준이 올 라가면 이완기 혈압이 높아지는 것으로 나타났다 (p = 0.0111).
Table 5와 6에서는 BMI가 정상이라고 하더라도 비만요인(BMI, 허리둘레, HDL-콜레스테롤, 공복 시 혈당, 중성지방)과 혈중 납이 혈압에 어떻게 영향을 미치는지 살펴보았다.
Table 5를 살펴보면, BMI가 정상인 그룹일지라도 20대에 비해 40대 이상부터는 연령이 증가할수록 수 축기 혈압이 높아지고 있었고(p < 0.005), 남성이 여 성보다 수축기 혈압이 높았다(p < 0.0001). 또한 BMI 가 정상 범위라고 하더라도 BMI가 높을수록 수축 기 혈압이 높았고(p=0.0048), 학력수준이 낮을수록 수축기 혈압이 더 높았다(p < 0.05).
다른 비만요인 중에서는 공복 시 혈당이 높을수록 (p < 0.0001), 중성지방이 높을수록(p < 0.0001) 수축 기 혈압이 높았다. 그러나 혈중 납은 BMI가 정상인 그룹 내에서는 수축기 혈압과 연관성이 없었다.
Table 6을 보면, BMI가 정상인 그룹일지라도 20 대에 비해 40대 이후부터 연령이 증가할수록 이완 기 혈압이 높아지고 있었고(p < 0.005), 남성이 여성 보다 (p < 0.0001), BMI가 높을수록 (p < 0.0001) 이 완기 혈압이 높았다. 그러나 학력수준에 따른 수축 기 혈압과의 연관성은 없었다. 다른 비만인자 중에 서는 공복 시 혈당이 증가할 수록(p=0.0029), 중성 지방이 증가할 수록(p < 0.0001) 이완기 혈압이 높았 고, 혈중 납 수준이 높을수록 이완기 혈압이 높았다 (p = 0.0462).
이완기 혈압에 연관성이 있는 요인들을 다 보정한 후 최종모델의 결과, BMI 정상인 그룹 내에서, 다
른 연관성이 있던 비만요인을 보정한 후에도 혈중 납 수준이 증가하면 이완기 혈압이 높아지는 것으로 나타났다(p=0.0370).
IV. 고 찰
본 연구에서는 연구대상 1416명의 혈중 납 농도 는 2.20 µg/dl(기하평균)로, 우리나라 40세 이상 성 인을 대상으로 한 연구의 혈중 납 수준인 2.60 µg/
dl(기하평균)15)나 서울시 사무직 근로자들을 대상으 로 한 연구의 혈중 납 수준인 2.34 µg/dl(기하평균)16) 에 비해서도 낮은 수준이었다.
혈압과 관련이 있는 연령, 성, 교육수준, BMI를 기 본 모델로 두고 비만관련 인자(허리둘레, HDL-콜레 스테롤, 공복 시 혈당, 중성지방)중 혈압과 연관성이 있던 요인들을 보정 후 혈중 납이 증가 할수록 수 축기 혈압(p=0.0357), 이완기 혈압(p=0.0111) 모두 양의 상관성이 있었다. 또한, BMI가 정상이라고 하 더라도 BMI가 증가하면 수축기 혈압(p=0.0048)과 이완기 혈압(p < 0.0001) 모두 상승하는 것으로 나타 났다. 특히, BMI가 정상인 그룹에서는 이완기 혈압 과 관련이 있던 비만인자들을 보정한 후에도 혈중 납의 증가가 이완기 혈압의 상승과 연관이 있었다 (p = 0.0370).
일부 연구자들은 저농도 납 노출과 혈압은 관련성 이 약하다고 하였으나,16)많은 독성학적 연구에서 납 이 혈압을 증가시킴을 확인할 수 있었다.17-20)특히 혈중 납은 수축기 혈압 및 이완기 혈압과 밀접한 연 관성이 있으며, 특히 이완기 혈압이 90 mmHg 이하 인 사람들보다 90 mmHg 이상인 사람들에게서 혈중 납의 농도가 더 유의하게 높았다.1,21) 또한 혈중 납 이 1 µg/dl 증가하면 각각 수축기 혈압은 0.99 mmHg, 이완기 혈압은 0.51 mmHg 증가와 연관이 있다고 보 고하였다.22)또 다른 연구에서는 납 중독 시 지질대 사를 방해하여 혈청 콜레스테롤을 증가시킨다고 하 였다.23) 본 연구에서는 이완기 혈압 모두에서 비만 인자들을 다 보정한 후에도 HDL-콜레스테롤, 공복 시 혈당, 중성지방, 혈중 납 수준이 높을수록 혈압 상승에 연관이 있다고 나타났다. 특히, BMI정상인 그룹에서도 이완기 혈압은 HDL-콜레스테롤, 공복시 혈당, 중성지방, 혈중 납 수준이 높을수록 혈압 상 승에 연관이 있다고 나타났다. 이는 우리 연구가 비
J Environ Health Sci 2012: 38(4): 311-322 http://www.kseh.org/
만은 고혈압, 중성지방의 증가, 손상된 혈관 기능과 관계가 있다고 알려져 있는24,25) 기존의 연구를 뒷받 침해 주고 있다.
또한 본 연구는 혈중 납 수준이 기존의 연구가 된 사람들 보다 낮은 수준의 사람들을 대상으로 한 연 구임에도 불구하고 혈중 납 수준이 수축기 혈압과 이완기 혈압 모두 상승하는 것과 연관성이 있다는 것으로 나타났다. 더구나, 혈압과 연관성이 있는 비 만요인들을 보정 한 후에도 혈중 납의 증가는 혈압 상승과 관련이 있다고 나타났다. 이는 미국 질병통 제예방센터(Centers for Disease Control and Prevention, CDC)에서 권고하고 있는 아동의 혈중 납 권고치 10 µg/dl26)보다도 더 낮은 수준의 혈중 납 을 가지는 인구 집단을 대상으로 한 연구로, 기존의 혈중 납 권고치는 더 낮아져야 할 필요가 있다는 것 을 보여준다.
납과 혈압과의 관계를 설명하는 것은 명확하지는 않지만, 몇 가지로 설명이 가능하다. 첫째, 체내 납 은 혈관의 반응성 산소류의 생성을 증가시킨다고 한 다.27)또한, 납에 노출된 쥐를 대상으로 한 연구에서 쥐의 혈관에는 납이 축적되고 노출이 끝나도 납은 잔류한다고 보고하였다.20) 이러한 연구결과들은 혈 관계의 납 축적이 산화스트레스를 유도하여 혈관의 경화를 유발할 가능성을 제시하고 있다. 혈관은 관 내세포와 유근세포 사이의 생화학적인 신호의 교환 을 통해 혈관의 운동기능을 적절하게 유지하는데, 이 러한 혈관내의 세포들의 기능 장해로 혈관의 항상성 을 방해하면 과도한 혈관수축으로 이어지고, 여러 가지 혈관계 질환을 유발하는 결과를 초래할 수 있 다.18) 혈관의 운동성이 변화함에 따라 급성 혈관경 련, 미세순환계 허혈성 심질환, 고혈압 등이 발생할 수 있는 것으로 알려져 있다.28-30) 둘째, 납은 cytochrome P-450을 억제시키는데, 이로 인해 혈관 벽에 지질이 침착되어 죽상경화증을 발생시키는 것 으로 알려져 있다.17) 셋째, 활성산소제거 효소인 superoxide dismutase를 억제하여 lipid peroxide를 증가시킨다고 알려져 있다.19) Lipid peroxide의 증가 는 중추신경계의 혈관에 혈소판과 혈액을 응고시켜 혈관질환과 혈전형성의 위험을 초래하게 된다.2,3,19,28) 이러한 납의 영향으로 인해 혈압이 상승하면, 이로 인해 허혈성 심장질환 및 관상동맥질환의 위험도도 함께 높아질 수 있다.7,32,33)
본 연구는 몇 가지 제한점을 가진다. 첫째, 국민건 강영향조사에 참여한 연구대상자들로 혈중 납의 측 정은 성인들을 대상으로 시행하였으므로, 어린이나 청소년의 납 노출 수준과는 다를 수 있다. 또한, 연 구 대상자들은 일반인구 중 비흡연자를 대상으로 시 행하였으므로 혈중 납 허용기준보다 훨씬 낮은 수준 으로 유지하고 있었다. 이는 직업적 노출이나 또는 환경 중 높은 수준으로 노출되는 인구집단에 대해 해석을 할 때는 주의가 필요하다. 또한, 식이나 생 활 수준과 같은 다양한 납 노출 경로를 고려하지 못 한 점이 연구의 제한점이라 할 수 있겠다. 그러나, 사회경제적 지표 중 하나인 교육 수준으로 보정을 하여 연구를 진행하였다.
그럼에도 불구하고, 이번 연구결과는 특정 질환이 없고, 흡연을 하지 않는 집단에서 시행된 결과이며, 비만이 아닌 정상인들에게서도 낮은 수준의 혈중 납 노출이라고 하더라도 이완기 혈압을 높인다는 점에 서 만성적인 저 농도의 납 노출은 관상동맥질환의 위험을 높일 수 있다. 또한, 혈압의 상승이 고혈압 이나 경계역 혈압의 범위가 아니라고 하더라도 정상 범위 내의 혈압의 상승은 추후 경계역 고혈압이나 고혈압으로의 발전 가능성을 높이므로 납에 대한 노 출에 대한 주의가 필요하며, 환경 중 납 노출 수준 을 보다 엄격하게 관리하여야 할 필요성이 있다.
V. 결 론
본 연구는 직업적 납 노출이 없는 일반인구 중 20 세 이상 비흡연자들을 대상으로 혈중 납과 혈압과의 연관성을 살펴보았다.
환경 중 저농도로 노출되는 집단이었기 때문에 혈 중 납 농도는 2.20 µg/dl로 매우 낮았다. 또한, 연령 이 증가할수록, 남성이 여성보다, 교육수준이 낮을수 록 혈중 납 농도가 더 높았다. 그러나 이러한 혈압 에 영향을 주는 연령, 성, 교육수준, BMI를 보정 후 혈압과의 관계에서, 특히 이완기 혈압과 유의한 상 관관계가 있었다. 이러한 결과는 BMI가 정상인 그 룹에서도 이들의 혈중 납과 이완기 혈압과 유의한 양의 상관관계가 있는 것으로 나타났다. 이것은 아 무리 낮은 농도라고 할지라도 납에 노출이 되면 정 상적인 혈압의 범위라고는 하지만 혈압의 상승과 관 련이 있다는 것을 보여준다. 이렇게 높아진 혈압은
http://www.kseh.org/ J Environ Health Sci 2012: 38(4): 311-322 추후 허혈성 심장질환의 위험도도 함께 증가할 위험
이 있다. 그러므로, 미국 질병통제예방센터(Centers for Disease Control and Prevention, CDC)에서 권 고하고 있는 아동의 혈중 납 권고치 10 µg/dl26)보다 더 낮아져야 하는 것을 보여주고 있다. 또한, 본 연 구는 성인을 대상으로 한 연구이므로, 향후 민감집 단인 어린이를 대상으로 하는 연구가 추가적으로 진 행하여 어린이의 혈중 납과 건강영향을 살펴볼 필요 가 있다.
감사의 글
본 연구는 한국의학연구소의 지원으로 진행되었습 니다.
참고문헌
1. Juberg DR, Kleiman CF, Kwon SC. Position paper of the American Council on Science and Health:
lead and human health. Ecotoxicol Environ Saf.
1997; 38(3): 162-180.
2. Prozialeck WC, Edwards JR, Nebert DW, Wood JM, Barchowsky A, Atchison WD. The vascular system as a target of metal toxicity. Toxicol Sc.
2008; 102(2): 207-218.
3. Wu WT, Tsai PJ, Yang YH, Yang CY, Cheng KF, Wu TN. Health impacts associated with the imple- mentation of a national petrol-lead phase-out pro- gram (PLPOP): Evidence from Taiwan between 1981 and 2007. Sci Total Environ. 2011; 409(5):
863-867.
4. Needleman HL, Gunnoe C, Leviton A, Reed R, Peresie H, Maher C, Barrett P. Deficits in psycho- logic and classroom performance of children with elevated dentine lead levels. New England Journal of Medicine, 1979; 300(13): 689-695.
5. Cummins SK, Goldman LR. Even advantaged chil- dren show cognitive deficits from low-level lead toxicity. Pediatrics, 1992; 90(6): 995-997.
6. Loghman-Adham M. Renal effects of environmen- tal and occupational lead exposure. Environ Health Perspect. 1997; 105(9): 928-939.
7. Park RJ, Kim SH, Park JU, Kim YH, Kim MB, Park WJ, Moon JD. Blood lead level as a predictor of coronary artery disease. Korean J Occup Envi- ron Med. 2009; 21(1): 38-45.
8. Cheng Y, Schwartz J, Sparrow D, Aro A, Weiss ST,
Hu H. Bone lead and blood lead levels in relation to baseline blood pressure and the prospective development of hypertension the normative aging study, Am J Epidemiol. 2001; 153(2): 164-171.
9. Nawrot TS, Thijs L, Den Hond EM, Roels HA, Staessen JA. An epidemiological re-appraisal of the association between blood pressure and blood lead:
a meta-analysis. J Hum Hypertens. 2002; 16(2):
123-131.
10. Kim YH. Association of Lead Exposure with Blood Pressure. Asan: Soonchunhyang University, 2010.
11. Song YB. Prevalence of Hypertension and Changes in Levels of Blood Pressure, Heamtologic and Bio- chemical Profiles According to Blood Lead Level Among Manufacturing Workers. Chungnam: Cung- nam National University; 2011.
12. Wang SJ. Effect of Heavy Metals on Blood Pres- sure: Focused on Cadmium, Nickel, Arsenic and Lead. Seoul: Seoul National University; 2010.
13. Zielinska-Danch W, Wardas W, Sobczak A, Szolty- sek-Boldys I. Estimation of urinary cotinine cut-off points distinguishing non-smokers, passive and active smokers. Biomarkers. 2007; 12(5): 484-496.
14. Pikhart H, Bobak M, Malyutina S, Pajak A, Kubinova R, Marmot M. Obesity and education in three countries of the Central and Eastern Europe:
the HAPIEE study. Central European Journal of Public Health, 2007; 15(4): 140-142.
15. Kim SY, Lee DH. Blood lead concentration and hypertension in korean adults aged 40 and over according to KNHANES. J Environ Health Sci.
2011; 37(6): 418-428.
16. Rho S-N, Choi M-K. Relationship between dietary, blood and urinary levels of lead, blood pressure and serum lipids in Korean Rural people on self- selected diet. Journal of the Korean Society of Food Science and Nutrition, 1995; 24(6): 829-836.
17. Alvares A, Fischbein A, Sassa S, Anderson KE, Kappas A. Lead intoxication: effects on cyto- chrome P-450-mediated hepatic oxidations. Clini- cal Pharmacology and Therapeutics, 1976; 19(2):
183-190.
18. Bell DM, Johns TE, Lopez LM. Endothelial dys- function: implications for therapy of cardiovascular diseases. The Annals of Pharmacotherapy, 1998;
32(4): 459-470.
19. Ito Y, Niiya Y, Kurita H, Shima S, Sarai S. Serum lipid peroxide level and blood superoxide dismu- tase activity in workers with occupational exposure to lead. Int Arch Occup Environ Health. 1985;
56(2): 119-127.
J Environ Health Sci 2012: 38(4): 311-322 http://www.kseh.org/
20. Malvezzi CK, Moreira EG, Vassilieff I, Vassilieff VS, Cordellini S. Effect of L-arginine, dimercapto- succinic acid (DMSA) and the association of L- arginine and DMSA on tissue lead mobilization and blood pressure level in plumbism. Braz J Med Biol Res. 2001; 34(10): 1341-1346.
21. Harlan WR, Landis JR, Schmouder RL, Goldstein NG, Harlan LC. Blood lead and blood pressure.
JAMMA: The Journal of the American Medical Association, 1985; 253(4): 530-534.
22. Martin D, Glass TA, Bandeen-Roche K, Todd AC, Shi W, Schwartz B. Association of blood lead and tibia lead with blood pressure and hypertension in a community sample of older adults. Am J Epide- miol. 2006; 163(5): 467-478.
23. Sroczy ski J, Zajusz K, Kossmann S, Wegiel A.
The effect of experimental lead poisoning on the development of atherosclerosis. Polish Med J. 1968;
7(1): 196-201.
24. Steinberger J, Moorehead C, Katch V, Rocchini AP.
Relationship between insulin resistance and abnor- mal lipid profile in obese adolescents. Journal of Pediatrics, 1995; 126(5): 690-695.
25. Visser M, Bouter LM, McQuillan GM, Wener MH, Harris TB. Low-grade systemic inflammation in overweight children. Pediatrics, 2001; 107(1): e13.
26. Agency for Toxic Substances & Disease Registry.
Lead toxicity. What are the U.S. standards for lead levels?. Available from: http://www.atsdr.cdc.gov/
csem/csem.asp?csem=7&po=8 [Accessed 2012 July 20]
27. Meki ARMA, Alghasham AA, Ismail HAS. Rela-
tionship between blood lead level and elevated blood pressure in hypertensive patients: implication of nitric oxide. Open Nitric Oxide J. 2011; 3: 1-5.
28. Alexander RW. Hypertension and the pathogenesis of atherosclerosis: oxidative stress and the media- tion of arterial inflammatory response: a new per- spective. Hypertension. 1995; 25: 155-161.
29. Lüscher TF, Tanner FC, Tschudi MR, Noll G:
Endothelial dysfunction in coronary artery disease.
Annu Rev Med. 1993; 44: 395-418.
30. Sellke FW, Boyle EM, Verrier ED. The pathophys- iology of vasomotor dysfunction. The Annals of Thoracic Surgery, 1997; 64(4): S9-S15.
31. Wojtczak-Jaroszowa J, Kubow S. Carbon monox- ide, carbon disulfide, lead and cadmium-four exam- ples of occupational toxic agents linked to cardiovascular disease. Medical Hypotheses, 1989;
30(2): 141-150.
32. MacMahon S, Peto R, Collins R, Sorlie P, Neaton J, Abbott R, Godwin J, Dyer A, Stamler J. Blood pressure, stroke, and coronary heart disease. Part 1, prolonged differences in blood pressure: prospec- tive observational studies corrected for the regres- sion dilution bias. The Lancet, 1990; 335(8692):
765-774.
33. Khot UN, Khot MB, Bajzer CT, Sapp SK, Ohman EM, Brener SJ, Ellis SG, Lincoff AM, Topol EJ.
Prevalence of conventional risk factors in patients with coronary heart disease. JAMA: The Journal of the American Medical Association, 2003; 290(7):
898-904.
ón