D I A B E T E S & M E T A B O L I S M J O U R N A L D I A B E T E S & M E T A B O L I S M J O U R N A L
This is an Open Access article distributed under the terms of the Creative Commons Attribution Non-Commercial License (http://creativecommons.org/licenses/by-nc/4.0/) which permits unrestricted non-commercial use, distribution, and reproduction in any medium, provided the original work is properly cited.
Association of Visit-to-Visit Variability of Blood
Pressure with Cardiovascular Disease among Type 2 Diabetes Mellitus Patients: A Cohort Study
Zhe-Bin Yu1,*, Die Li1,*, Xue-Yu Chen1, Pei-Wen Zheng1, Hong-Bo Lin2, Meng-Ling Tang1, Ming-Juan Jin1, Jian-Bing Wang1,3, Kun Chen1,3
1Department of Epidemiology and Health Statistics, Zhejiang University School of Public Health, Hangzhou,
2Center for Disease Control and Prevention of Yinzhou District, Ningbo,
3Research Center for Air Pollution and Health, Zhejiang University, Hangzhou, China
Background: Increasing evidence has shown that visit-to-visit variability (VVV) of blood pressure (BP) is associated with an in- creased risk of cardiovascular disease (CVD). The objective of this study was to evaluate the impact of VVV of systolic blood pres- sure (SBP) and diastolic blood pressure (DBP) on the risk of CVD among patients with type 2 diabetes mellitus (T2DM) in China.
Methods: We conducted a retrospective cohort study of 10,163 T2DM patients who were not previously diagnosed with CVD from January 2008 to December 2012 in Ningbo, China. The VVV of BP was calculated using five metrics, including standard de- viation (SD), coefficient of variation (CV), variation independent of mean, average real variability, and successive variability (SV) of measurements, obtained over a 24-month measurement period. Hazard ratios and 95% confidence intervals (CIs) were esti- mated by Cox proportional hazards regression models for the associations of variability in BP with risk of CVD.
Results: A total of 894 CVD events were observed during a median follow-up of 49.5 months. The hazard ratio in the highest quintile of SD of SBP was 1.24 (95% CI, 1.01 to 1.52) compared with patients in the lowest quintile. The association between high- er VVV of DBP and risk of CVD was not consistent across different metrics and sensitivity analyses.
Conclusion: Higher VVV of SBP was associated with an increased risk of CVD, irrespective of the mean SBP level. Future studies are needed to confirm these findings.
Keywords: Blood pressure; Cardiovascular diseases; Diabetes mellitus, type 2
Corresponding authors: Kun Chen https://orcid.org/0000-0003-1162-6896 Department of Epidemiology and Health Statistics, Zhejiang University School of Public Health, 866 Yuhangtang Road, Hangzhou 310058, China
E-mail: [email protected]
Jian-Bing Wang https://orcid.org/0000-0002-5571-2174
Department of Epidemiology and Health Statistics, Zhejiang University School of Public Health, 866 Yuhangtang Road, Hangzhou 310058, China
E-mail: [email protected]
INTRODUCTION
Cardiovascular disease (CVD) is a major cause of death and disability in patients with diabetes and consumes a significant portion of diabetes resources at a national level [1]. The ap- proach recommended by the diabetic management guidelines is to maintain optimal blood pressure (BP) [2,3]. Recently, in-
creasing attention has been paid to the prognostic value of vis- it-to-visit variability (VVV) for CVD events [4,5].
VVV of BP was first investigated by Grove et al. [6]. Roth- well et al. [7] found that VVV in systolic blood pressure (SBP) and maximum SBP were strong predictors for stroke, indepen- dent of mean SBP. Several prospective as well as retrospective studies of VVV of SBP were conducted in various patient pop- https://doi.org/10.4093/dmj.2018.0108
pISSN 2233-6079 · eISSN 2233-6087
ulations [7-11]. A recent meta-analysis that included 23 studies concluded that VVV of SBP was associated with a risk of CVD incidence [12]. A limited number of studies have reported the association between VVV of SBP and CVD among patients with diabetes [12-16], but only one study reported that VVV of diastolic blood pressure (DBP) was a significant predictor of CVD incidence among patients with type 2 diabetes mellitus (T2DM) [17]. Moreover, the effect of VVV of SBP on cardio- vascular events may demonstrate heterogeneity between Chi- nese and non-Chinese populations. A study conducted in the UK revealed a lower risk of CVD among diabetic patients of Chinese ethnicity compared to the risk of patients of other eth- nicities, such as Caucasian and Indian [18]. Evidence on the association between VVV of SBP and CVD among Chinese diabetic patients remains limited.
Thus, population-based studies among patients with diabe- tes are still needed to increase the body of evidence on the as- sociation of VVV of BP with risk of CVD events. We conduct- ed a large retrospective cohort study aimed to evaluate the as- sociation between VVV of BP and CVD risk among T2DM patients in China.
METHODS
Study design
This population-based retrospective cohort study was con- ducted between January 1, 2008 and December 31, 2012 in Yinzhou District, Ningbo, Zhejiang province, China. Yinzhou is the largest district in Ningbo and has an adult population of approximately 961,000 people. Yinzhou has established a Health Information System (Yinzhou HIS) covering all health services, including public hospitals and primary-care clinics [19,20]. In Yinzhou, CVDs and diabetes were required to be reported for disease surveillance and management by local general practitioners (GPs). GPs were also required to follow up with these patients at an interval of approximately 3 months, and outcome records were uploaded into the Chronic Disease Registry System. For CVD cases treated outside the Yinzhou region, the events were recorded and updated during the fol- low-up with the GP.
Data on T2DM patients were retrieved from the Chronic Disease Registry System in the Yinzhou HIS, which were cod- ed as E11.X according to the 10th version of the International Classification of Diseases (ICD-10). A unique and encoded identifier was created for each patient in the Yinzhou HIS. We
used this identifier to link all related databases to obtain the relevant covariates. The date of the first BP recording was de- fined as the baseline. The BP measurement period was defined as 24 months after baseline; thus, a total of nine BP measure- ments were used to calculate the VVV of BP. In the current study, T2DM patients with the first BP measurement record between January 1, 2008 and December 31, 2012 were includ- ed. The exclusion criteria were as follows: (1) Patients who had CVD events before baseline or during the BP measurement period and (2) Patients who were not followed regularly at an interval of approximately 3 months or had more than one missing BP value during the measurement period.
CVD events consisted of myocardial infarction and cerebro- vascular disease, which were coded as I20 to I25 and I60 to I69 according to the ICD-10 in the Yinzhou HIS. Each patient was followed until the date of a cardiovascular event, death, the last known follow-up date or December 31, 2016, whichever oc- curred first.
BP variability measurements and visit-to-visit variability The procedures for measuring BP during the BP measurement period followed standardized guidelines that included quality control measures [21]. The BPs of all the subjects were mea- sured using a mercury sphygmomanometer while the patients were in a seated position after resting for 5 minutes. The first and fifth Korotkoff sounds were used to measure SBP and DBP, respectively. The quality control measures implemented for BP measurement were as follows. All hospitals and clinics in the region followed the same standardized protocol for BP mea- surement. At least two BP measurements were taken at each visit with a break between the measurements of at least 1 min- ute, and the average value was recorded by community doc- tors. The mercury sphygmomanometer was calibrated every six months. Talking and a full bladder were avoided during the measurement of BP. The average of the BP measurements was recorded by the doctors and uploaded into the Yinzhou HIS.
The standard deviation (SD) was used as the main metric of visit-to-visit blood pressure variability (BPV), and the other four metrics included the coefficient of variation (CV), succes- sive variability (SV), average real variability (ARV), and vari- ance independent of the mean (VIM). SD and CV account for the total variability around the mean BP across visits, while ARV and SV measure the differences in BP from one visit to the next. VIM was first used by Rothwell mainly to reduce the correlation between the measurement of BPV (take SD as an
example) and the mean BP value. VIM was defined as SD/
(meanλ), while λ was calculated through curve fitting. The mean BP value for each patient, averaged over all BP values re- corded during the BP measurement period, was considered as a covariate. Detailed information for all metrics of VVV BP is listed in Supplementary Table 1.
Baseline covariates included the demographic characteris- tics, clinical parameters, and treatment modalities of the pa- tients. Demographic characteristics included age, sex, body mass index (BMI), and smoking and alcohol drinking status.
Current smoking was defined as having smoked at least one cigarette per day for 1 year or more. Current alcohol drinkers were defined as patients who consumed at least 100 g of any type of alcohol per week for the last year. Clinical parameters consisted of duration of diabetes and lipid profiles (including fasting plasma glucose, total cholesterol, triglycerides, high density lipoprotein cholesterol, and low density lipoprotein cholesterol). Treatment modalities included the use of antihy- pertensive drugs, oral antidiabetic drugs or insulin, and the use of lipid lowering treatments.
Statistical analysis
Descriptive analyses were used to analyze the baseline charac- teristics. Univariate analyses were used to test the differences among the quintiles of the SDs of SBP of patients and between patients included and excluded from the present study. Pear- son’s correlation coefficients were estimated between measures of VVV of BP and mean BP during the measurement period.
Multivariate Cox proportional hazards regression models were performed to evaluate the effect of BP variability on cardiovas- cular outcomes after adjusting for age (continuous variable), sex (man or woman), duration of diabetes mellitus (continu- ous variable), smoking status (current or not), alcohol drink- ing status (current or not), BMI (continuous variable), use of glucose treatment (yes or no), use of BP lowering treatment (yes or no), and use of lipid lowering treatment (yes or no) (model I), or variables in model I plus mean BP values (contin- uous variable) (model II). Each BP variability measure was cat- egorized by quintiles with a reference level of the lowest quin- tile. Linear trends across the quintiles were calculated by in- cluding the quintile as a continuous variable (ranging from 1 to 5) in the models.
Subgroup analyses were conducted through stratification by age (>60 and ≤60 years), sex (male or female), use of anti-hy- pertensive drugs (yes or no), and use of lipid lowering treat-
ments to minimize potential bias. We also performed sensitivi- ty analyses to examine the stability of our results. Patients with eight (n=5,642) and nine (n=4,521) BP readings were evaluat- ed separately. Sensitivity analyses were also performed by re- stricting the analysis to patients with BP ≤140/90 and ≤130/80 mm Hg during the measurement period. We also excluded pa- tients who had no information regarding their lipid profile at baseline, who were diagnosed with diabetes mellitus less than 1 year prior or who were followed for less than 1 year after the measurement period. In addition, we classified the SDs of SBP into five groups (≤5, 5.1 to 7.5, 7.6 to 10, 10.1 to 15, and >15 mm Hg) to determine whether maintaining an SBP within 10 mm Hg was an optimal target for BP variability control [13]. To explore the nonlinear relationships between CVD and the SDs of SBP as a continuous variable, we used restricted cubic splines with 4 knots placed at 5, 7.5, 10, and 15 mm Hg. All analyses were conducted in R software 3.3.2 (https://www.r-project.
org/). A two-sided P<0.05 was considered statistically signifi- cant.
Ethics approval and consent to participate
This study conformed to the guidelines of the Declaration of Helsinki, and the study procedures were reviewed and ap- proved by the ethics committee of the School of Medicine, Zhejiang University (No. 2018-028). Each patient agreed to participate and signed the informed consent form.
RESULTS
A total of 10,163 T2DM patients were included in the final analysis. Fig. 1 shows a flow chart of this study. We excluded 450 patients who had a history of CVD at baseline, 387 patients who developed CVD during the BP measurement period and 3,167 patients who were not regularly followed at an interval of 3 months or who had more than one missing BP value. The mean age at baseline was 61.3 years, 60.9% were female, and the median duration of DM was 40 months. The mean BP was 130.1/80.2 mm Hg at baseline. Table 1 summarizes the baseline characteristics of all patients included. The characteristics of the patients excluded from the current study are listed in Sup- plementary Table 2. During a median of 49.5 months of follow- up, a total of 894 cardiovascular events were recorded. Pear- son’s correlation coefficients between mean BP level and VVV BP metrics are shown in Supplementary Table 3.
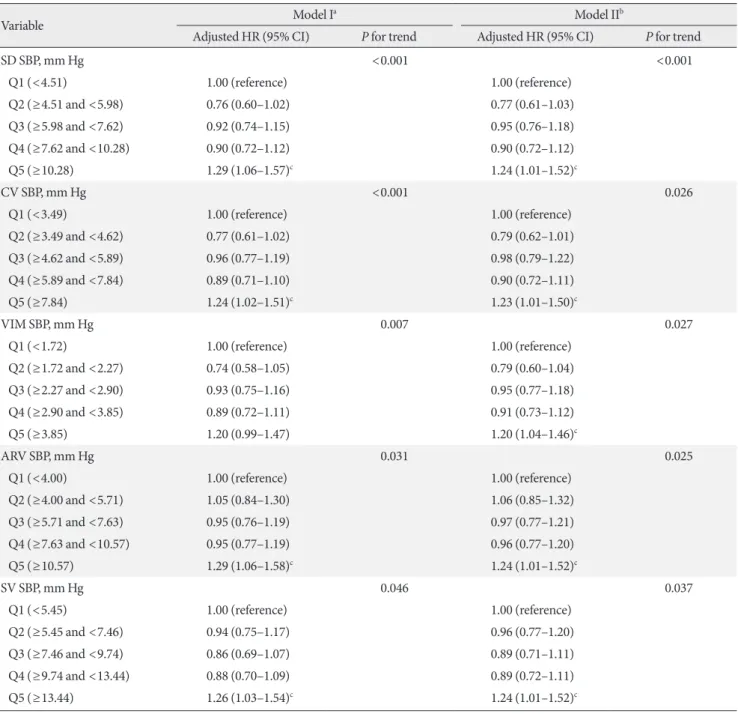
Table 2 presents the association of SBP VVV with the risk of
Fig. 1. Study design for the investigation of the association of visit-to-visit variability (VVV) in blood pressure (BP) and cardio- vascular disease (CVD). The BP measurements during the measurement period (0, 3, 6, 9, 12, 15, 18, 21, 24 months after baseline) were used to calculate the mean and VVV. The median follow-up period was 49.5 months.
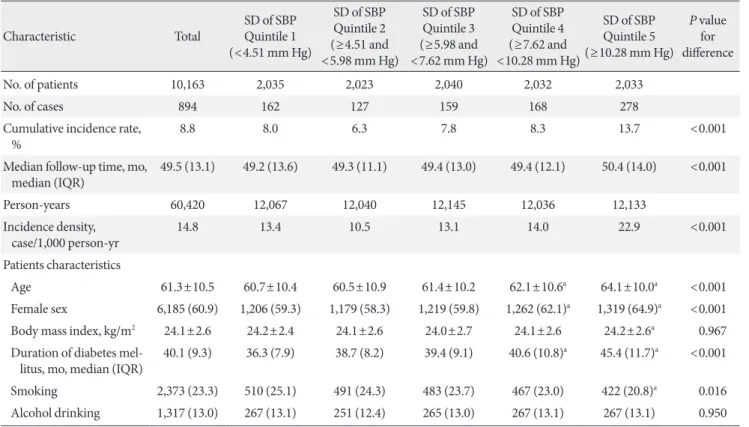
Table 1. Baseline characteristics of included patients in the present study
Characteristic Total SD of SBP
Quintile 1 (<4.51 mm Hg)
SD of SBP Quintile 2 (≥4.51 and
<5.98 mm Hg)
SD of SBP Quintile 3 (≥5.98 and
<7.62 mm Hg)
SD of SBP Quintile 4 (≥7.62 and
<10.28 mm Hg)
SD of SBP Quintile 5 (≥10.28 mm Hg)
P value differencefor
No. of patients 10,163 2,035 2,023 2,040 2,032 2,033
No. of cases 894 162 127 159 168 278
Cumulative incidence rate,
% 8.8 8.0 6.3 7.8 8.3 13.7 <0.001
Median follow-up time, mo,
median (IQR) 49.5 (13.1) 49.2 (13.6) 49.3 (11.1) 49.4 (13.0) 49.4 (12.1) 50.4 (14.0) <0.001
Person-years 60,420 12,067 12,040 12,145 12,036 12,133
Incidence density,
case/1,000 person-yr 14.8 13.4 10.5 13.1 14.0 22.9 <0.001
Patients characteristics
Age 61.3±10.5 60.7±10.4 60.5±10.9 61.4±10.2 62.1±10.6a 64.1±10.0a <0.001
Female sex 6,185 (60.9) 1,206 (59.3) 1,179 (58.3) 1,219 (59.8) 1,262 (62.1)a 1,319 (64.9)a <0.001
Body mass index, kg/m2 24.1±2.6 24.2±2.4 24.1±2.6 24.0±2.7 24.1±2.6 24.2±2.6a 0.967
Duration of diabetes mel-
litus, mo, median (IQR) 40.1 (9.3) 36.3 (7.9) 38.7 (8.2) 39.4 (9.1) 40.6 (10.8)a 45.4 (11.7)a <0.001
Smoking 2,373 (23.3) 510 (25.1) 491 (24.3) 483 (23.7) 467 (23.0) 422 (20.8)a 0.016
Alcohol drinking 1,317 (13.0) 267 (13.1) 251 (12.4) 265 (13.0) 267 (13.1) 267 (13.1) 0.950 (Continued to the next page)
cardiovascular events after adjusting for age, sex, duration of diabetes mellitus, BMI, smoking status, alcohol drinking sta- tus, fasting plasma glucose, use of any BP lowering treatments, use of any blood glucose lowering treatments and use of any lipid lowering treatments (model I). Patients in the highest quintile of SBP SD had a 29% higher risk of CVD compared with the lowest quintile (hazard ratio [HR], 1.29; 95% confi- dence interval [CI], 1.06 to 1.57). After additional adjustment for mean SBP during the measurement period (model 2), the
corresponding HR for the highest quintile versus lowest was 1.24 (95% CI, 1.01 to 1.52), and the trend remained significant (P for trend <0.001). The results did not significantly change when we modeled the other four VVV SBP parameters. A similar but statistically nonsignificant association was ob- served between SD DBP and the risk of CVD (Q5 vs. Q1: HR, 1.22; 95% CI, 0.99 to 1.50) (Table 3). The results of BPV mod- eled as a continuous variable in different ranges of SBP and DBP are listed in Supplementary Table 4.
Characteristic Total SD of SBP
Quintile 1 (<4.51 mm Hg)
SD of SBP Quintile 2 (≥4.51 and
<5.98 mm Hg)
SD of SBP Quintile 3 (≥5.98 and
<7.62 mm Hg)
SD of SBP Quintile 4 (≥7.62 and
<10.28 mm Hg)
SD of SBP Quintile 5 (≥10.28 mm Hg)
P value differencefor
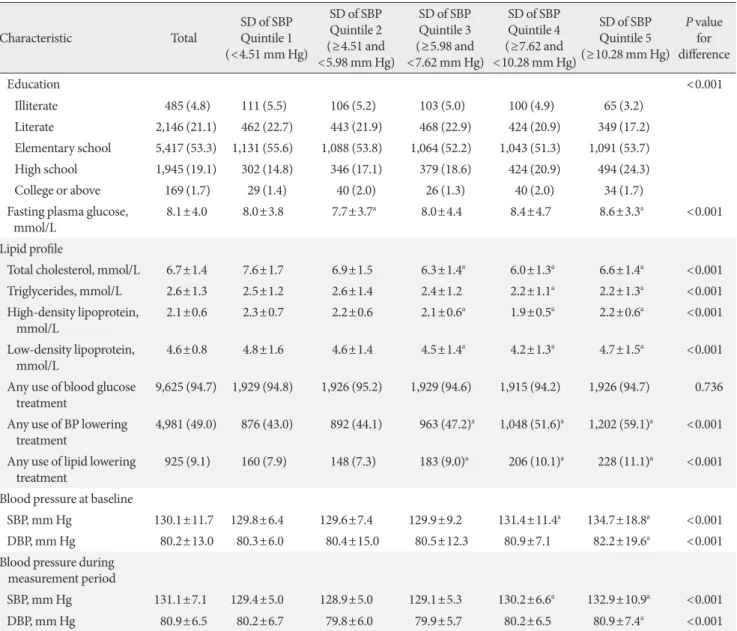
Education <0.001
Illiterate 485 (4.8) 111 (5.5) 106 (5.2) 103 (5.0) 100 (4.9) 65 (3.2)
Literate 2,146 (21.1) 462 (22.7) 443 (21.9) 468 (22.9) 424 (20.9) 349 (17.2) Elementary school 5,417 (53.3) 1,131 (55.6) 1,088 (53.8) 1,064 (52.2) 1,043 (51.3) 1,091 (53.7) High school 1,945 (19.1) 302 (14.8) 346 (17.1) 379 (18.6) 424 (20.9) 494 (24.3)
College or above 169 (1.7) 29 (1.4) 40 (2.0) 26 (1.3) 40 (2.0) 34 (1.7)
F asting plasma glucose,
mmol/L 8.1±4.0 8.0±3.8 7.7±3.7a 8.0±4.4 8.4±4.7 8.6±3.3a <0.001
Lipid profile
Total cholesterol, mmol/L 6.7±1.4 7.6±1.7 6.9±1.5 6.3±1.4a 6.0±1.3a 6.6±1.4a <0.001
Triglycerides, mmol/L 2.6±1.3 2.5±1.2 2.6±1.4 2.4±1.2 2.2±1.1a 2.2±1.3a <0.001
High-density lipoprotein,
mmol/L 2.1±0.6 2.3±0.7 2.2±0.6 2.1±0.6a 1.9±0.5a 2.2±0.6a <0.001
Low-density lipoprotein,
mmol/L 4.6±0.8 4.8±1.6 4.6±1.4 4.5±1.4a 4.2±1.3a 4.7±1.5a <0.001
Any use of blood glucose
treatment 9,625 (94.7) 1,929 (94.8) 1,926 (95.2) 1,929 (94.6) 1,915 (94.2) 1,926 (94.7) 0.736 Any use of BP lowering
treatment 4,981 (49.0) 876 (43.0) 892 (44.1) 963 (47.2)a 1,048 (51.6)a 1,202 (59.1)a <0.001 Any use of lipid lowering
treatment 925 (9.1) 160 (7.9) 148 (7.3) 183 (9.0)a 206 (10.1)a 228 (11.1)a <0.001 Blood pressure at baseline
SBP, mm Hg 130.1±11.7 129.8±6.4 129.6±7.4 129.9±9.2 131.4±11.4a 134.7±18.8a <0.001
DBP, mm Hg 80.2±13.0 80.3±6.0 80.4±15.0 80.5±12.3 80.9±7.1 82.2±19.6a <0.001
Blood pressure during measurement period
SBP, mm Hg 131.1±7.1 129.4±5.0 128.9±5.0 129.1±5.3 130.2±6.6a 132.9±10.9a <0.001
DBP, mm Hg 80.9±6.5 80.2±6.7 79.8±6.0 79.9±5.7 80.2±6.5 80.9±7.4a <0.001
Values are presented as mean±standard deviation or number (%) unless otherwise indicated. Continuous variables were tested by ANOVA or Kruskal-Wallis test, and categorical variables were tested by chi-square test.
SD, standard deviation; SBP, systolic blood pressure; IQR, interquartile range; DBP, diastolic blood pressure.
aP<0.05 for post hoc analysis with SD of SBP quintile 1 as a reference.
Table 1. Continued
Fig. 2 shows that the VVV of SBP is an independent predic- tor of CVD across several sensitivity analyses, except when anal- yses were restricted to patients aged ≤60 years or patients with a maximum BP ≤130/80 mm Hg during the measurement pe- riod. When patients were classified into five groups (≤5 mm Hg,
n=2,769; 5.1 to 7.5 mm Hg, n=3,196; 7.6 to 10 mm Hg, n= 2,018;
10.1 to 15 mm Hg, n=1,668; and >15 mm Hg, n=512 for SD of SBP), the results showed that HRs for the 10.1 to 15 and >15 mm Hg groups were statistically significant (1.29 [95% CI, 1.03 to 1.61] and 1.56 [95% CI, 1.16 to 2.09], respectively), compared Table 2. HRs and 95% CIs for cardiovascular disease, associated with visit-to-visit SBP variability
Variable Model Ia Model IIb
Adjusted HR (95% CI) P for trend Adjusted HR (95% CI) P for trend
SD SBP, mm Hg <0.001 <0.001
Q1 (<4.51) 1.00 (reference) 1.00 (reference)
Q2 (≥4.51 and <5.98) 0.76 (0.60–1.02) 0.77 (0.61–1.03)
Q3 (≥5.98 and <7.62) 0.92 (0.74–1.15) 0.95 (0.76–1.18)
Q4 (≥7.62 and <10.28) 0.90 (0.72–1.12) 0.90 (0.72–1.12)
Q5 (≥10.28) 1.29 (1.06–1.57)c 1.24 (1.01–1.52)c
CV SBP, mm Hg <0.001 0.026
Q1 (<3.49) 1.00 (reference) 1.00 (reference)
Q2 (≥3.49 and <4.62) 0.77 (0.61–1.02) 0.79 (0.62–1.01)
Q3 (≥4.62 and <5.89) 0.96 (0.77–1.19) 0.98 (0.79–1.22)
Q4 (≥5.89 and <7.84) 0.89 (0.71–1.10) 0.90 (0.72–1.11)
Q5 (≥7.84) 1.24 (1.02–1.51)c 1.23 (1.01–1.50)c
VIM SBP, mm Hg 0.007 0.027
Q1 (<1.72) 1.00 (reference) 1.00 (reference)
Q2 (≥1.72 and <2.27) 0.74 (0.58–1.05) 0.79 (0.60–1.04)
Q3 (≥2.27 and <2.90) 0.93 (0.75–1.16) 0.95 (0.77–1.18)
Q4 (≥2.90 and <3.85) 0.89 (0.72–1.11) 0.91 (0.73–1.12)
Q5 (≥3.85) 1.20 (0.99–1.47) 1.20 (1.04–1.46)c
ARV SBP, mm Hg 0.031 0.025
Q1 (<4.00) 1.00 (reference) 1.00 (reference)
Q2 (≥4.00 and <5.71) 1.05 (0.84–1.30) 1.06 (0.85–1.32)
Q3 (≥5.71 and <7.63) 0.95 (0.76–1.19) 0.97 (0.77–1.21)
Q4 (≥7.63 and <10.57) 0.95 (0.77–1.19) 0.96 (0.77–1.20)
Q5 (≥10.57) 1.29 (1.06–1.58)c 1.24 (1.01–1.52)c
SV SBP, mm Hg 0.046 0.037
Q1 (<5.45) 1.00 (reference) 1.00 (reference)
Q2 (≥5.45 and <7.46) 0.94 (0.75–1.17) 0.96 (0.77–1.20)
Q3 (≥7.46 and <9.74) 0.86 (0.69–1.07) 0.89 (0.71–1.11)
Q4 (≥9.74 and <13.44) 0.88 (0.70–1.09) 0.89 (0.72–1.11)
Q5 (≥13.44) 1.26 (1.03–1.54)c 1.24 (1.01–1.52)c
HR, hazard ratio; CI, confidence interval; SBP, systolic blood pressure; SD, standard deviation; CV, coefficient of variation; VIM, variation inde- pendent of mean; ARV, absolute real variability; SV, successive variation.
aModel I included adjustment for age, sex, duration of diabetes mellitus, smoking status, alcohol drinking status, body mass index, baseline fast- ing plasma glucose, use of glucose treatment, use of antihypertensive treatment and use of lipid lowering treatment, bModel II included the same adjustment as Model I plus mean SBP during measurement period, cP<0.05 with Quintile 1 as reference.
with the lowest group (≤5 mm Hg). The results of the restricted cubic splines in the Cox regression models showed that the ad- verse effect reached significance when the SD of SBP was higher than approximately 9 mm Hg (Supplementary Fig. 1).
DISCUSSION
In the current study, we found positive associations between VVV of SBP and risk of CVD among T2DM patients. The as- sociations were consistent after multivariable adjustment and Table 3. HRs and 95% CIs for cardiovascular disease, associated with visit-to-visit DBP variability
Variable Model Ia Model IIb
Adjusted HR (95% CI) P for trend Adjusted HR (95% CI) P for trend
SD DBP, mm Hg 0.006 0.007
Q1 (<3.50) 1.00 (reference) 1.00 (reference)
Q2 (≥3.50 and <4.46) 1.01 (0.80–1.26) 1.01 (0.81–1.26)
Q3 (≥4.46 and <5.39) 0.92 (0.73–1.15) 0.92 (0.74–1.16)
Q4 (≥5.39 and <6.78) 1.08 (0.87–1.35) 1.09 (0.88–1.35)
Q5 (≥6.78) 1.23 (1.00–1.51)c 1.22 (0.99–1.50)
CV DBP, mm Hg 0.020 0.018
Q1 (<4.35) 1.00 (reference) 1.00 (reference)
Q2 (≥4.35 and <5.59) 1.11 (0.89–1.38) 1.11 (0.89–1.38)
Q3 (≥5.59 and <6.80) 1.01 (0.81–1.27) 1.02 (0.81–1.28)
Q4 (≥6.80 and <8.47) 1.03 (0.83–1.29) 1.04 (0.84–1.30)
Q5 (≥8.47) 1.24 (1.00–1.52)c 1.24 (1.01–1.53)c
VIM DBP, mm Hg 0.099 0.070
Q1 (<0.74) 1.00 (reference) 1.00 (reference)
Q2 (≥0.74 and <0.97) 1.01 (0.81–1.25) 1.01 (0.81–1.26)
Q3 (≥0.97 and <1.20) 1.02 (0.82–1.27) 1.03 (0.83–1.28)
Q4 (≥1.20 and <1.49) 0.99 (0.80–1.23) 1.01 (0.81–1.25)
Q5 (≥1.49) 1.11 (0.90–1.37) 1.12 (0.91–1.38)
ARV DBP 0.684 0.719
Q1 (<3.13) 1.00 (reference) 1.00 (reference)
Q2 (≥3.13 and <4.29) 1.11 (0.90–1.36) 1.11 (0.90–1.36)
Q3 (≥4.29 and <5.57) 0.92 (0.74–1.15) 0.92 (0.74–1.15)
Q4 (≥5.57 and <7.14) 0.92 (0.74–1.14) 0.92 (0.74–1.14)
Q5 (≥7.14) 1.12 (0.92–1.38) 1.12 (0.91–1.37)
SV DBP 0.183 0.194
Q1 (<4.25) 1.00 (reference) 1.00 (reference)
Q2 (≥4.25 and <5.67) 1.24 (0.99–1.54) 1.25 (0.99–1.54)
Q3 (≥5.67 and <7.07) 0.99 (0.79–1.24) 1.00 (0.80–1.25)
Q4 (≥7.07 and <9.06) 0.97 (0.78–1.21) 0.98 (0.78–1.22)
Q5 (≥9.06) 1.29 (1.05–1.58)c 1.28 (1.04–1.58)c
HR, hazard ratio; CI, confidence interval; DBP, diastolic blood pressure; SD, standard deviation; CV, coefficient of variation; VIM, variation in- dependent of mean; ARV, absolute real variability; SV, successive variation.
aModel I included adjustment for age, sex, duration of diabetes mellitus, smoking status, alcohol drinking status, body mass index, baseline fast- ing plasma glucose, use of glucose treatment, use of antihypertensive treatment and use of lipid lowering treatment, bModel II included the same adjustment as Model I plus mean DBP during measurement period, cP<0.05 with Quintile 1 as reference.
across several sensitivity analyses, demonstrating that VVV of SBP was an independent predictor of CVD incidence irrespec- tive of mean SBP values. The results of VVV of DBP were not consistent across sensitivity analyses. Our findings could pro- vide additional evidence for the prognostic value of VVV of BP for CVD events in diabetic patients.
A number of studies have evaluated the associations between VVV of BP and risk of CVD events. The majority of these stud- ies were conducted in the general population or patients with hypertension [22-27], and several studies also demonstrated the adverse effect of high VVV in diabetes [28-31]. Ohkuma et al. [14] used data from the Action in Diabetes and Vascular Diseases: Preterax and Diamicron Modified Release Con- trolled Evaluation-Observational study (ADVANCE-ON) and found that VVV in SBP improved risk prediction beyond pre- dictions using traditional risk factors, including mean SBP. A territory-wide retrospective cohort study among Chinese pri- mary care T2DM patients has identified that greater SBP vari- ability may increase the risk of all-cause CVD mortality [13], which is consistent with our results. Moreover, to our knowl- edge, this is the first study that presents the association be-
tween VVV of DBP and CVD events among Chinese T2DM patients. Significant associations were observed in the highest quintile of DBP compared with the lowest quintile when CV and SV were used. Additional studies are needed to confirm whether the VVV of DBP is a prognostic predictor of CVD and whether it can provide additional information beyond that provided by the VVV of SBP.
Our study found that CVD risk increased only in the highest quintile of VVV of SBP, and CVD risk was insignificantly lower in the second and third quintiles of VVV of SBP than in the first quintile (The survival curve stratified by quintiles of SD SBP was shown in Supplementary Fig. 2). Although the nonlineari- ty test for variability metrics of SBP did not reach statistical significance, this finding suggests that the relationship between BP variability and CVD may not be perfectly linear, which has been reported in several studies [22,32]. There may be a thresh- old effect for the impact of BPV, and further studies are needed to address this issue. When we classified patients into five groups by arbitrary SBP values, group 4 (10.1 to 15 mm Hg) and group 5 (>15 mm Hg) both had a higher risk of CVD com- pared with that of the lowest group (SD SBP <5 mm Hg), and Fig. 2. Hazard ratio (95% confidence interval [CI]) for cardiovascular disease of Q5 compared to Q1 of standard deviation of sys- tolic blood pressure (SBP) in different subgroups. Data were adjusted for sex, age, smoking status, alcohol drinking status, dura- tion of diabetes mellitus, body mass index, baseline fasting plasma glucose, use of blood glucose treatment, use of antihyperten- sive drugs, use of lipid lowering drugs and mean SBP values. Baseline low density lipoprotein cholesterol, high density lipoprotein cholesterol, total cholesterol, and triglycerides were further adjusted when patients without baseline lipid profiles were excluded.
BP, blood pressure; DM, diabetes mellitus.
group 5 had the highest risk. When we modeled SD SBP as a continuous variable in Supplementary Table 4, the results showed that every 1 SD of SBP increase (6.5 mm Hg) was asso- ciated with a 4% increase in the risk of CVD. The other four metrics (CV, VIM, ARV, SV) were also statistically significant when modeled as continuous variables. We also found that SBP variability was more closely associated with cerebrovascu- lar disease after stratification by disease subtypes (data not shown), but these findings merit further investigation because the number of ischemic heart disease cases was relatively small in this study.
Evidence for the association between diastolic BPV and CVD was limited and varied compared to the association of CVD and systolic BPV [33,34]. However, it has been reported that SBP is a more important prognostic factor than DBP in the middle-aged population [35,36]. In this study, we found that mean SBP during the measurement period had prognostic value, whereas mean DBP did not (data not shown). On the other hand, SBP was easier to accurately measure than DBP by using a mercury manometer [37]. Thus, we believe that VVV of SBP is a more robust prognostic indicator than VVV of DBP.
Although evidence for the detrimental effect of long-term SBP variability has been consistent, it has still not been applied in clinical practice [38]. Possible reasons may include the fol- lowing: the variability needs months or years to be assessed, and the metrics of VVV BP cannot be calculated easily. Our study showed that the adverse effect of VVV of SBP reached significance when the SD of SBP was used, which was consis- tent with the previous finding that the optimal target for SBP SD should be <10 mm Hg [13]. This finding might be used in clinical settings for BP control among T2DM patients, as pa- tients with diabetes usually have BP measurements taken in the hospital.
One possible mechanism of the association between SBP variability and CVD was reported as suboptimal BP control [39,40]. However, our results remained consistent after we re- stricted our analyses to patients with BP ≤140/90 mm Hg (n=6,555). This finding indicated that T2DM patients with a higher VVV of BP still had a higher risk of CVD even when BP values were under control. When the included patients were further restricted to those with SBP ≤130/80 mm Hg during the measurement period (n=1,480), no associations were observed between SD of SBP and CVD. Future studies with a large sample size are needed to validate this finding.
Arterial stiffness, endothelial dysfunction and coronary ar-
tery calcification have also been reported as potential explana- tions for the adverse effects of high VVV [41-45]. Faramawi et al. [43] reported that increased BP variability was associated with endothelial dysfunction, which accelerates atherosclero- sis, thus increasing the risk of CVD. Shimbo et al. [42] found that SDs of SBP were inversely associated with aortic distensi- bility. Unfortunately, information on vascular wall status was not available in the current study. Further studies are required to better underlie the mechanistic relationships.
Our study has several strengths, including the large sample size, BP variability measurements and the relatively long-term follow-up time. We used a rigorous inclusion criterion of at least eight visits to calculate BP variability because a recent me- ta-analysis reported that the number of visits used to quantify VVV of BP affects the magnitude of the VVV itself [46]. We also used five metrics to measure VVV of BP, which added to the robustness of our work. However, limitations of our study should be noted. First, causality cannot be concluded due to the natural limitation of the retrospective observational cohort design. Patient characteristics and clinical information collect- ed in this study were uploaded into the HIS in the past when patients were undergoing physical examinations or other health tests, which reduced the occurrence of recall bias. Fur- ther prospective studies are required to confirm our results.
Second, selection bias cannot be ruled out because we exclud- ed 3,167 patients due to irregular follow-up or missing BP val- ues. However, the baseline characteristics of patients who were excluded and of those who were included were similar; thus, the risk of selection bias of the current study is acceptable.
Third, there may be ascertainment bias of CVD because the accuracy of the Yinzhou HIS was not validated. This ascertain- ment bias could influence CVD events at baseline and during the follow-up period, especially for the patients who left Yinzhou district and did not return again, who could only be followed via telephone by local GPs. These patients were easily lost to follow-up. Fourth, information on patients’ adherence to treatment was not available in this study. However, because the frequency of visits to clinics somehow reflects the adher- ence to treatment, our inclusion of only patients with 8 or 9 BP readings reduced the heterogeneity of adherence to treatment to some extent. Fifth, data on potential cofounders, such as certain kind of anti-diabetic drugs, anti-hypertensive drugs and hemoglobin, were not available in the current study, which may limit the generalizability of our results. Finally, although the standard guideline for the BP measurement process was
consolidated between all clinics and hospitals as mentioned above, manual measurement using a mercury sphygmoma- nometer may cause more human error than measurements conducted by an automated device. Thus, the method of BP measurement may be a confounding factor of BPV and merits further investigation.
In summary, our study provides evidence to support the as- sociation between VVV of SBP and risk of CVD among T2DM patients, regardless of mean BP levels. Moreover, our findings confirmed that an optimal target for a VVV SD of SBP control might be <10 mm Hg. Future studies are required to explore the potential mechanism underlying the increased risk of CVD associated with increased VVV of SBP.
SUPPLEMENTARY MATERIALS
Supplementary materials related to this article can be found online at https://doi.org/10.4093/dmj.2018.0108.
CONFLICTS OF INTEREST
No potential conflict of interest relevant to this article was re- ported.
AUTHOR CONTRIBUTIONS
Conception or design: K.C., J.B.W.
Acquisition, analysis, or interpretation of data: H.B.L., Z.B.Y., D.L.
Drafting the work or revising: Z.B.Y., D.L., X.Y.C., P.W.Z., M.L.T., M.J.J.
Final approval of the manuscript: Z.B.Y., D.L., X.Y.C., P.W.Z., H.B.L., M.L.T., M.J.J., J.B.W., K.C.
ORCID
Zhe-Bin Yu https://orcid.org/0000-0001-9392-5624 Die Li https://orcid.org/0000-0003-2000-2372
Jian-Bing Wang https://orcid.org/0000-0002-5571-2174 Kun Chen https://orcid.org/0000-0003-1162-6896
ACKNOWLEDGMENTS
This study was partly supported by the Air Pollution and Health Research Center, Zhejiang University (Grant: 519600-
I21502). The funders had no role in the study design, data col- lection, data analysis, decision to publish or preparation of the manuscript.
REFERENCES
1. International Diabetes Federation. IDF diabetes atlas. 8th ed.
Brussels: International Diabetes Federation; 2017.
2. International Diabetes Federation Guideline Development Group. Global guideline for type 2 diabetes. Diabetes Res Clin Pract 2014;104:1-52.
3. American Diabetes Association. Standards of medical care in diabetes: 2015 abridged for primary care providers. Clin Dia- betes 2015;33:97-111.
4. Parati G, Ochoa JE, Salvi P, Lombardi C, Bilo G. Prognostic value of blood pressure variability and average blood pressure levels in patients with hypertension and diabetes. Diabetes Care 2013;36 Suppl 2:S312-24.
5. Stevens SL, Wood S, Koshiaris C, Law K, Glasziou P, Stevens RJ, McManus RJ. Blood pressure variability and cardiovascular disease: systematic review and meta-analysis. BMJ 2016;354:
i4098.
6. Grove JS, Reed DM, Yano K, Hwang LJ. Variability in systolic blood pressure: a risk factor for coronary heart disease? Am J Epidemiol 1997;145:771-6.
7. Rothwell PM, Howard SC, Dolan E, O’Brien E, Dobson JE, Dahlof B, Sever PS, Poulter NR. Prognostic significance of vis- it-to-visit variability, maximum systolic blood pressure, and episodic hypertension. Lancet 2010;375:895-905.
8. Lau KK, Wong YK, Teo KC, Chang RS, Chan KH, Hon SF, Wat KL, Cheung RT, Li LS, Siu CW, Tse HF. Long-term prognostic implications of visit-to-visit blood pressure variability in pa- tients with ischemic stroke. Am J Hypertens 2014;27:1486-94.
9. Wu Z, Jin C, Vaidya A, Jin W, Huang Z, Wu S, Gao X. Longitu- dinal patterns of blood pressure, incident cardiovascular events, and all-cause mortality in normotensive diabetic peo- ple. Hypertension 2016;68:71-7.
10. McMullan CJ, Lambers Heerspink HJ, Parving HH, Dwyer JP, Forman JP, de Zeeuw D. Visit-to-visit variability in blood pres- sure and kidney and cardiovascular outcomes in patients with type 2 diabetes and nephropathy: a post hoc analysis from the RENAAL study and the Irbesartan Diabetic Nephropathy Tri- al. Am J Kidney Dis 2014;64:714-22.
11. Kilpatrick ES, Rigby AS, Atkin SL. The role of blood pressure variability in the development of nephropathy in type 1 diabe-
tes. Diabetes Care 2010;33:2442-7.
12. Wang J, Shi X, Ma C, Zheng H, Xiao J, Bian H, Ma Z, Gong L.
Visit-to-visit blood pressure variability is a risk factor for all- cause mortality and cardiovascular disease: a systematic review and meta-analysis. J Hypertens 2017;35:10-7.
13. Wan EY, Fung CS, Yu EY, Fong DY, Chen JY, Lam CL. Associa- tion of visit-to-visit variability of systolic blood pressure with cardiovascular disease and mortality in primary care Chinese patients with type 2 diabetes: a retrospective population-based cohort study. Diabetes Care 2017;40:270-9.
14. Ohkuma T, Woodward M, Jun M, Muntner P, Hata J, Colagiuri S, Harrap S, Mancia G, Poulter N, Williams B, Rothwell P, Chalmers J; ADVANCE Collaborative Group. Prognostic value of variability in systolic blood pressure related to vascular events and premature death in type 2 diabetes mellitus: the ADVANCE-ON study. Hypertension 2017;70:461-8.
15. Hsieh YT, Tu ST, Cho TJ, Chang SJ, Chen JF, Hsieh MC. Visit- to-visit variability in blood pressure strongly predicts all-cause mortality in patients with type 2 diabetes: a 5·5-year prospec- tive analysis. Eur J Clin Invest 2012;42:245-53.
16. Hata J, Arima H, Rothwell PM, Woodward M, Zoungas S, An- derson C, Patel A, Neal B, Glasziou P, Hamet P, Mancia G, Poulter N, Williams B, Macmahon S, Chalmers J; ADVANCE Collaborative Group. Effects of visit-to-visit variability in sys- tolic blood pressure on macrovascular and microvascular com- plications in patients with type 2 diabetes mellitus: the AD- VANCE trial. Circulation 2013;128:1325-34.
17. Takao T, Kimura K, Suka M, Yanagisawa H, Kikuchi M, Kawa- zu S, Matsuyama Y. Relationships between the risk of cardio- vascular disease in type 2 diabetes patients and both visit-to- visit variability and time-to-effect differences in blood pressure.
J Diabetes Complications 2015;29:699-706.
18. Malik MO, Govan L, Petrie JR, Ghouri N, Leese G, Fischbacher C, Colhoun H, Philip S, Wild S, McCrimmon R, Sattar N, Lindsay RS; Scottish Diabetes Research Network Epidemiolo- gy Group. Ethnicity and risk of cardiovascular disease (CVD):
4.8 year follow-up of patients with type 2 diabetes living in Scotland. Diabetologia 2015;58:716-25.
19. Zheng PW, Wang JB, Zhang ZY, Shen P, Chai PF, Li D, Jin MJ, Tang ML, Lu HC, Lin HB, Chen K. Air pollution and hospital visits for acute upper and lower respiratory infections among children in Ningbo, China: a time-series analysis. Environ Sci Pollut Res Int 2017;24:18860-9.
20. Lin H, Zhang D, Shen P, Xu Z, Si Y, Tang X, Gao P. Abstract P166:
Multimorbidity and risk of mortality in China: results from the
Chinese Electronic Health Records Research in Yinzhou (CHERRY) Study. Circulation 2018;135(Suppl 1):AP166.
21. Revision Committee of China Hypertension Primary Care Management Guideline. Guideline for Chinese hypertension primary care management (2014 edition) [in Chinese]. China J Hypertens 2015;23:24-43.
22. Schutte R, Thijs L, Liu YP, Asayama K, Jin Y, Odili A, Gu YM, Kuznetsova T, Jacobs L, Staessen JA. Within-subject blood pressure level: not variability: predicts fatal and nonfatal out- comes in a general population. Hypertension 2012;60:1138-47.
23. Johansson JK, Niiranen TJ, Puukka PJ, Jula AM. Prognostic value of the variability in home-measured blood pressure and heart rate: the Finn-Home Study. Hypertension 2012;59:212-8.
24. Hata Y, Kimura Y, Muratani H, Fukiyama K, Kawano Y, Ashida T, Yokouchi M, Imai Y, Ozawa T, Fujii J, Omae T. Office blood pressure variability as a predictor of brain infarction in elderly hypertensive patients. Hypertens Res 2000;23:553-60.
25. Muntner P, Shimbo D, Tonelli M, Reynolds K, Arnett DK, Oparil S. The relationship between visit-to-visit variability in systolic blood pressure and all-cause mortality in the general population: findings from NHANES III, 1988 to 1994. Hyper- tension 2011;57:160-6.
26. Takao T, Matsuyama Y, Suka M, Yanagisawa H, Iwamoto Y. The combined effect of visit-to-visit variability in HbA1c and systol- ic blood pressure on the incidence of cardiovascular events in patients with type 2 diabetes. BMJ Open Diabetes Res Care 2015;3:e000129.
27. Ushigome E, Fukui M, Hamaguchi M, Senmaru T, Sakabe K, Tanaka M, Yamazaki M, Hasegawa G, Nakamura N. The coef- ficient variation of home blood pressure is a novel factor asso- ciated with macroalbuminuria in type 2 diabetes mellitus. Hy- pertens Res 2011;34:1271-5.
28. Tamura K, Azushima K, Umemura S. Day-by-day home-mea- sured blood pressure variability: another important factor in hypertension with diabetic nephropathy? Hypertens Res 2011;
34:1249-50.
29. Okada H, Fukui M, Tanaka M, Inada S, Mineoka Y, Nakanishi N, Senmaru T, Sakabe K, Ushigome E, Asano M, Yamazaki M, Hasegawa G, Nakamura N. Visit-to-visit variability in systolic blood pressure is correlated with diabetic nephropathy and atherosclerosis in patients with type 2 diabetes. Atherosclerosis 2012;220:155-9.
30. Sohn MW, Epstein N, Huang ES, Huo Z, Emanuele N, Stuken- borg G, Guihan M, Li J, Budiman-Mak E. Visit-to-visit systolic blood pressure variability and microvascular complications
among patients with diabetes. J Diabetes Complications 2017;
31:195-201.
31. Juhanoja EP, Niiranen TJ, Johansson JK, Puukka PJ, Thijs L, Asayama K, Langen VL, Hozawa A, Aparicio LS, Ohkubo T, Tsuji I, Imai Y, Stergiou GS, Jula AM, Staessen JA; International Database on Home Blood Pressure in Relation to Cardiovascu- lar Outcome (IDHOCO) Investigators. Outcome-driven thresholds for increased home blood pressure variability. Hy- pertension 2017;69:599-607.
32. Muntner P, Whittle J, Lynch AI, Colantonio LD, Simpson LM, Einhorn PT, Levitan EB, Whelton PK, Cushman WC, Louis GT, Davis BR, Oparil S. Visit-to-visit variability of blood pres- sure and coronary heart disease, stroke, heart failure, and mor- tality: a cohort study. Ann Intern Med 2015;163:329-38.
33. Hughes MD, Pocock SJ. Within-subject diastolic blood pres- sure variability: implications for risk assessment and screening.
J Clin Epidemiol 1992;45:985-98.
34. Yeh CH, Yu HC, Huang TY, Huang PF, Wang YC, Chen TP, Yin SY. The risk of diabetic renal function impairment in the first decade after diagnosed of diabetes mellitus is correlated with high variability of visit-to-visit systolic and diastolic blood pressure: a case control study. BMC Nephrol 2017;18:99.
35. Franklin SS, Larson MG, Khan SA, Wong ND, Leip EP, Kannel WB, Levy D. Does the relation of blood pressure to coronary heart disease risk change with aging? The Framingham Heart Study. Circulation 2001;103:1245-9.
36. Mancia G, Facchetti R, Parati G, Zanchetti A. Visit-to-visit blood pressure variability, carotid atherosclerosis, and cardio- vascular events in the European Lacidipine Study on Athero- sclerosis. Circulation 2012;126:569-78.
37. Musini VM, Wright JM. Factors affecting blood pressure vari- ability: lessons learned from two systematic reviews of ran- domized controlled trials. PLoS One 2009;4:e5673.
38. Mehlum MH, Liestol K, Kjeldsen SE, Julius S, Hua TA, Roth- well PM, Mancia G, Parati G, Weber MA, Berge E. Blood pres-
sure variability and risk of cardiovascular events and death in patients with hypertension and different baseline risks. Eur Heart J 2018;39:2243-51.
39. Krakoff LR. Fluctuation: does blood pressure variability mat- ter? Circulation 2012;126:525-7.
40. Wijsman LW, de Craen AJ, Muller M, Sabayan B, Stott D, Ford I, Trompet S, Jukema JW, Westendorp RG, Mooijaart SP. Blood pressure lowering medication, visit-to-visit blood pressure variability, and cognitive function in old age. Am J Hypertens 2016;29:311-8.
41. Diaz KM, Veerabhadrappa P, Kashem MA, Feairheller DL, Sturgeon KM, Williamson ST, Crabbe DL, Brown MD. Rela- tionship of visit-to-visit and ambulatory blood pressure vari- ability to vascular function in African Americans. Hypertens Res 2012;35:55-61.
42. Shimbo D, Shea S, McClelland RL, Viera AJ, Mann D, New- man J, Lima J, Polak JF, Psaty BM, Muntner P. Associations of aortic distensibility and arterial elasticity with long-term visit- to-visit blood pressure variability: the Multi-Ethnic Study of Atherosclerosis (MESA). Am J Hypertens 2013;26:896-902.
43. Faramawi MF, Delongchamp R, Said Q, Jadhav S, Abouelenien S. Metabolic syndrome is associated with visit-to-visit systolic blood pressure variability in the US adults. Hypertens Res 2014;
37:875-9.
44. Su DF. Treatment of hypertension based on measurement of blood pressure variability: lessons from animal studies. Curr Opin Cardiol 2006;21:486-91.
45. Song H, Wei F, Liu Z, Zhao Y, Ye L, Lu F, Zhang H, Diao Y, Qi Z, Xu J. Visit-to-visit variability in systolic blood pressure: corre- lated with the changes of arterial stiffness and myocardial per- fusion in on-treated hypertensive patients. Clin Exp Hypertens 2015;37:63-9.
46. Veloudi P, Sharman JE. Methodological factors affecting quan- tification of blood pressure variability: a scoping review. J Hy- pertens 2018;36:711-9.
Supplementary Table 1. Measures of blood pressure variability
Metrics Definition Formula
SD Standard deviation
CV Coefficient of variation 100×SD/x
VIM Variation independent of mean k×SD/xm ARV Average real variability
SV Successive variation
n stands for the number of blood pressure measurements. xi stands for the blood pressure value for certain measurement.
) 1 (
) (
1
2
−
∑
−=
n x
n x
i i
∑
−= + −
−
1
1 1
1 1 n
i xi xi
n
1 2
1( 1 )
1 1
∑
−= + −
−
n
i xi xi
n
Supplementary Table 2. Baseline characteristics for included and excluded patients
Characteristic Included (n=10,163) Excluded (n=4,004)
Age, yr 61.3±10.5 61.8±11.6
Female sex 6,185 (60.9) 2,551 (63.7)
Body mass index, kg/m2 24.1±2.6 23.8±3.4
Duration of diabetes mellitus, mo, median (IQR) 40.1 (9.3) 39.2 (7.4)
Smoking 2,373 (23.3) 909 (22.7)
Alcohol drinking 1,317 (13.0) 457 (11.4)
Education
Illiterate 485 (4.8) 218 (5.4)
Literate 2,146 (21.1) 863 (21.6)
Elementary school 5,417 (53.3) 1,996 (49.9)
High school 1,945 (19.1) 803 (20.1)
College or above 169 (1.7) 124 (3.1)
Fasting plasma glucose, mmol/L 8.1±4.0 8.0±3.0
Any use of blood glucose treatment 9,625 (94.7) 3,277 (81.8)
Any use of blood pressure lowering treatment 4,981 (49.0) 1,506 (37.6)
Any use of lipid lowering treatment 925 (9.1) 259 (6.5)
Blood pressure at baseline
SBP, mm Hg 130.1±11.7 130.5±11.5
DBP, mm Hg 80.2±13.0 80.5±7.13
Values are presented as mean±standard deviation or number (%) unless otherwise indicated.
IQR, interquartile range; SBP, systolic blood pressure; DBP, diastolic blood pressure.
Supplementary Table 3. Pearson’s correlation coefficients between mean SBP and VVV metrics
Metrics Mean SD CV VIM ARV SV
SBP
Mean 1.00
SD 0.83a 1.00
CV 0.63a 0.92a 1.00
VIM 0.57 0.89a 0.99a 1.00
ARV 0.77a 0.92a 0.85a 0.81a 1.00
SV 0.82a 0.97a 0.87a 0.82a 0.97a 1.00
DBP
Mean 1.00
SD 0.73a 1.00
CV 0.59a 0.95a 1.00
VIM 0.01 0.38a 0.60a 1.00
ARV 0.71a 0.96a 0.90a 0.36a 1.00
SV 0.73a 0.99a 0.93a 0.36a 0.98a 1.00
SBP, systolic blood pressure; VVV, visit-to-visit variability; SD, standard deviation; CV, coefficient of variation; VIM, variation independent of mean; ARV, absolute real variability; SV, successive variation; DBP, diastolic blood pressure.
aP<0.01.
Supplementary Table 4. HRs and 95% CIs for risk of cardiovascular disease per SD increment in blood pressure variability
Blood pressure variability metrics No.
of cases HR per SD increment
(95% CI) P value
In the range SD SBP <8 mm Hg 483
SD SBP 0.978 (0.676–1.415) 0.908
CV SBP 0.974 (0.692–1.371) 0.880
VIM SBP 0.974 (0.685–1.385) 0.884
ARV SBP 0.924 (0.722–1.183) 0.531
SV SBP 0.929 (0.658–1.311) 0.675
In the range SD SBP ≥8 mm Hg 411
SD SBP 1.063 (1.024–1.103) 0.001
CV SBP 1.084 (1.051–1.118) <0.001
VIM SBP 1.085 (1.053–1.117) <0.001
ARV SBP 1.055 (1.009–1.103) <0.001
SV SBP 1.048 (1.010–1.089) 0.014
In the range SD DBP <6 mm Hg 563
SD DBP 1.500 (0.559–4.029) 0.421
CV DBP 1.228 (0.737–2.045) 0.430
VIM DBP 1.232 (0.720–2.110) 0.446
ARV DBP 0.781 (0.462–1.320) 0.355
SV DBP 0.807 (0.335–1.948) 0.634
In the range SD DBP ≥6 mm Hg 331
SD DBP 1.021 (0.920–1.134) 0.690
CV DBP 1.059 (0.999–1.123) 0.052
VIM DBP 1.033 (1.012–1.055) 0.002
ARV DBP 1.038 (0.937–1.151) 0.474
SV DBP 1.030 (0.927–1.145) 0.583
HR, hazard ratio; CI, confidence interval; SD, standard deviation; SBP, systolic blood pressure; CV, coefficient of variation; VIM, variation independent of mean; ARV, ab- solute real variability; SV, successive variation; DBP, diastolic blood pressure.
Supplementary Fig. 1. Hazard ratio (HR) and 95% confidence interval (CI) for standard deviation (SD) of systolic blood pressure (SBP) with cardiovascular dis- ease by using restricted cubic splines with four knots placed at 5, 7.5, 10, 15 mm Hg. Data were adjusted for age, sex, smoking status, alcohol drinking status, dura- tion of diabetes mellitus, body mass index, usage of blood glucose treatment, usage of antihypertensive treatment, usage of lipid lowering treatment. The red line rep- resented HR and the blue lines represented 95% CIs.
2.0
1.5
1.0
0.5
Adjusted hazard ratio
0 5 10 15 20 25 30 SD of SBP
Supplementary Fig. 2. Kaplan-Meier curve of cardiovascular disease events ac- cording to the quintiles of standard deviation of systolic blood pressure.
1.0
0.9
0.8
0.7
Survival probability
0 400 800 1,200 1,600 2,000 2,400 2,800 3,200 3,600 Times in days
Quintile 1
SD of SBP Quintile 2 Quintile 3 Quintile 4 Quintile 5