INTRODUCTION
Tuberculosis (TB) mainly arising from Mycobacterium tuber-
culosis (M. tuberculosis) infection is respiratory tract infectiousdisease.
1Although it is curable, TB has become one of the
main infectious disease resulting in serious death worldwide.
2Recent World Health Organization report points out that about a third of the population worldwide has infected latent TB, but only 10% of individuals carrying the pathogen will suffer clini- cal symptoms.
3Moreover, twin studies found that the rate of two people suffering from TB in monozygotic twin pairs was significantly higher than in dizygotic twin pairs.
4Apart from the two evidences above, racial studies and family studies have also shown that genetic factors may have vital effect on the suscepti- bility of TB in individuals.
5-7In 2005, Pan, et al.
8found a new genetic locus on mouse, de- signated super-susceptibility to TB 1 (sst1), which mediates in- nate immunity in mouse TB models. Mouse gene, intracellular pathogen resistance-1 (Ipr1), which located in the sst1 region, might promote macrophage activities and enhance the ability of macrophages to fight against M. tuberculosis infection.
9,10The
Certain Polymorphisms in SP110 Gene Confer Susceptibility to Tuberculosis: A Comprehensive Review and Updated Meta-Analysis
Shuai Zhang
1, Xue-bin Wang
1, Ya-di Han
1, Chen Wang
1, Ye Zhou
1, and Fang Zheng
1,21Center for Gene Diagnosis, Zhongnan Hospital of Wuhan University, Wuhan, Hubei;
2Hubei Provincial Key Laboratory of Developmentally Originated Disease, Wuhan, Hubei, China.
Purpose: Numerous studies have assessed the association of SP110 gene variants with tuberculosis (TB), but the results were in-
consistent. Through a comprehensive review and meta-analysis, our study aimed to clarify the nature of genetic risks contributed by 11 polymorphisms for the development of TB.
Materials and Methods: Through searching PubMed, web of science, China National Knowledge Infrastructure (CNKI) databases,
a total of 11 articles including 13 independent studies were selected. The pooled odd ratios (ORs) along with their corresponding 95% confidence interval (CI) were estimated for allelic comparisons, additive model (homozygote comparisons; heterozygote comparisons), dominant model and recessive model. We also assessed the heterogeneity across the studies and publication bias.
Results: The results of combined analysis revealed a significantly increased risk of TB for single nucleotide polymorphism (SNP)
rs9061 in all five comparisons (allelic comparisons: OR=1.28, 95% CI=1.14–1.44, p<0.0001; homozygote comparisons: OR=2.84, 95%
CI=1.84–4.38, p<0.00001; heterozygote comparisons: OR=1.23, 95% CI=1.05–1.43, p=0.009; dominant model: OR=1.32, 95% CI=1.14–
1.53, p=0.0003; recessive model: OR=2.26, 95% CI=1.18–4.34, p=0.01). In subgroup analysis, the risk of TB associated with SNP rs9061 appeared to be increased. Moreover, increased risk of TB was also found in Asian subgroup of SNP rs11556887, while decreased risk of TB appeared in large sample size subgroup of SNP rs1135791. No significant association was observed between other SNPs and the risk of TB.
Conclusion: Our meta-analysis suggested that the variant of SNP rs9061 might be a risk factor for TB.
Key Words: Tuberculosis, Speckled 110 gene, polymorphism Yonsei Med J 2017 Jan;58(1):165-173
https://doi.org/10.3349/ymj.2017.58.1.165 pISSN: 0513-5796 · eISSN: 1976-2437
Received: January 5, 2016 Revised: January 14, 2016 Accepted: June 2, 2016
Corresponding author: Dr. Fang Zheng, Center for Gene Diagnosis, Zhongnan Hospital of Wuhan University, Donghu Road 169#, Wuchang District, Wuhan 430071, Hubei, China.
Tel: 86-2767813233, Fax: 86-2767811832, E-mail: [email protected]
•The authors have no financial conflicts of interest.
© Copyright: Yonsei University College of Medicine 2017
This is an Open Access article distributed under the terms of the Creative Com- mons Attribution Non-Commercial License (http://creativecommons.org/licenses/
by-nc/3.0) which permits unrestricted non-commercial use, distribution, and repro- duction in any medium, provided the original work is properly cited.
Speckled 110 (SP110) gene in human holds 41% sequence ho- mology to the mouse Ipr1 gene.
11This gene is located on chro- mosome at 2q37.1 and encodes the SP110 nuclear body protein, which is a component of cellular structures.
12,13By participating in signal transmission processes between nuclear hormone receptors, SP110 protein could regulate the biological activity of macrophages and influence the growth and proliferation of
M. tuberculosis, which might be associated with the suscepti-bility to TB.
14-16Certain SP110 polymorphisms result in the change of amino acid, influencing the function of SP110 protein and then having an effect on the development of TB.
17Tosh, et al.
6first found that genetic variants in SP110 gene were associated with TB in West African population in 2006. Since then, increasing num- bers of researchers studied the relation between SP110 gene polymorphisms and TB. However, these studies yielded incon- sistent consequences. Abhimanyu, et al.,
12Cai, et al.,
18and Cong, et al.
19identified the association of SP110 polymorphisms with TB by a case-control design while irrelevant results were found by Png, et al.
20, Fox, et al.
21, and Jiang, et al.
22Thus, we performed a comprehensive review and updated meta-analysis with more SP110 polymorphisms, articles and subgroup analysis than be- fore, and attempted to verify and offer an accurate and compre- hensive understanding of the association between polymor- phisms of SP110 gene and human TB susceptibility.
MATERIALS AND METHODS
Search strategy
We searched the PubMed, web of science, and China National Knowledge Infrastructure (CNKI) databases for articles pub- lished from the earliest possible year to October 2015 by using the following keywords: ‘‘(tuberculosis or TB), (Speckled 110 gene or SP110), and (polymorphism or variant or genotype)’’.
Furthermore, we retrieved the bibliography of all available ar- ticles to find potential valuable studies. If the article described the analytical results of different ethnicities or diseases, we re- garded it as separate studies. We only searched the articles in English and Chinese.
Inclusion/exclusion criteria
The studies, included in the meta-analysis, required to satisfy the following criteria: 1) case-control studies; 2) applications of stan- dardized diagnosis criteria of TB; and 3) providing data on alleles and genotypes for directly calculating the odds ratio (OR) and its 95% confidence interval (CI). The articles meeting one of the fol- lowing situations were excluded: 1) family studies; 2) reports with data of other SP110 polymorphisms; and 3) patients with other infective disease and immunosuppressive conditions. When multiple publications reported on the same or overlapping data, the most recent or complete study was selected.
Data extraction
Data was extracted independently from qualified articles by two authors according to a pre-determined extraction protocol with any divergence solved by discussion, eventually reaching a con- sensus in all items. For each study, the following information was collected: the first author’s name, publication year, ethnicity, source of controls, sample sizes, TB diagnosis criteria, genotyp- ing methods, distributions and frequencies of alleles and geno- types for each polymorphism among cases and controls, and re- sults of Hardy-Weinberg equilibrium (HWE) in controls.
Quality score assessment
Two authors assessed independently the quality of each study using the quality scoring criteria modified from previous stud- ies.
23-27The criteria contained nine questions including repre- sentative cases, diagnoses of TB cases, tests for HWE, etc. The answers to every problem were divided into three levels, setting as 2 scores, 1 score, and 0 score (Supplementary Table 1, only online). Quality scores appeared in the range of 0 point (worst) to 17 points (best). Studies scoring higher than 14 points were classified as high quality studies. The quality score of each study is shown in Supplementary Table 2, only online.
Statistical analysis
Firstly, HWE test of each polymorphism among studies was performed in control groups using the chi-squared test when genotype data were provided fully and a p value of more than 0.05 was considered significant equilibrium. Secondly, linkage disequilibrium plots were constructed by the Haploview v. 4.2.
Thirdly, the association between SP110 gene polymorphisms and the TB risk was evaluated by ORs with 95% CIs for alleles and genotypes comparisons. The pooled ORs along with their corresponding 95% CIs were estimated for allelic comparison (C2 vs. C1), the additive model (homozygote comparisons:
C2C2 vs. C1C1; heterozygote comparisons C2C1 vs. C1C1), the dominant model (C2C2+C2C1 vs. C1C1), and the recessive model (C2C2 vs. C2C1+C1C1).
The heterogeneity was checked by chi-square-based Q-test
and I-squared test. A random-effect model
28was used to assess
the pooled ORs when I
2(%) >50%. Otherwise, a fixed-effect
model
29was adopted. Subgroup analyses were performed
when necessary, in accordance with the quality assessment
score, ethnicity and sample size. In addition, sensitivity analysis
was carried out to evaluate the stability of the results through a
sequential removal of each study or after excluding those stud-
ies that deviated from HWE. Publication bias was assessed for-
mally by Begg’s test
30and Egger’s test.
31All of the above analyses
were conducted using RevMan 5.2 (The Nordic Cochrane Cen-
tre, The Cochrane Collaboration) and STATA 12.0 (Stata, Col-
lege, TX, USA). The p value of 0.05 for any test or model was
considered to be statistically significant.
RESULTS
Eligible articles
A total of 143 relevant articles were primitively searched from PubMed, Web of Science, and CNKI databases. After first selec- tion, 103 articles were excluded because of unsuitable data.
Next, we carefully reviewed the full text of remaining studies.
Among these articles, 18 articles were designed on animal models; 6 articles were excluded because of the duplicated use of data; 5 articles were excluded because of no case-control de- sign. Two of the ultimately selected articles included data from 4 independent studies.
12,21Therefore, 11 articles including 13 studies were included in our meta-analysis, with 9 articles writ- ten in English and 2 in Chinese.
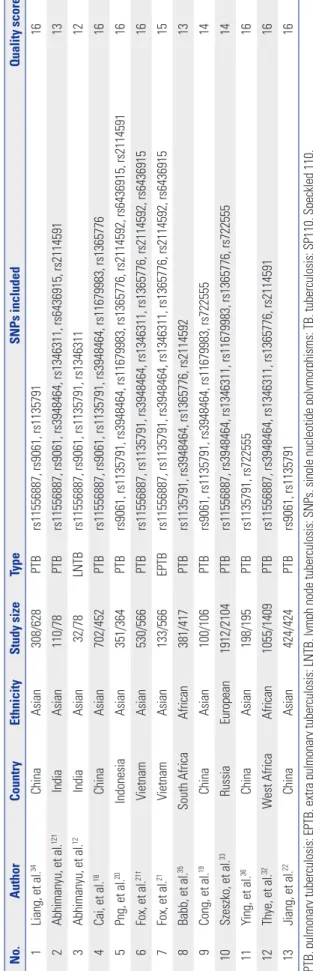
12,18-22,32-36The flowchart of article sifting is shown in Fig. 1, and the characteristics of all included studies are summarized in Table 1.
Study characteristics
If we could obtain the data of alleles and genotypes distributi- ons from three or more unduplicated studies for a certain poly- morphism, a meta-analysis was worth conducting. Therefore, a total of 11 polymorphisms in SP110 gene were studied, each of those included three or more studies. Their valuable data were abstracted (Supplementary Table 3, only online) and an- alyzed completely in this meta-analysis. In control groups, al- lele distributions of single nucleotide polymorphisms (SNPs) rs1135791, rs9061, rs1346311, and rs11679983, respectively de- viated the HWE in just one study.
19,32,34In terms of linkage dise- quilibrium plot (Supplementary Fig. 1, only online), we found that just two single nucleotide polymorphisms (SNPs rs722555 and rs6436915) were in strong linkage disequilibrium (r
2=0.85 in Chinese population; r
2=0.67 in European population) and formed a haplotype block in both Chinese and European pop-
Fig. 1. Flow diagram of the study search and selection.
11 qualified articles including 13 studies eligible for data extraction: 9 articles in English and 2 articles
in Chinese
103 articles excluded:
34 overlapped articles
30 articles with other polymorphism 2 articles with other diseases 21 articles with other reasons 16 review articles
29 articles excluded:
18 articles on animals
5 articles without case-control design 6 articles with duplicated data All retrieved articles from three databases (n=143)
Potentially relevant articles identified after the first selection (n=40)
Table 1. Characteristics of Selected Articles for Evaluating Associations of SP110 Gene Polymorphisms and TB Risk No.AuthorCountryEthnicityStudy sizeTypeSNPs includedQuality score* 1Liang, et al.34ChinaAsian308/628PTBrs11556887, rs9061, rs113579116 2Abhimanyu, et al.12†IndiaAsian110/78PTBrs11556887, rs9061, rs3948464, rs1346311, rs6436915, rs211459113 3Abhimanyu, et al.12IndiaAsian32/78LNTBrs11556887, rs9061, rs1135791, rs134631112 4Cai, et al.18ChinaAsian702/452PTBrs11556887, rs9061, rs1135791, rs3948464, rs11679983, rs136577616 5Png, et al.20IndonesiaAsian351/364PTBrs9061, rs1135791, rs3948464, rs11679983, rs1365776, rs2114592, rs6436915, rs211459116 6Fox, et al.21†VietnamAsian530/566PTBrs11556887, rs1135791, rs3948464, rs1346311, rs1365776, rs2114592, rs643691516 7Fox, et al.21VietnamAsian133/566EPTBrs11556887, rs1135791, rs3948464, rs1346311, rs1365776, rs2114592, rs643691515 8Babb, et al.35South AfricaAfrican381/417PTBrs1135791, rs3948464, rs1365776, rs211459213 9Cong, et al.19ChinaAsian100/106PTBrs9061, rs1135791, rs3948464, rs11679983, rs72255514 10Szeszko, et al.33RussiaEuropean1912/2104PTBrs11556887, rs3948464, rs1346311, rs11679983, rs1365776, rs72255514 11Ying, et al.36ChinaAsian198/195PTBrs1135791, rs72255516 12Thye, et al.32West AfricaAfrican1055/1409PTBrs11556887, rs3948464, rs1346311, rs1365776, rs211459116 13Jiang, et al.22ChinaAsian424/424PTBrs9061, rs113579116 PTB, pulmonary tuberculosis; EPTB, extra pulmonary tuberculosis; LNTB, lymph node tuberculosis; SNPs, single nucleotide polymorphisms; TB, tuberculosis; SP110, Speckled 110. *Quality scores ranged from 0 points (worst) to 17 points (best), studies scoring more than 14 points were classified as high quality, †We treat the article as two independent studies on account of having data of two kinds of TB.
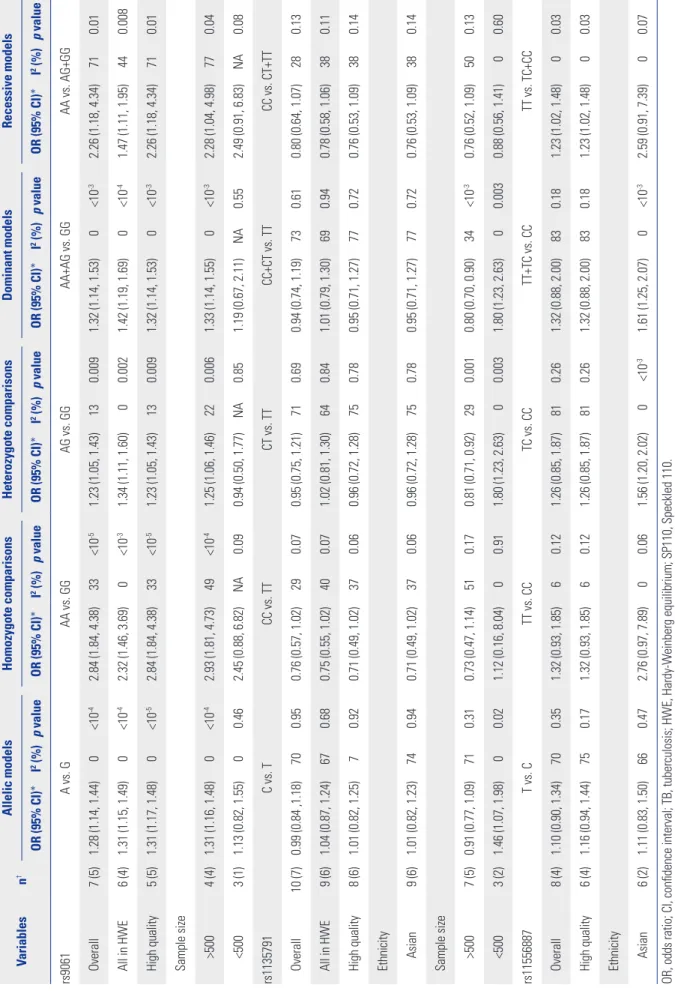
Table 2. Overall and Subgroup Analyses and Heterogeneity of SP110 Gene Polymorphisms with the Risk of TB Variablesn†Allelic modelsHomozygote comparisonsHeterozygote comparisonsDominant modelsRecessive models OR (95% CI)*I2 (%)p valueOR (95% CI)*I2 (%)p valueOR (95% CI)*I2 (%)p valueOR (95% CI)*I2 (%)p valueOR (95% CI)*I2 (%)p value rs9061 A vs. GAA vs. GGAG vs. GGAA+AG vs. GGAA vs. AG+GG Overall7 (5)1.28 (1.14, 1.44)0<10-42.84 (1.84, 4.38)33<10-51.23 (1.05, 1.43)130.0091.32 (1.14, 1.53)0<10-32.26 (1.18, 4.34)710.01 All in HWE6 (4)1.31 (1.15, 1.49)0<10-42.32 (1.46, 3.69)0<10-31.34 (1.11, 1.60)00.0021.42 (1.19, 1.69)0<10-41.47 (1.11, 1.95)440.008 High quality5 (5)1.31 (1.17, 1.48)0<10-52.84 (1.84, 4.38)33<10-51.23 (1.05, 1.43)130.0091.32 (1.14, 1.53)0<10-32.26 (1.18, 4.34)710.01 Sample size >5004 (4)1.31 (1.16, 1.48)0<10-42.93 (1.81, 4.73)49<10-41.25 (1.06, 1.46)220.0061.33 (1.14, 1.55)0<10-32.28 (1.04, 4.98)770.04 <5003 (1)1.13 (0.82, 1.55)00.462.45 (0.88, 6.82)NA0.090.94 (0.50, 1.77)NA0.851.19 (0.67, 2.11)NA0.552.49 (0.91, 6.83)NA0.08 rs1135791C vs. TCC vs. TTCT vs. TTCC+CT vs. TTCC vs. CT+TT Overall10 (7)0.99 (0.84 ,1.18)700.950.76 (0.57, 1.02)290.070.95 (0.75, 1.21)710.690.94 (0.74, 1.19)730.610.80 (0.64, 1.07)280.13 All in HWE9 (6)1.04 (0.87, 1.24)670.680.75 (0.55, 1.02)400.071.02 (0.81, 1.30)640.841.01 (0.79, 1.30)690.940.78 (0.58, 1.06)380.11 High quality8 (6)1.01 (0.82, 1.25)70.920.71 (0.49, 1.02)370.060.96 (0.72, 1.28)750.780.95 (0.71, 1.27)770.720.76 (0.53, 1.09)380.14 Ethnicity Asian9 (6)1.01 (0.82, 1.23)740.940.71 (0.49, 1.02)370.060.96 (0.72, 1.28)750.780.95 (0.71, 1.27)770.720.76 (0.53, 1.09)380.14 Sample size >5007 (5)0.91 (0.77, 1.09)710.310.73 (0.47, 1.14)510.170.81 (0.71, 0.92)290.0010.80 (0.70, 0.90)34<10-30.76 (0.52, 1.09)500.13 <5003 (2)1.46 (1.07, 1.98)00.021.12 (0.16, 8.04)00.911.80 (1.23, 2.63)00.0031.80 (1.23, 2.63)00.0030.88 (0.56, 1.41)00.60 rs11556887T vs. CTT vs. CCTC vs. CCTT+TC vs. CCTT vs. TC+CC Overall8 (4)1.10 (0.90, 1.34)700.351.32 (0.93, 1.85)60.121.26 (0.85, 1.87)810.261.32 (0.88, 2.00)830.181.23 (1.02, 1.48)00.03 High quality6 (4)1.16 (0.94, 1.44)750.171.32 (0.93, 1.85)60.121.26 (0.85, 1.87)810.261.32 (0.88, 2.00)830.181.23 (1.02, 1.48)00.03 Ethnicity Asian6 (2)1.11 (0.83, 1.50)660.472.76 (0.97, 7.89)00.061.56 (1.20, 2.02)0<10-31.61 (1.25, 2.07)0<10-32.59 (0.91, 7.39)00.07 OR, odds ratio; CI, confidence interval; TB, tuberculosis; HWE, Hardy-Weinberg equilibrium; SP110, Speckled 110. I2, value of I2 for heterogeneity test; p value, p value of the Z test for overall effect. *A random-effect model was used when I2 >50%; otherwise, a fixed-effect model was used, †Figure before the bracket is the number of studies for allele model; figure in the bracket is the number of studies for other four model.
ulations. Therefore, we selected one of them, namely SNP rs6436915, to conduct further analysis.
Comprehensive and subgroup analyses:
rs9061 polymorphisms
The results of combined analyses revealed a significantly in- creased risk of TB for SNP rs9061 in all the five comparisons (al- lelic comparison: OR=1.28, 95% CI=1.14–1.44, p<0.0001; homo-
zygote comparisons: OR=2.84, 95% CI=1.84–4.38, p< 0.00001;
heterozygote comparisons: OR=1.23, 95% CI=1.05–1.43,
p=0.009; the dominant model: OR=1.32, 95% CI=1.14–1.53, p=0.0003; and the recessive model: OR=2.26, 95% CI=1.18–4.34, p=0.01). Particularly, it should be pointed out that individualscarrying the mutant homozygote (AA) have as nearly three times risk of TB as ones carrying the wild homozygote (Table 2, Fig. 2).
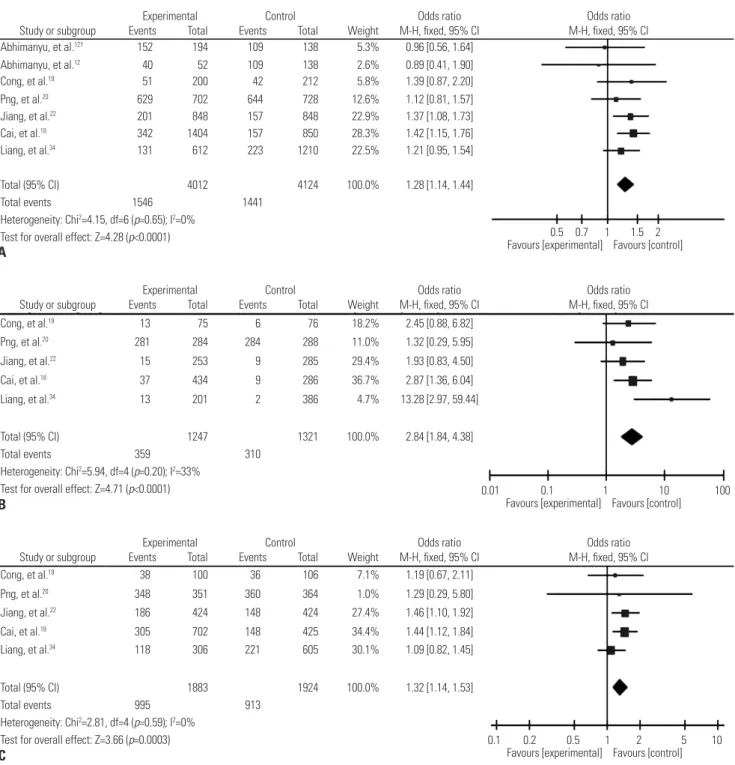
Fig. 2. Forest plot of pooled OR with 95% CI for association between SNP rs9061 and TB risk under the allelic model (A), homozygote comparisons (B), and the dominant model (C). The squares and horizontal lines correspond to the study-specific OR and 95% CI, respectively; the box size is propor- tional to the meta-analysis study weight; the diamond represents the pooled OR and 95% CI. †We treat the article as two independent studies on ac- count of having data of two kinds of TB. OR, odds ratio ; CI, confidence interval; SNP, single nucleotide polymorphisms; TB, tuberculosis.
Total (95% CI) 4012 4124 100.0% 1.28 [1.14, 1.44]
Total events 1546 1441
Heterogeneity: Chi2=4.15, df=6 (p=0.65); I2=0%
Test for overall effect: Z=4.28 (p<0.0001)
Liang, et al.34 131 612 223 1210 22.5% 1.21 [0.95, 1.54]
Cai, et al.18 342 1404 157 850 28.3% 1.42 [1.15, 1.76]
Jiang, et al.22 201 848 157 848 22.9% 1.37 [1.08, 1.73]
Png, et al.20 629 702 644 728 12.6% 1.12 [0.81, 1.57]
Cong, et al.19 51 200 42 212 5.8% 1.39 [0.87, 2.20]
Abhimanyu, et al.12 40 52 109 138 2.6% 0.89 [0.41, 1.90]
Abhimanyu, et al.12† 152 194 109 138 5.3% 0.96 [0.56, 1.64]
Experimental Control Odds ratio
Study or subgroup Events Total Events Total Weight M-H, fixed, 95% CI Odds ratio M-H, fixed, 95% CI
Favours [experimental] Favours [control]0.5 0.7 1 1.5 2 A
Total (95% CI) 1247 1321 100.0% 2.84 [1.84, 4.38]
Total events 359 310
Heterogeneity: Chi2=5.94, df=4 (p=0.20); I2=33%
Test for overall effect: Z=4.71 (p<0.0001)
Liang, et al.34 13 201 2 386 4.7% 13.28 [2.97, 59.44]
Cai, et al.18 37 434 9 286 36.7% 2.87 [1.36, 6.04]
Jiang, et al.22 15 253 9 285 29.4% 1.93 [0.83, 4.50]
Png, et al.20 281 284 284 288 11.0% 1.32 [0.29, 5.95]
Cong, et al.19 13 75 6 76 18.2% 2.45 [0.88, 6.82]
Favours [experimental] Favours [control]
0.01 0.1 1 10 100 B
Experimental Control Odds ratio
Study or subgroup Events Total Events Total Weight M-H, fixed, 95% CI
Odds ratio M-H, fixed, 95% CI
Total (95% CI) 1883 1924 100.0% 1.32 [1.14, 1.53]
Total events 995 913
Heterogeneity: Chi2=2.81, df=4 (p=0.59); I2=0%
Test for overall effect: Z=3.66 (p=0.0003)
Liang, et al.34 118 306 221 605 30.1% 1.09 [0.82, 1.45]
Cai, et al.18 305 702 148 425 34.4% 1.44 [1.12, 1.84]
Jiang, et al.22 186 424 148 424 27.4% 1.46 [1.10, 1.92]
Png, et al.20 348 351 360 364 1.0% 1.29 [0.29, 5.80]
Cong, et al.19 38 100 36 106 7.1% 1.19 [0.67, 2.11]
Favours [experimental] Favours [control]
0.1 0.2 0.5 1 2 5 10
C
Experimental Control Odds ratio
Study or subgroup Events Total Events Total Weight M-H, fixed, 95% CI Odds ratio M-H, fixed, 95% CI
When groups were stratified according to the sample size, significantly increased associations were found for large sam- ple size subgroups in all five models: (the allelic comparison:
OR=1.31, 95% CI=1.16–1.48, p<0.0001; the homozygote com- parison: OR=2.93, 95% CI=1.81–4.73, p<0.0001; the heterozy- gote comparison: OR=1.25, 95% CI=1.06–1.46, p=0.006; the dominant model: OR=1.33, 95% CI=1.14–1.55, p=0.0003; and the recessive model: OR=2.28, 95% CI=1.04–4.98, p= 0.04). All data are shown in Table 2.
In the subgroup analyses by the result of HWE test, signifi- cantly elevated risks were associated with SP110 polymor- phisms for allelic comparisons (OR=1.31, 95% CI=1.15–1.49,
p<0.0001), the homozygote comparison (OR=2.32, 95% CI=1.46–3.69, p= 0.0001), the heterozygote comparison (OR=1.34, 95%
CI=1.11–1.60, p=0.002), the dominant model (OR=1.42, 95%
CI=1.19–1.69, p<0.0001), and the recessive model (OR=1.47, 95%
CI= 1.11–1.95, p=0.008) (Table 2).
Additionally, we also found significantly elevated TB risks in high quality score subgroups in all genetic models. In addition, moderate heterogeneity existed in the overall analysis of the recessive model but disappeared in the HWE subgroups of the model. No significant heterogeneity was found in other four comparisons.
Comprehensive analysis: rs1135791 and rs11556887 polymorphisms
In this meta-analysis, no evident association between SNP rs1135791 polymorphisms and susceptibility of TB was iden- tified in all genetic models. Meanwhile, however, a significant positive correlation, was reached for the SNP rs1135791 in stud- ies with large sample sizes for the dominant model (OR=0.80, 95% CI=0.70–0.90, p=0.0004) and heterozygote comparison (OR=0.81, 95% CI=0.71–0.92, p=0.001). However, in smaller sample sizes, opposite but equally meaningful results were found in the dominant model (OR=1.80, 95% CI=1.23–2.63, p=
0.003) and the heterozygote comparison (OR=1.80, 95% CI=
1.23–2.63, p=0.003) (Table 2). For SNP rs11556887, the recessive model revealed a relation between this polymorphism and TB risk (OR=1.23, 95% CI=1.02–1.48, p=0.03). We further performed a stratified analysis among Asian subjects, and the synthe- sized results highlighted significant associations between this polymorphism and TB risk in the heterozygote comparison (OR=1.56, 95% CI=1.20–2.02, p=0.0008) and the dominant mod- el (OR=1.61, 95% CI=1.25–2.07, p=0.0002) (Table 2). In addi- tion, for SNPs rs1135791 and rs11556887, we identified mod- erate heterogeneity in the overall analyses of the allelic model, the heterozygote comparison and the dominant model. Nev- ertheless, heterogeneity decreased in HWE subgroups.
Meta-analysis: other seven SNP polymorphisms We find no evidence that could confirm the correlation of TB risk with seven other SNP polymorphisms in all genetic mod- els and subgroup analysis. The analytical results are shown in
Supplementary Table 4, only online.
Sensitivity and publication bias analysis
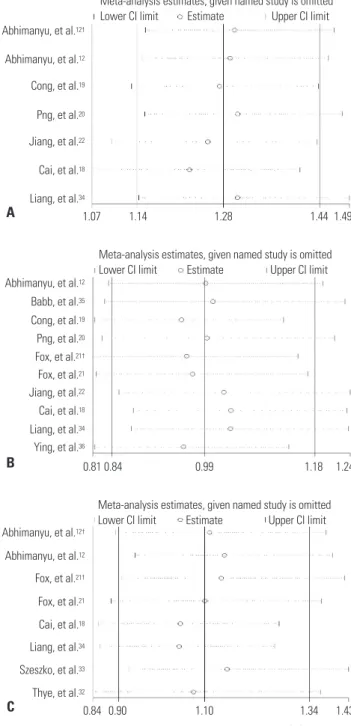
On the basis of allelic comparison, sensitivity analysis showed that there is just one article respectively influencing the result of this meta-analysis for SNPs rs3948464, rs11679983, and rs643 6915. For other SNPs, any selected study failed to observably change the pooled ORs, indicating the stability and reliability of our meta-analysis results. The results of the sensitivity analysis
Fig. 3. Sensitivity analyses on associations between rs9061 (A), rs1135791 (B), rs11556887 polymorphisms (C), and TB risk. Results were computed by omitting each study (left column) in turn. †We treat the article as two independent studies on account of having data of two kinds of TB. CI, confidence interval; TB, tuberculosis.
Abhimanyu, et al.12† Lower CI limit
1.07 1.14 1.28 1.44 1.49
Estimate Upper CI limit Meta-analysis estimates, given named study is omitted
Abhimanyu, et al.12 Cong, et al.19 Png, et al.20 Jiang, et al.22 Cai, et al.18 Liang, et al.34 A
Abhimanyu, et al.12 Lower CI limit
0.81 0.84 0.99 1.18 1.24
Estimate Upper CI limit Meta-analysis estimates, given named study is omitted
Babb, et al.35 Cong, et al.19 Png, et al.20
Jiang, et al.22 Fox, et al.21†
Fox, et al.21
Cai, et al.18 Liang, et al.34 Ying, et al.36 B
Abhimanyu, et al.12†
Abhimanyu, et al.12
Lower CI limit
0.84 0.90 1.10 1.34 1.43
Estimate Upper CI limit Meta-analysis estimates, given named study is omitted
Szeszko, et al.33 Thye, et al.32 Fox, et al.21†
Fox, et al.21 Cai, et al.18 Liang, et al.34
C
for SNPs rs9061, rs1135791, and rs11556887 are shown in Fig. 3.
Publication bias was evaluated by carrying out Begg’s and Eg- ger’s test. All p values for the Begg’s and Egger’s tests were greater than 0.05, proving the inexistence of publication bias.
DISCUSSION
TB is a complex disease, in which both genetic and environ- mental factors have a dramatically vital important effect.
37SP110 could affect the evolution of the body infected with TB by partic- ipating in signal transmission processes between nuclear hor- mone receptors and adjusting the biological activity of macro- phages, which could protect against TB. Concerning the effect of SP110 polymorphisms on TB, contradictory results were ob- served by previous studies. In the present study, meta-analysis was the priority selection in order to more accurately assess the effect of SNPs of SP110 on TB risk. Our meta-analysis identified that SNP rs9061 in SP110 gene could increase the susceptibility of TB, which may be a risk factor for the immunity of the body to TB. Recently, Lei, et al.
38collected data from 6 articles on five SP110 gene polymorphisms, and found no association between SP110 polymorphisms and TB risk. However, our present study is more comprehensive and persuasive in the following aspects:
first, we focused on a broader range of SP110 gene polymor- phisms (n=11); second, owing to relatively large study number, we conducted more subgroup analyses based on the result of HWE, ethnicities, quality assessment scores and sample sizes;
and third, our study doubled the number of relevant studies compared to previous meta-analysis. It is highly possible that there are some flaws in the process of previous meta-analysis, such as the accuracy of data extraction method and the exact number of articles included.
In the present meta-analysis, we observed that the minor allele A was associated with a 28% increased TB risk compared with the G allele. Considering that SNP rs9061 induces an ami- no acid change from glutamic acid to lysine at codon position 207 of SP110 protein, we hypothesized that this locus, trans- forming acidic amino acid to basic amino acid, may have a po- tential to alter the protein structure. Subsequent bioinformatics using Anthe-2000 software (Institute of Biology and Chemistry of Proteins, France).
39suggested that the A allele may result in obvious changes of α-helix and β-sheet in the secondary struc- ture of SP110 protein compared with the G allele. By predicting the potential functions of SNP rs6091 in the Mutation Taster database
40(http://www.mutationtaster.org/), we found that the minor allele A of SNP rs9061, which increased TB risk in this meta-analysis, may also lead to a splicing change of SP110.
These findings partially supported the above hypothesis.
Functional studies are required to elucidate the exact effects of SNP rs9061 on SP110 gene and TB risk.
When we assessed the associations of susceptible loci with complex disease like TB, large sample size in a study can in-
crease statistical power, avoid selection bias and consequently make the results more stable. In subgroup analyses stratified by sample size, statistically significant increase of TB risk relevant to the SNP rs9061 polymorphisms was identified in the large sample size subgroup. For SNP rs1135791 polymorphisms, a protective role of the T allele on the development of TB was dis- covered in the large sample size subgroup under the heterozy- gote comparison and the dominant model, which resembled the overall analytical result. However, an almost completely op- posite outcome was discerned in the small sample size sub- group with a pooled OR of 1.80. A small sample study with finite participants might have the probability to falsely estimate the association between SP110 variants and TB due to the selection bias of patients and controls.
41On the other hand, participants of studies were unable to represent overall situation of the pop- ulation, because both two studies of small sample size failed to detect the homozygote CC genotype. Furthermore, the result of subgroup analysis by ethnicities revealed that SNP rs11556887 polymorphism could increase the susceptibility to TB in Asian populations. Therefore, although it is well agreed that there ex- ist differences of polymorphisms between ethnicities, this result might also due to relatively small number of study.
In the present meta-analysis, we performed a sensitivity an- alysis for each study under the allele comparison of 11 SNPs.
The results showed that most studies failed to clearly change the pooled OR, suggesting the higher stability of our analytical results. However, two studies reported by Cong, et al.
19and Abhimanyu, et al.
12showed a great effect on the pooled OR of several SNPs. Specifically, in the study of Cong, et al.
19, the cal- culation of the pooled OR of SNPs rs3948464 and rs11679983 were transformed from a fixed-effect model. Similar influence was also identified in the study of Abhimanyu, et al.
12on the SNP rs6436915. Our careful review uncovered that, in the former study, SNPs rs3948464 and rs11679983 were genotyped by PCR-RFLP and ASA-PCR, respectively, while other six SNP polymorphisms were detected by NASP-PCR and DNA sequ- encing. The difference of genotyping method might affect the reliability of the result. The latter study selected only female patients with cervical tubercular lymphadenopathy to assess the association of SP110 polymorphisms with TB, thus not representing general situation of whole population. Selection of reliable genotyping method and widely representative pop- ulation play a vital effect on the quality of experimental result.
Although we obtained credible results by designing strict inclusion and exclusion criteria, and also by collecting compre- hensive literatures. However, our study has certain limitations.
First, we explored 11 polymorphisms of SP110, far less than the
number of reported SNPs associated with TB, thus being un-
able to fully profile the association of the entire SP110 gene and
the risk of TB. Second, in addition to genetic factors, psychoso-
cial factors and environmental factors also play an important
role in the occurrence of TB. However, because of the limitation
of data source, we did not analyze the interaction between these
factors and genetic factors. Third, although we performed sub- group analyses, moderate heterogeneity still existed in some subgroups.
In conclusion, our present results provide strong evidence that the variant of SNP rs9061 may be a dangerous factor to the development of TB. The result may be exploited to provide ge- netic advice for the prevention and treatment of TB. On the oth- er hand, however, the occurrence of TB is a complex process, in which multiple genes interact with environmental factors. To fully elucidate the effect of SP110 genes on its susceptibility to TB, we should further analyze the interaction of SP110 gene with other genes as well as environmental factors in the future.
REFERENCES
1. Sakamoto K. The pathology of Mycobacterium tuberculosis infec- tion. Vet Pathol 2012;49:423-39.
2. Dye C, Scheele S, Dolin P, Pathania V, Raviglione MC. Consensus statement. Global burden of tuberculosis: estimated incidence, prevalence, and mortality by country. WHO Global Surveillance and Monitoring Project. JAMA 1999;282:677-86.
3. Hill AV. Aspects of genetic susceptibility to human infectious dis- eases. Annu Rev Genet 2006;40:469-86.
4. Comstock GW. Tuberculosis in twins: a re-analysis of the Prophit survey. Am Rev Respir Dis 1978;117:621-4.
5. Stead WW, Senner JW, Reddick WT, Lofgren JP. Racial differences in susceptibility to infection by Mycobacterium tuberculosis. N Engl J Med 1990;322:422-7.
6. Tosh K, Campbell SJ, Fielding K, Sillah J, Bah B, Gustafson P, et al.
Variants in the SP110 gene are associated with genetic suscepti- bility to tuberculosis in West Africa. Proc Natl Acad Sci U S A 2006;
103:10364-8.
7. Möller M, Hoal EG. Current findings, challenges and novel ap- proaches in human genetic susceptibility to tuberculosis. Tuber- culosis (Edinb) 2010;90:71-83.
8. Pan H, Yan BS, Rojas M, Shebzukhov YV, Zhou H, Kobzik L, et al.
Ipr1 gene mediates innate immunity to tuberculosis. Nature 2005;
434:767-72.
9. Li N, Liu P, Wang L, Liu J, Yuan X, Meng W, et al. Effect of Ipr1 on expression levels of immune genes related to macrophage anti-in- fection of mycobacterium tuberculosis. Int J Clin Exp Med 2015;
8:3411-9.
10. Kramnik I. Genetic dissection of host resistance to Mycobacteri- um tuberculosis: the sst1 locus and the Ipr1 gene. Curr Top Mi- crobiol Immunol 2008;321:123-48.
11. Apt AS. Are mouse models of human mycobacterial diseases rel- evant? Genetics says: ‘yes!’. Immunology 2011;134:109-15.
12. Abhimanyu, Jha P, Jain A, Arora K, Bose M. Genetic association study suggests a role for SP110 variants in lymph node tuberculosis but not pulmonary tuberculosis in north Indians. Hum Immunol 2011;72:576-80.
13. Wu H, Wang Y, Zhang Y, Yang M, Lv J, Liu J, et al. TALE nickase-me- diated SP110 knockin endows cattle with increased resistance to tuberculosis. Proc Natl Acad Sci U S A 2015;112:E1530-9.
14. Zhou D, Li G. Nuclear body Sp110 and its biological functions. J Med Mol Biol 2006;4:271-4.
15. Bloch DB, Nakajima A, Gulick T, Chiche JD, Orth D, de La Monte SM, et al. Sp110 localizes to the PML-Sp100 nuclear body and may function as a nuclear hormone receptor transcriptional co- activator. Mol Cell Biol 2000;20:6138-46.
16. Castrillo A, Tontonoz P. Nuclear receptors in macrophage biology:
at the crossroads of lipid metabolism and inflammation. Annu Rev Cell Dev Biol 2004;20:455-80.
17. Bellamy R. Genetic susceptibility to tuberculosis. Clin Chest Med 2005;26:233-46.
18. Cai L, Deng SL, Liang L, Pan H, Zhou J, Wang MY, et al. Identifica- tion of genetic associations of SP110/MYBBP1A/RELA with pul- monary tuberculosis in the Chinese Han population. Hum Genet 2013;132:265-73.
19. Cong J, Li G, Zhou D, Tao Y, Xiong Y. [Study on relation between Sp110 gene polymorphism and tuberculosis genetic susceptibility of Chongqing Han People]. Wei Sheng Yan Jiu 2010;39:540-4.
20. Png E, Alisjahbana B, Sahiratmadja E, Marzuki S, Nelwan R, Adnan I, et al. Polymorphisms in SP110 are not associated with pulmonary tuberculosis in Indonesians. Infect Genet Evol 2012;12:1319-23.
21. Fox GJ, Sy DN, Nhung NV, Yu B, Ellis MK, Van Hung N, et al. Poly- morphisms of SP110 are associated with both pulmonary and extra- pulmonary tuberculosis among the Vietnamese. PLoS One 2014;9:
e99496.
22. Jiang SY, Li LL, Yue J, Chen WZ, Yang C, Wan CL, et al. The effects of SP110’s associated genes on fresh cavitary pulmonary tubercu- losis in Han Chinese population. Clin Exp Med 2016;16:219-25.
23. Persson C, Canedo P, Machado JC, El-Omar EM, Forman D. Poly- morphisms in inflammatory response genes and their associa- tion with gastric cancer: a HuGE systematic review and meta- analyses. Am J Epidemiol 2011;173:259-70.
24. Lu XC, Yu W, Tao Y, Zhao PL, Li K, Tang LJ, et al. Contribution of transforming growth factor α polymorphisms to nonsyndromic orofacial clefts: a HuGE review and meta-analysis. Am J Epidemi- ol 2014;179:267-81.
25. Liang J, Lin C, Hu F, Wang F, Zhu L, Yao X, et al. APC polymor- phisms and the risk of colorectal neoplasia: a HuGE review and meta-analysis. Am J Epidemiol 2013;177:1169-79.
26. Wu J, Liu J, Zhou Y, Ying J, Zou H, Guo S, et al. Predictive value of XRCC1 gene polymorphisms on platinum-based chemotherapy in advanced non-small cell lung cancer patients: a systematic re- view and meta-analysis. Clin Cancer Res 2012;18:3972-81.
27. Thakkinstian A, McEvoy M, Minelli C, Gibson P, Hancox B, Duffy D, et al. Systematic review and meta-analysis of the association be- tween {beta}2-adrenoceptor polymorphisms and asthma: a HuGE review. Am J Epidemiol 2005;162:201-11.
28. DerSimonian R, Kacker R. Random-effects model for meta-analy- sis of clinical trials: an update. Contemp Clin Trials 2007;28:105-14.
29. Lau J, Ioannidis JP, Schmid CH. Quantitative synthesis in system- atic reviews. Ann Intern Med 1997;127:820-6.
30. Begg CB, Mazumdar M. Operating characteristics of a rank corre- lation test for publication bias. Biometrics 1994;50:1088-101.
31. Egger M, Davey Smith G, Schneider M, Minder C. Bias in meta- analysis detected by a simple, graphical test. BMJ 1997;315:629-34.
32. Thye T, Browne EN, Chinbuah MA, Gyapong J, Osei I, Owusu-Da- bo E, et al. No associations of human pulmonary tuberculosis with Sp110 variants. J Med Genet 2006;43:e32.
33. Szeszko JS, Healy B, Stevens H, Balabanova Y, Drobniewski F, Todd JA, et al. Resequencing and association analysis of the SP110 gene in adult pulmonary tuberculosis. Hum Genet 2007;121:155-60.
34. Liang L, Zhao YL, Yue J, Liu JF, Han M, Wang H, et al. Association of SP110 gene polymorphisms with susceptibility to tuberculosis in a Chinese population. Infect Genet Evol 2011;11:934-9.
35. Babb C, Keet EH, van Helden PD, Hoal EG. SP110 polymorphisms are not associated with pulmonary tuberculosis in a South African population. Hum Genet 2007;121:521-2.
36. Ying X, Hui L, Yu HD, Jie L, Jing S, Long W, et al. Interaction of SP110 and VDR gene polymorphisms with environmental factors
in tuberculosis. J Reg Anat Oper Sorg 2013;04:377-9.
37. Russell DG, Barry CE 3rd, Flynn JL. Tuberculosis: what we don’t know can, and does, hurt us. Science 2010;328:852-6.
38. Lei X, Zhu H, Zha L, Wang Y. SP110 gene polymorphisms and tu- berculosis susceptibility: a systematic review and meta-analysis based on 10 624 subjects. Infect Genet Evol 2012;12:1473-80.
39. Deléage G, Combet C, Blanchet C, Geourjon C. ANTHEPROT: an integrated protein sequence analysis software with client/server
capabilities. Comput Biol Med 2001;31:259-67.
40. Schwarz JM, Cooper DN, Schuelke M, Seelow D. MutationTaster2:
mutation prediction for the deep-sequencing age. Nat Methods 2014;11:361-2.
41. Dechartres A, Trinquart L, Boutron I, Ravaud P. Influence of trial sample size on treatment effect estimates: meta-epidemiological study. BMJ 2013;346:f2304.