INTRODUCTION
Tuberculosis (TB) is one of the important leading causes of death in humans, and it remains a serious public health obsta- cle in the developing countries. It is estimated that 1.4 million people annually die due to this treatable disease and 9 million
incident cases of TB are estimated globally.1 According to the report, Mycobacterium tuberculosis (MTB) infect about one- third of population; however, only approximately one-tenth of those infected will ever develop active TB, which indicate that MTB infection is the result of the interplay between host ge- netic susceptibility and environmental factors.2
Interleukin-10 (IL-10) is a multifunctional regulatory cyto- kine of inflammatory responses. Increasing numbers of stud- ies3 have demonstrated that IL-10 acts as a general inhibitor of proliferative and cytokine responses of both T helper (Th) 1 and Th2 cells in vitro and in vivo. IL-10 plays an anti-inflam- matory action by suppressing the production of cytokines such as IL-1α, IL-1β, IL-6, IL-8, IL-12, and tumor necrosis factor-alpha in activated macrophage and interferon gamma in T cells. The IL-10 gene is located on chromosome 1 (1q31-1q32) with five exons. The promoter region of IL-10 gene has been found to be
IL-10 Polymorphisms and Tuberculosis Susceptibility:
An Updated Meta-Analysis
Zunqiong Ke1, Leyong Yuan2, Jun Ma3, Xiaoyan Zhang1, Yi Guo4, and Hui Xiong1
1Department of Pharmacy, Renmin Hospital, Hubei University of Medicine, Shiyan, Hubei Province;
2Department of Clinical Laboratory, Renmin Hospital of Wuhan University, Wuhan, Hubei Province;
3Department of Clinical Laboratory, Wuhan Medical Treatment Center, Wuhan, Hubei Province;
4Department of Epidemiology, Wuhan University School of Public Health, Wuhan, Hubei Province, P.R. China.
Purpose: The association of interleukin-10 (IL-10) polymorphisms (-1082G/A, -819C/T, -592A/C) and interleukin-6 (IL-6) poly- morphisms (-174G/C) with tuberculosis (TB) risk has been widely reported. However, the results are controversial. To clarify the role of these polymorphisms in TB, we performed a meta-analysis of all available and relevant published studies.
Materials and Methods: Based on comprehensive searches of the PubMed, Medline, Embase, Web of Science, Elsevier Science Direct and Cochrane Library database, we identified outcome data from all articles estimating the association between IL-10 and IL-6 polymorphisms and TB risk.
Results: The results indicated significant association of the allele model, heterozygous model and dominant model of IL-6 -174G/
C polymorphism with decreased risk of TB. In the stratified analysis by ethnicity, significantly increased risk was observed for IL- 10 -1082G/A polymorphism in Europeans under recessive model, for IL-10 -819C/T polymorphism in Asians under heterozygous model and dominant model and IL-10 -592A/C polymorphism in Asians under Allele model, homozygous model and recessive model. Moreover, significantly decreased risk of TB was associated with Asians for IL-6 -174C/G polymorphism in allele model, heterozygous model and dominant model. We also performed the analyses by sample types in IL-10 -1082G/A polymorphism, and observed significantly increased TB risk in mixed group under homozygous model.
Conclusion: The results suggested that the IL-10 -1082G/A polymorphism is associated with increased TB risk in Europeans, while IL-10 -819C/T and IL-10 -592A/C polymorphisms in Asians. However, IL-6 -174G/C polymorphism might be a genetic risk factor that decreases TB susceptibility in Asians.
Key Words: IL-10, IL-6, polymorphism, tuberculosis, susceptibility, meta-analysis Yonsei Med J 2015 Sep;56(5):1274-1287
http://dx.doi.org/10.3349/ymj.2015.56.5.1274 pISSN: 0513-5796 · eISSN: 1976-2437
Received: October 14, 2014 Revised: December 1, 2014 Accepted: December 15, 2014
Corresponding author: Dr. Hui Xiong, Department of Pharmacy, Renmin Hospi- tal, Hubei University of Medicine, 39 Chaoyang Mid-Road Shiyan, 442000, Hubei Province, P.R. China.
Tel: 86-719-8637114, Fax: 86-719-8666352, E-mail: [email protected]
•The authors have no financial conflicts of interest.
© Copyright: Yonsei University College of Medicine 2015
This is an Open Access article distributed under the terms of the Creative Com- mons Attribution Non-Commercial License (http://creativecommons.org/ licenses/
by-nc/3.0) which permits unrestricted non-commercial use, distribution, and repro- duction in any medium, provided the original work is properly cited.
highly polymorphic and its many polymorphisms have been identified.4 In the past few years, the impact of three common polymorphisms in the promoter of IL-10 gene -592A/C, -1082 G/A, and -819C/T on susceptibility to TB have been reported, and results suggested that these polymorphisms contribute to the risk of TB by affecting IL-10 transcription level, but the find- ings are controversial.
The human interleukin-6 (IL-6) gene is located at 7p21-24 locus with an upstream promoter containing 303 bp. IL-6 is a pleiotropic cytokine, secreted as a T-cell derived factor by a va- riety of cell types including lymphocytes, monocytes, and en- dothelial cells. It has endocrine as well as paracrine and auto- crine actions implicated in several physiologic and pathologic processes including immunity and inflammation, activation of fibroblasts, mast cells, endothelial cells, monocytes, and kera- tinocytes.5 Furthermore, the genetic polymorphism in the IL-6 promoter (-174G/C) that influences its transcription rate might play a crucial role in host immunity and susceptibility to TB.6
A relatively large number of studies found the association between IL-10 and IL-6 polymorphisms and TB risk, however, the results have been inconsistent and inconclusive due to limited sample sizes and different study populations. There- fore, we performed this meta-analysis on all eligible case-con- trol studies to estimate the effect of polymorphisms in the IL-10 and IL-6 genes on the risk of TB.
MATERIALS AND METHODS
Identification of relevant studies
Relevant publications were identified with a literature search using terms “IL-10” or “Interleukin-10” or “IL-6” or “Interleu- kin-6” and “tuberculosis” or “TB” or “TB infection” or “TB dis- ease” and “polymorphism” or “genotype” or “variant” in the PubMed, Medline, Embase, Web of Science, Elsevier Science Direct and Cochrane Library database (the last search update was 1 February 2014), and the search was limited to English- language journals. Additional studies were identified by a manual search of the references of original studies. The follow- ing criteria were used for inclusion in the analysis: 1) a case- control or cohort design was used and 2) studies contained available genotype frequencies. The major reasons for exclu- sion of studies were: no usable data were reported.
Data extraction and quality assessment
Two investigators independently extracted data and jointly reached a consensus on all of the studies researched. The fol- lowing data were collected from each study: first author’s name, publication year, original country, ethnicity, number of cases and controls, genotype frequencies for cases and con- trols, Hardy-Weinberg equilibrium (HWE) of controls and Newcastle-Ottawa Scale (NOS).7 Star symbol was used to de- note the quality, based on 3 aspects of the study: selection,
comparability, and exposure. Studies with a score of 7 stars or greater were considered to be of high quality.
Statistical analysis
The risks [odds ratios (ORs), and 95% confidence intervals (95%
CIs)] of TB associated with IL-10 and IL-6 polymorphisms were estimated for each study based on extracted genotype data. The statistical significance of the pooled OR was determined using the Z-test. Heterogeneity assumption was examined by the Cochran’s Q-test. If Q-test indicated p<0.10, thus indicating a lack of heterogeneity among studies, then the fixed effect mod- el was used (the Mantel-Haenszel method).8 Otherwise, the random-effects model (the DerSimonian and Laird method)9 was performed. Sensitivity analysis was mainly performed to assess the stability of the results, namely, a single study in the meta-analysis was deleted to reflect the influence of the indi- vidual data set on the pooled OR. Asymmetry funnel plots were inspected to assess potential publication bias. The Egger’s lin- ear regression test was also used to assess publication bias sta- tistically. All the above statistical analyses were performed by using the software Stata Version 12.0 (Stata Corporation, Col- lege Station, TX, USA) and p values were two-tailed.
RESULTS
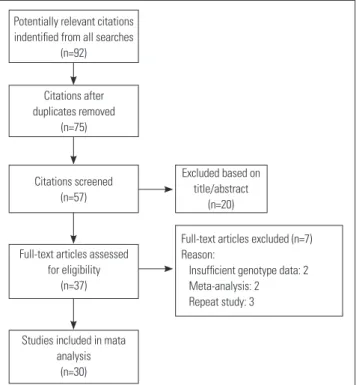
Literature search and characteristics of eligible studies The flow chart that displays the study selection process is shown in Fig. 1. The search of the selected databases retrieved 30 potentially relevant articles, including 7800 cases and 8793
Fig. 1. Flow diagram for study selection.
Potentially relevant citations indentified from all searches
(n=92)
Citations after duplicates removed
(n=75)
Citations screened (n=57)
Excluded based on title/abstract
(n=20)
Full-text articles assessed for eligibility
(n=37)
Full-text articles excluded (n=7) Reason:
Insufficient genotype data: 2 Meta-analysis: 2 Repeat study: 3
Studies included in mata analysis
(n=30)
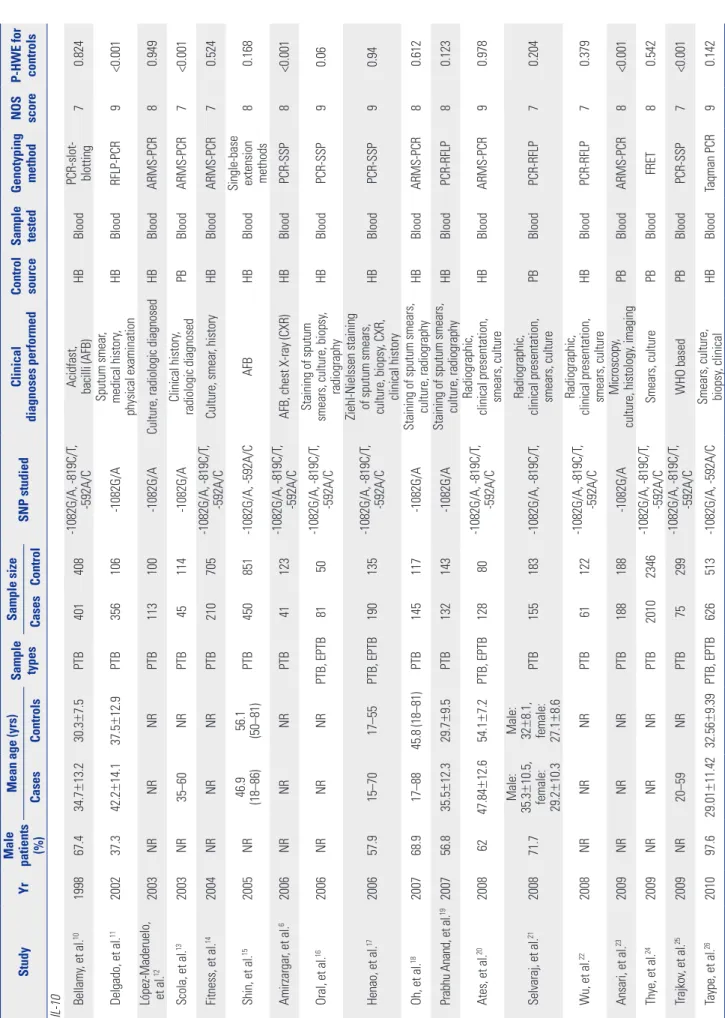
Table 1. Baseline Characteristics of the 30 Eligible Studies Included in This Meta-Analysis StudyYr
Male patients (%)
Mean age (yrs)
Sample types Sample size SNP studiedClinical diagnoses performed Control source Sample tested
Genotyping method
NOS score P-HWE for controls
CasesControlsCasesControl IL-10 Bellamy, et al.10199867.434.7±13.230.3±7.5PTB401408-1082G/A, -819C/T, -592A/C
Acidfast, bacilli (AFB)
HBBlood
PCR-slot- blotting
70.824 Delgado, et al.11200237.342.2±14.137.5±12.9PTB356106-1082G/ASputum smear, medical history, physical examinationHBBloodRFLP-PCR9<0.001 López-Maderuelo, et al.122003NRNRNRPTB113100-1082G/ACulture, radiologic diagnosedHBBloodARMS-PCR80.949 Scola, et al.132003NR35–60NRPTB45114-1082G/AClinical history, radiologic diagnosedPBBloodARMS-PCR7<0.001 Fitness, et al.142004NRNRNRPTB210705-1082G/A, -819C/T, -592A/CCulture, smear, historyHBBloodARMS-PCR70.524 Shin, et al.152005NR
46.9 (18–86) 56.1 (50–81)
PTB450851-1082G/A, -592A/CAFBHBBlood
Single-base extension methods
80.168 Amirzargar, et al.62006NRNRNRPTB41123-1082G/A, -819C/T, -592A/CAFB, chest X-ray (CXR)HBBloodPCR-SSP8<0.001 Oral, et al.162006NRNRNRPTB, EPTB8150-1082G/A, -819C/T, -592A/CStaining of sputum smears, culture, biopsy, radiographyHBBloodPCR-SSP90.06 Henao, et al.17200657.915–7017–55PTB, EPTB190135-1082G/A, -819C/T, -592A/C
Ziehl-Nielssen staining of sputum smears, culture, biopsy
, CXR, clinical historyHBBloodPCR-SSP90.94 Oh, et al.18200768.917–8845.8 (18–81)PTB145117-1082G/AStaining of sputum smears, culture, radiographyHBBloodARMS-PCR80.612 Prabhu Anand, et al.19200756.835.5±12.329.7±9.5PTB132143-1082G/AStaining of sputum smears, culture, radiographyHBBloodPCR-RFLP80.123 Ates, et al.2020086247.84±12.654.1±7.2PTB, EPTB12880-1082G/A, -819C/T, -592A/CRadiographic, clinical presentation, smears, cultureHBBloodARMS-PCR90.978 Selvaraj, et al.21200871.7Male: 35.3±10.5,
female: 29.2±10.3
Male: 32±8.1,
Radiographic, PTB155183-1082G/A, -819C/T,clinical presentation, PBBloodPCR-RFLP70.204 female: 27.1smears, culture ±8.6 Radiographic, -1082G/A, -819C/T, 22Wu, et al.2008NRNRNRPTB61122clinical presentation, HBBloodPCR-RFLP70.379 -592A/C smears, culture Microscopy,23Ansari, et al.2009NRNRNRPTB188188-1082G/APBBloodARMS-PCR8<0.001 culture, histology, imaging -1082G/A, -819C/T, 24Thye, et al.2009NRNRNRPTB20102346Smears, culturePBBloodFRET80.542 -592A/C -1082G/A, -819C/T, 25Trajkov, et al.2009NR20–59NRPTB75299WHO basedPBBloodPCR-SSP7<0.001 -592A/C 26Taype, et al.201097.629.01±11.4232.56±9.39PTB, EPTB626513-1082G/A, -592A/C
Smears, culture, biopsy
, clinicalHBBloodTaqman PCR90.142
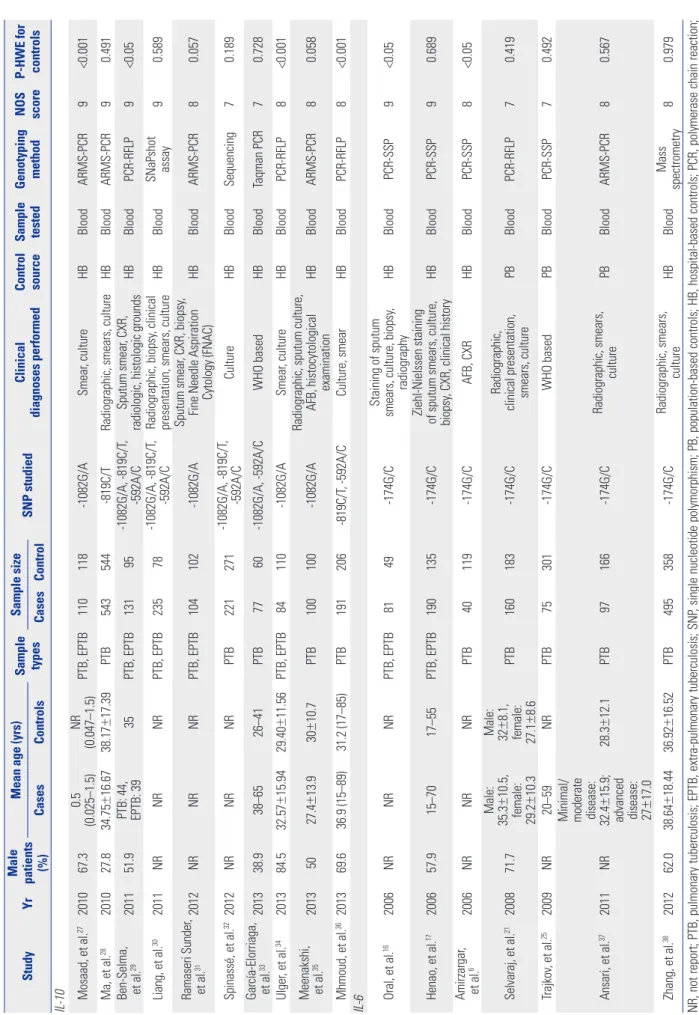
Table 1. Baseline Characteristics of the 30 Eligible Studies Included in This Meta-Analysis (Continued) StudyYr
Male patients (%)
Mean age (yrs)
Sample types Sample size SNP studiedClinical diagnoses performed Control source Sample tested
Genotyping method
NOS score P-HWE for controls
CasesControlsCasesControl IL-10 Mosaad, et al.27201067.30.5 (0.025–1.5)NR (0.047–1.5)PTB, EPTB110118-1082G/ASmear, cultureHBBloodARMS-PCR9<0.001 Ma, et al.28201027.834.75±16.6738.17±17.39PTB543544-819C/TRadiographic, smears, cultureHBBloodARMS-PCR90.491
Ben-Selma, et al.
29201151.9
PTB: 44, EPTB: 39
35PTB, EPTB13195-1082G/A, -819C/T, -592A/CSputum smear, CXR, radiologic, histologic groundsHBBloodPCR-RFLP9<0.05 Liang, et al.302011NRNRNRPTB, EPTB23578-1082G/A, -819C/T, -592A/CRadiographic, biopsy, clinical presentation, smears, cultureHBBloodSNaPshot assay90.589 Ramaseri Sunder, et al.312012NRNRNRPTB, EPTB104102-1082G/ASputum smear, CXR, biopsy, Fine Needle Aspiration Cytology (FNAC)HBBloodARMS-PCR80.057 Spinassé, et al.32 2012NRNRNRPTB221271-1082G/A, -819C/T, -592A/CCultureHBBloodSequencing70.189 García-Elorriaga, et al.33201338.938–6526–41PTB7760-1082G/A, -592A/CWHO basedHBBloodTaqman PCR70.728 Ulger, et al.34 201384.532.57±15.9429.40±11.56PTB, EPTB84110-1082G/ASmear,cultureHBBloodPCR-RFLP8<0.001
Meenakshi, et al.
35 20135027.4±13.930±10.7PTB100100-1082G/ARadiographic, sputum culture, AFB, histocytological examinationHBBloodARMS-PCR80.058 Mhmoud, et al.36 201369.636.9 (15–89)31.2 (17–85)PTB191206-819C/T, -592A/CCulture, smearHBBloodPCR-RFLP8<0.001 IL-6 Oral, et al.162006NRNRNRPTB, EPTB8149-174G/CStaining of sputum smears, culture, biopsy, radiographyHBBloodPCR-SSP9<0.05 Henao, et al.17200657.915–7017–55PTB, EPTB190135-174G/CZiehl-Nielssen staining
of sputum smears, culture, biopsy
, CXR, clinical historyHBBloodPCR-SSP90.689 Amirzargar, et al.62006NRNRNRPTB40119-174G/CAFB, CXRHBBloodPCR-SSP8<0.05 Selvaraj, et al.21200871.7Male: 35.3±10.5,
female: 29.2±10.3
Male: 32±8.1,
Radiographic, PTB160183-174G/Cclinical presentation, PBBloodPCR-RFLP70.419 female: 27.1smears, culture ±8.6 25Trajkov, et al.2009NR20–59NRPTB75301-174G/CWHO basedPBBloodPCR-SSP70.492 37Ansari, et al.2011NR
Minimal/ moderate disease: 32.4±15.9;
advanced disease: 27±17.0
28.3±12.1PTB97166-174G/CRadiographic, smears, culturePBBloodARMS-PCR80.567 Zhang, et al.38201262.038.64±18.4436.92±16.52PTB495358-174G/CRadiographic, smears, cultureHBBloodMass spectrometry80.979 NR, not report; PTB, pulmonary tuberculosis; EPTB, extra-pulmonary tuberculosis; SNP, single nucleotide polymorphism; PB, population-based controls; HB, hospital-based controls; PCR, polymerase chain reaction; SSP, sequence-specific primers; ARMS, amplification refractory mutation system; RFLP, restriction fragment length polymorphism; NOS, newcastle-ottawa scale; C, confirmed to HWE; HWE, Hardy-Weinberg equilib- rium.
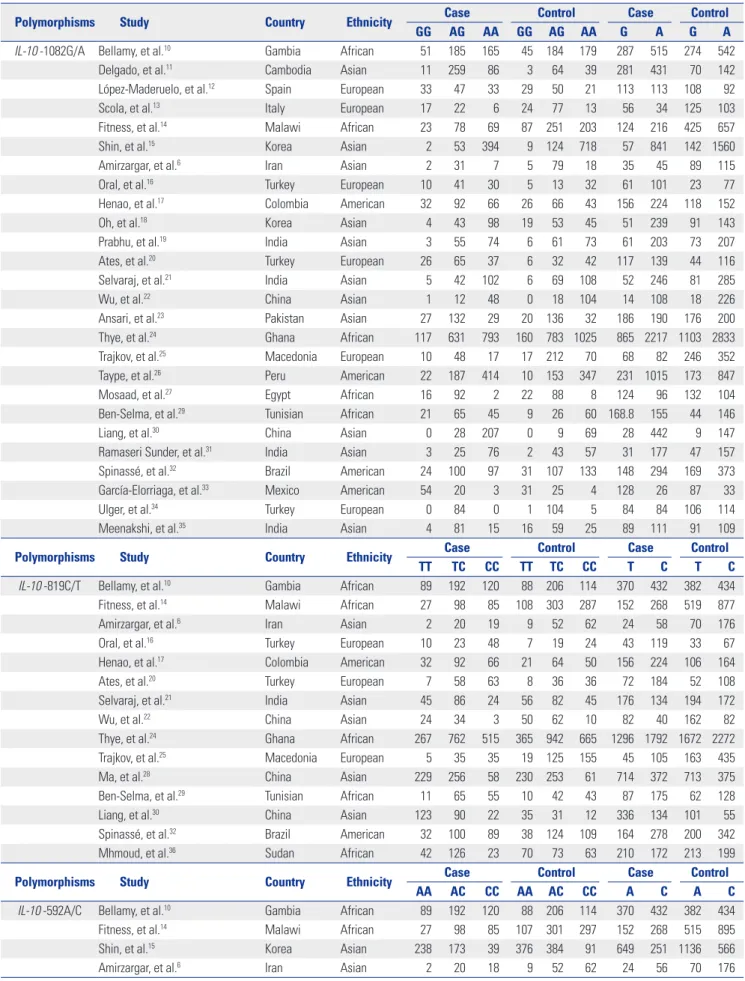
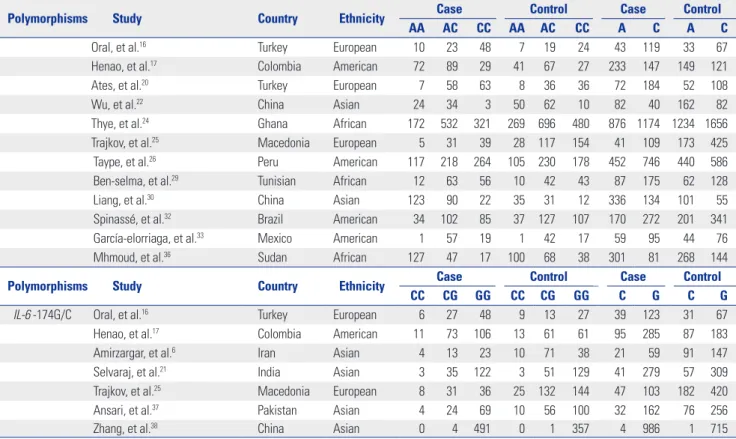
Table 2. Genotype and Allele Distributions of IL-10 and IL-6 Polymorphisms in Cases and Controls
Polymorphisms Study Country Ethnicity Case Control Case Control
GG AG AA GG AG AA G A G A
IL-10 -1082G/A Bellamy, et al.10 Gambia African 51 185 165 45 184 179 287 515 274 542
Delgado, et al.11 Cambodia Asian 11 259 86 3 64 39 281 431 70 142
López-Maderuelo, et al.12 Spain European 33 47 33 29 50 21 113 113 108 92
Scola, et al.13 Italy European 17 22 6 24 77 13 56 34 125 103
Fitness, et al.14 Malawi African 23 78 69 87 251 203 124 216 425 657
Shin, et al.15 Korea Asian 2 53 394 9 124 718 57 841 142 1560
Amirzargar, et al.6 Iran Asian 2 31 7 5 79 18 35 45 89 115
Oral, et al.16 Turkey European 10 41 30 5 13 32 61 101 23 77
Henao, et al.17 Colombia American 32 92 66 26 66 43 156 224 118 152
Oh, et al.18 Korea Asian 4 43 98 19 53 45 51 239 91 143
Prabhu, et al.19 India Asian 3 55 74 6 61 73 61 203 73 207
Ates, et al.20 Turkey European 26 65 37 6 32 42 117 139 44 116
Selvaraj, et al.21 India Asian 5 42 102 6 69 108 52 246 81 285
Wu, et al.22 China Asian 1 12 48 0 18 104 14 108 18 226
Ansari, et al.23 Pakistan Asian 27 132 29 20 136 32 186 190 176 200
Thye, et al.24 Ghana African 117 631 793 160 783 1025 865 2217 1103 2833
Trajkov, et al.25 Macedonia European 10 48 17 17 212 70 68 82 246 352
Taype, et al.26 Peru American 22 187 414 10 153 347 231 1015 173 847
Mosaad, et al.27 Egypt African 16 92 2 22 88 8 124 96 132 104
Ben-Selma, et al.29 Tunisian African 21 65 45 9 26 60 168.8 155 44 146
Liang, et al.30 China Asian 0 28 207 0 9 69 28 442 9 147
Ramaseri Sunder, et al.31 India Asian 3 25 76 2 43 57 31 177 47 157
Spinassé, et al.32 Brazil American 24 100 97 31 107 133 148 294 169 373
García-Elorriaga, et al.33 Mexico American 54 20 3 31 25 4 128 26 87 33
Ulger, et al.34 Turkey European 0 84 0 1 104 5 84 84 106 114
Meenakshi, et al.35 India Asian 4 81 15 16 59 25 89 111 91 109
Polymorphisms Study Country Ethnicity Case Control Case Control
TT TC CC TT TC CC T C T C
IL-10 -819C/T Bellamy, et al.10 Gambia African 89 192 120 88 206 114 370 432 382 434
Fitness, et al.14 Malawi African 27 98 85 108 303 287 152 268 519 877
Amirzargar, et al.6 Iran Asian 2 20 19 9 52 62 24 58 70 176
Oral, et al.16 Turkey European 10 23 48 7 19 24 43 119 33 67
Henao, et al.17 Colombia American 32 92 66 21 64 50 156 224 106 164
Ates, et al.20 Turkey European 7 58 63 8 36 36 72 184 52 108
Selvaraj, et al.21 India Asian 45 86 24 56 82 45 176 134 194 172
Wu, et al.22 China Asian 24 34 3 50 62 10 82 40 162 82
Thye, et al.24 Ghana African 267 762 515 365 942 665 1296 1792 1672 2272
Trajkov, et al.25 Macedonia European 5 35 35 19 125 155 45 105 163 435
Ma, et al.28 China Asian 229 256 58 230 253 61 714 372 713 375
Ben-Selma, et al.29 Tunisian African 11 65 55 10 42 43 87 175 62 128
Liang, et al.30 China Asian 123 90 22 35 31 12 336 134 101 55
Spinassé, et al.32 Brazil American 32 100 89 38 124 109 164 278 200 342
Mhmoud, et al.36 Sudan African 42 126 23 70 73 63 210 172 213 199
Polymorphisms Study Country Ethnicity Case Control Case Control
AA AC CC AA AC CC A C A C
IL-10 -592A/C Bellamy, et al.10 Gambia African 89 192 120 88 206 114 370 432 382 434
Fitness, et al.14 Malawi African 27 98 85 107 301 297 152 268 515 895
Shin, et al.15 Korea Asian 238 173 39 376 384 91 649 251 1136 566
Amirzargar, et al.6 Iran Asian 2 20 18 9 52 62 24 56 70 176
controls, according to inclusion and exclusion criteria. There are 26 case-control studies concerning IL-10 -1082G/A poly- morphism,6,10-27,29-35 15 case-control studies for IL-10 -819C/T polymorphism,6,10,14,16,17,20-22,24,25,28-30,32,36 16 case-control studies for IL-10 -592A/C polymorphism,6,10,14-17,20,21,24-26,29,30,32,33,36 and 7 case-control studies about IL-6 -174G/C polymorphism.
6,16,17,21,25,37,38 Among the 30 eligible studies, 14 of them were of Asians,6,11,15,18,19,21-23,28,30,31,35,37,38 6 studies were of Europe- ans,12,13,16,20,25,34 6 studies were of Africans,10,14,24,27,29,36 and 4 stud- ies were of Americans.17,26,32,33 The NOS scores ranged from 7 to 9, indicating that the methodological quality was generally good. The detailed characteristics of the eligible studies in- cluded in this meta-analysis are shown in Table 1, and the genotype and allele distributions of all four polymorphisms are shown in Table 2. The genotype distributions among the controls of all studies were consistent with the HWE except for eight studies for the IL-10 -1082G/A,6,11,13,23,25,27,29,34 one study for the IL-10 -819C/T,36 three studies for the IL-10 -592A/C,14,33,36 and two studies for the IL-6 -174G/C (Table 1).6,16
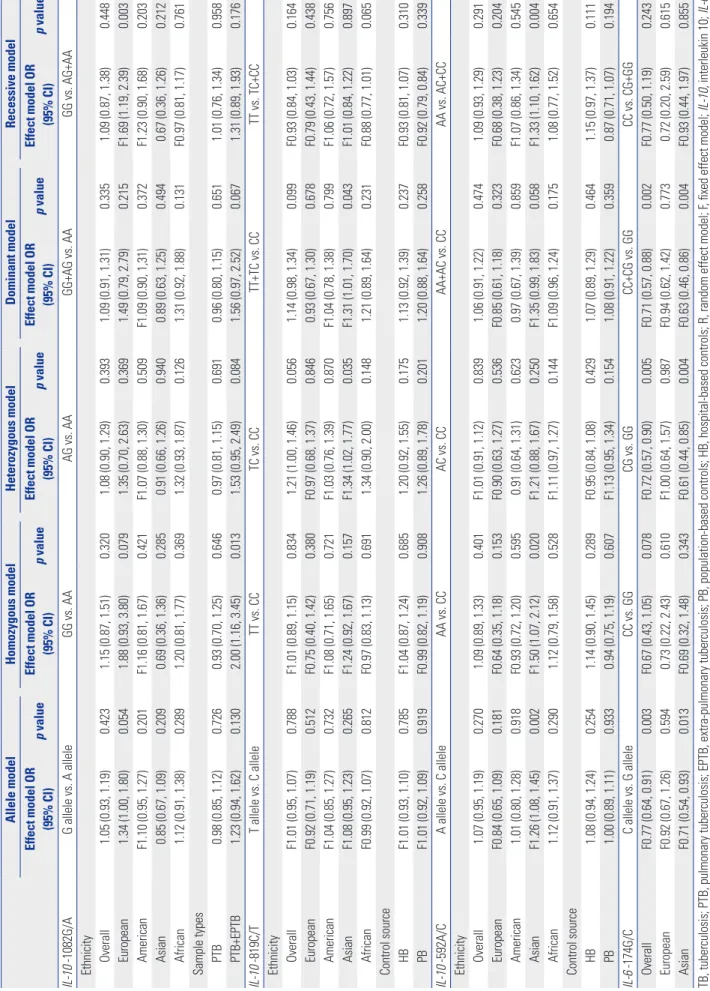
Quantitative synthesis
The summary of the meta-analysis for IL-10 -1082G/A, -819C/T, -592A/C, and IL-6 -174G/C polymorphisms and tuberculosis susceptibility is shown in Table 3.
Analysis of IL-10 -1082G/A and TB susceptibility In all, twenty-six studies consisted of 5949 cases and 6948 con-
trols, and assessed the potential influence of the IL-10 -1082G/
A polymorphism with TB susceptibility. Random effects mod- els were used to calculate the pooled OR in all genetic models.
Overall, the combined results showed no significant associa- tion in all genetic models (Fig. 2A-E). In the stratified analysis by ethnicity, IL-10 -1082G/A polymorphism was associated with a significantly increased risk of TB in European group un- der recessive model (GG vs. AG+AA: OR=1.69, 95% CI=1.19–
2.39). However, no significant association was found in Ameri- can, Asian and African populations in all tested models. On subgroup analysis by sample types, significantly increased TB risk was observed under homozygous model (GG vs. AA: OR=
2.00, 95% CI=1.16–3.45) in PTB and extra-pulmonary tubercu- losis (EPTB) mixed group. The results are shown in Table 3.
Analysis of IL-10 -819C/T and TB susceptibility
As for IL-10 -819C/T, there were fifteen studies involving 4207 cases and 5264 controls for data synthesis in our meta-analysis.
The results showed that IL-10 -819C/T polymorphism was not significantly associated with the risk of TB in all genetic models (Fig. 2F-J). In the stratified analyses by ethnicity and control source for the -819C/T polymorphism, a significantly increased risk was observed among Asians in heterozygous model and dominant model (TC vs. CC: OR=1.34, 95% CI=1.02–1.77;
TT+TC vs. CC: OR=1.31, 95% CI=1.01–1.70). The results are shown in Table 3.
Table 2. Genotype and Allele Distributions of IL-10 and IL-6 Polymorphisms in Cases and Controls (Continued)
Polymorphisms Study Country Ethnicity Case Control Case Control
AA AC CC AA AC CC A C A C
Oral, et al.16 Turkey European 10 23 48 7 19 24 43 119 33 67
Henao, et al.17 Colombia American 72 89 29 41 67 27 233 147 149 121
Ates, et al.20 Turkey European 7 58 63 8 36 36 72 184 52 108
Wu, et al.22 China Asian 24 34 3 50 62 10 82 40 162 82
Thye, et al.24 Ghana African 172 532 321 269 696 480 876 1174 1234 1656
Trajkov, et al.25 Macedonia European 5 31 39 28 117 154 41 109 173 425
Taype, et al.26 Peru American 117 218 264 105 230 178 452 746 440 586
Ben-selma, et al.29 Tunisian African 12 63 56 10 42 43 87 175 62 128
Liang, et al.30 China Asian 123 90 22 35 31 12 336 134 101 55
Spinassé, et al.32 Brazil American 34 102 85 37 127 107 170 272 201 341
García-elorriaga, et al.33 Mexico American 1 57 19 1 42 17 59 95 44 76
Mhmoud, et al.36 Sudan African 127 47 17 100 68 38 301 81 268 144
Polymorphisms Study Country Ethnicity Case Control Case Control
CC CG GG CC CG GG C G C G
IL-6 -174G/C Oral, et al.16 Turkey European 6 27 48 9 13 27 39 123 31 67
Henao, et al.17 Colombia American 11 73 106 13 61 61 95 285 87 183
Amirzargar, et al.6 Iran Asian 4 13 23 10 71 38 21 59 91 147
Selvaraj, et al.21 India Asian 3 35 122 3 51 129 41 279 57 309
Trajkov, et al.25 Macedonia European 8 31 36 25 132 144 47 103 182 420
Ansari, et al.37 Pakistan Asian 4 24 69 10 56 100 32 162 76 256
Zhang, et al.38 China Asian 0 4 491 0 1 357 4 986 1 715
IL-10, interleukin 10; IL-6, interleukin 6.
Table 3. Determination of the Genetic Effects of IL-10 and IL-6 Polymorphisms on TB and Subgroup Analysis Allele modelHomozygous modelHeterozygous modelDominant modelRecessive model Effect model OR (95% CI)p valueEffect model OR (95% CI)p valueEffect model OR (95% CI)p valueEffect model OR (95% CI)p valueEffect model OR (95% CI)p value IL-10 -1082G/AG allele vs. A alleleGG vs. AAAG vs. AAGG+AG vs. AAGG vs. AG+AA Ethnicity Overall1.05 (0.93, 1.19)0.4231.15 (0.87, 1.51)0.3201.08 (0.90, 1.29)0.3931.09 (0.91, 1.31)0.3351.09 (0.87, 1.38)0.448 European1.34 (1.00, 1.80)0.0541.88 (0.93, 3.80)0.0791.35 (0.70, 2.63)0.3691.49 (0.79, 2.79)0.215F1.69 (1.19, 2.39)0.003 AmericanF1.10 (0.95, 1.27)0.201F1.16 (0.81, 1.67)0.421F1.07 (0.88, 1.30)0.509F1.09 (0.90, 1,31)0.372F1.23 (0.90, 1.68)0.203 Asian0.85 (0.67, 1.09)0.2090.69 (0.36, 1.36)0.2850.91 (0.66, 1.26)0.9400.89 (0.63, 1.25)0.4940.67 (0.36, 1.26)0.212 African1.12 (0.91, 1.38)0.2891.20 (0.81, 1.77)0.3691.32 (0.93, 1.87)0.1261.31 (0.92, 1.88)0.131F0.97 (0.81, 1.17)0.761 Sample types PTB0.98 (0.85, 1.12)0.7260.93 (0.70, 1.25)0.6460.97 (0.81, 1.15)0.6910.96 (0.80, 1.15)0.6511.01 (0.76, 1.34)0.958 PTB+EPTB1.23 (0.94, 1.62)0.1302.00 (1.16, 3.45)0.0131.53 (0.95, 2.49)0.0841.56 (0.97, 2.52)0.0671.31 (0.89, 1.93)0.176 IL-10 -819C/TT allele vs. C alleleTT vs. CCTC vs. CCTT+TC vs. CCTT vs. TC+CC Ethnicity OverallF1.01 (0.95, 1.07)0.788F1.01 (0.89, 1.15)0.8341.21 (1.00, 1.46)0.0561.14 (0.98, 1.34)0.099F0.93 (0.84, 1.03)0.164 EuropeanF0.92 (0.71, 1.19)0.512F0.75 (0.40, 1.42)0.380F0.97 (0.68, 1.37)0.8460.93 (0.67, 1.30)0.678F0.79 (0.43, 1.44)0.438 AmericanF1.04 (0.85, 1.27)0.732F1.08 (0.71, 1.65)0.721F1.03 (0.76, 1.39)0.870F1.04 (0.78, 1.38)0.799F1.06 (0.72, 1.57)0.756 AsianF1.08 (0.95, 1.23)0.265F1.24 (0.92, 1.67)0.157F1.34 (1.02, 1.77)0.035F1.31 (1.01, 1.70)0.043F1.01 (0.84, 1.22)0.897 AfricanF0.99 (0.92, 1.07)0.812F0.97 (0.83, 1.13)0.6911.34 (0.90, 2.00)0.1481.21 (0.89, 1.64)0.231F0.88 (0.77, 1.01)0.065 Control source HBF1.01 (0.93, 1.10)0.785F1.04 (0.87, 1.24)0.6851.20 (0.92, 1.55)0.1751.13 (0.92, 1.39)0.237F0.93 (0.81, 1.07)0.310 PBF1.01 (0.92, 1.09)0.919F0.99 (0.82, 1.19)0.9081.26 (0.89, 1.78)0.2011.20 (0.88, 1.64)0.258F0.92 (0.79, 0.84)0.339 IL-10 -592A/CA allele vs. C alleleAA vs. CCAC vs. CCAA+AC vs. CCAA vs. AC+CC Ethnicity Overall1.07 (0.95, 1.19)0.2701.09 (0.89, 1.33)0.401F1.01 (0.91, 1.12)0.8391.06 (0.91, 1.22)0.4741.09 (0.93, 1.29)0.291 EuropeanF0.84 (0.65, 1.09)0.181F0.64 (0.35, 1.18)0.153F0.90 (0.63, 1.27)0.536F0.85 (0.61, 1.18)0.323F0.68 (0.38, 1.23)0.204 American1.01 (0.80, 1.28)0.918F0.93 (0.72, 1.20)0.5950.91 (0.64, 1.31)0.6230.97 (0.67, 1.39)0.859F1.07 (0.86, 1.34)0.545 AsianF1.26 (1.08, 1.45)0.002F1.50 (1.07, 2.12)0.020F1.21 (0.88, 1.67)0.250F1.35 (0.99, 1.83)0.058F1.33 (1.10, 1.62)0.004 African1.12 (0.91, 1.37)0.2901.12 (0.79, 1.58)0.528F1.11 (0.97, 1.27)0.144F1.09 (0.96, 1.24)0.1751.08 (0.77, 1.52)0.654 Control source HB1.08 (0.94, 1.24)0.2541.14 (0.90, 1.45)0.289F0.95 (0.84, 1.08)0.4291.07 (0.89, 1.29)0.4641.15 (0.97, 1.37)0.111 PB1.00 (0.89, 1.11)0.9330.94 (0.75, 1.19)0.607F1.13 (0.95, 1.34)0.1541.08 (0.91, 1.22)0.3590.87 (0.71, 1.07)0.194 IL-6 -174G/CC allele vs. G alleleCC vs. GGCG vs. GGCC+CG vs. GGCC vs. CG+GG OverallF0.77 (0.64, 0.91)0.003F0.67 (0.43, 1.05)0.078F0.72 (0.57, 0.90)0.005F0.71 (0.57, 0.88)0.002F0.77 (0.50, 1.19)0.243 EuropeanF0.92 (0.67, 1.26)0.5940.73 (0.22, 2.43)0.610F1.00 (0.64, 1.57)0.987F0.94 (0.62, 1.42)0.7730.72 (0.20, 2.59)0.615 AsianF0.71 (0.54, 0.93)0.013F0.69 (0.32, 1.48)0.343F0.61 (0.44, 0.85)0.004F0.63 (0.46, 0.86)0.004F0.93 (0.44, 1.97)0.855 TB, tuberculosis; PTB, pulmonary tuberculosis; EPTB, extra-pulmonary tuberculosis; PB, population-based controls; HB, hospital-based controls; R, random effect model; F, fixed effect model; IL-10, interleukin 10; IL-6, interleukin 6; CI, confidence interval; OR, odds ratio.
Analysis of IL-10 -592A/C and TB susceptibility
In total, sixteen studies including 4115 cases and 5441 controls examined the relationship between the IL-10 -592A/C poly- morphism and TB susceptibility. As shown in Table 3, we failed to find the association between the IL-10 -592A/C polymor-
phism and TB risk in all genetic models. In the stratified analy- ses for the IL-10 -592A/C polymorphism, a significantly in- creased risk was observed among Asians in allele model (A allele vs. C allele: OR=1.26, 95% CI=1.08–1.28), homozygous model (AA vs. CC: OR=1.50, 95% CI=1.07–2.12), and recessive Fig. 2. Forest plot of the overall risk of TB associated with the IL-10 -1082G/A and -819C/T polymorphism in all genetic models. Bars represent 95% CI and boxes represent OR values. The size of each box indicates the weight of the study in the pooled results. (A-E) Allele vs. A allele, GG vs. AA, AG vs. AA, GG+AG vs. AA, GG vs. AG+AA for -1082G/A. TB, tuberculosis; IL-10, interleukin 10; CI, confidence interval; OR, odds ratio.
A
C
E
B
D
model (AA vs. AC+CC: OR=1.33, 95% CI=1.10–1.62) (Table 3).
Analysis of IL-6 -174G/C and TB susceptibility
A total of 1138 cases and 1311 controls from seven case-control studies were included for data synthesis. A decreased risk be- tween IL-6 -174G/C polymorphism and the risk of TB was ob- served in Allele model (C allele vs. G allele: OR=0.77, 95%
CI=0.64–0.91), heterozygous model (CC vs. GG: OR=0.72, 95%
CI=0.57–0.90), and dominant genetic model (CC+CG vs. GG:
OR=0.71, 95% CI=0.57–0.88). In the stratified analysis by eth-
nicity, IL-6 -174G/C polymorphism was associated with a sig- nificantly decreased risk of TB in Asian populations in Allele model (C allele vs. G allele: OR=0.71, 95% CI=0.54–0.93), het- erozygous model (CC vs. GG: OR=0.61, 95% CI=0.44–0.85), and dominant genetic model (CC+CG vs. GG: OR=0.63, 95%
CI=0.46–0.86). The results are shown in Table 3.
Heterogeneity analysis
There were statistically significant heterogeneity in all genetic models for IL-10 -1082G/A polymorphism, heterozygous mod- Fig. 2. Forest plot of the overall risk of TB associated with the IL-10 -1082G/A and -819C/T polymorphism in all genetic models. Bars represent 95% CI and boxes represent OR values. The size of each box indicates the weight of the study in the pooled results. (F-J) T allele vs. C allele, TT vs. CC, TC vs. CC, TT+TC vs. CC, TT vs. TC+CC for -819C/T. TB, tuberculosis; IL-10, interleukin 10; CI, confidence interval; OR, odds ratio.
F
H
J
G
I
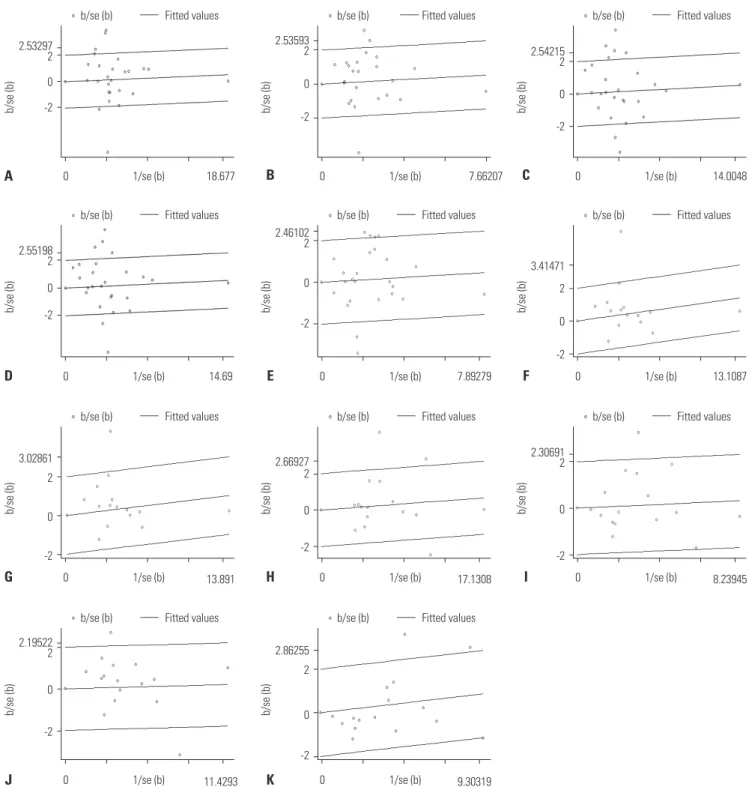
el and dominant model for IL-10 -819C/T polymorphism, and all genetic models except for heterozygous model for IL-10 -592A/C (Table 3). To elucidate the heterogeneity, Galbraith plots were performed in these genetic models. When the stud- ies which were outliers in some genetic models were excluded respectively, all I2 values were less than 50%, and Pheterogeneity were greater than 0.1 (Fig. 3, Table 4). The significance of pooled OR
in all genetic models was not influenced after excluding the studies. By meta-regression analysis, the heterogeneity sources were attributable to the sample types, ethnicity, control source, and the genotyping method. Ethnicity and sample types might be predominant sources of heterogeneity in IL-10 -1082G/A polymorphism, and ethnicity and control source in both IL-10 -819C/T and IL-10 -592A/C polymorphisms (Table 5).
Fig. 3. Galbraith plot of IL-10 promoter polymorphism and TB risk. (A-E) The five studies18,20,22,31,33 in G vs. A, three studies20,22,31 in GG vs. AA, seven stud- ies13,18,20,22,31,33,37 in AG vs. AA, six studies13,18,20,22,31,33 in GG+AG vs. AA, and five studies20,22,27,35,37 in GG vs. AG+AA were outliers for -1082G/A. (F and G) The one study38 in TC vs. CC and one study38 in TT+TC vs. CC for -819C/T. (H-K) The three studies26,28,38 in A vs. C, one study38 in AA vs. CC, one study38 in AA+AC vs.
CC, and two studies17,38 in AA vs. AC+CC for -592A/C. TB, tuberculosis; IL-10, interleukin 10.
2.53297 2 0 -2
2.53593 2
0
-2
2.54215 2 0 -2
b/se (b) b/se (b) b/se (b)
b/se (b) Fitted values b/se (b) Fitted values b/se (b) Fitted values
1/se (b) 1/se (b) 1/se (b)
0 18.677 0 7.66207 0 14.0048
A B C
2.55198 2 0 -2
2.46102 2
0
-2
3.41471 2
0
-2
b/se (b) b/se (b) b/se (b)
b/se (b) Fitted values b/se (b) Fitted values b/se (b) Fitted values
1/se (b) 1/se (b) 1/se (b)
0 14.69 0 7.89279 0 13.1087
D E F
3.02861 2
0
-2
2.66927 2
0
-2
2.30691 2
0
-2
b/se (b) b/se (b) b/se (b)
b/se (b) Fitted values b/se (b) Fitted values b/se (b) Fitted values
1/se (b) 1/se (b) 1/se (b)
0 13.891 0 17.1308 0 8.23945
G H I
2.19522 2
0
-2
2.86255 2
0
-2
b/se (b) b/se (b)
b/se (b) Fitted values b/se (b) Fitted values
1/se (b) 1/se (b)
0 11.4293 0 9.30319
J K
Sensitivity analysis
Sensitivity analysis was performed by sequentially excluding individual studies, including studies which was not in agree- ment with HWE. Statistically similar results were obtained in all genetic models after sequentially excluding each study, in- dicating the stability of our data.
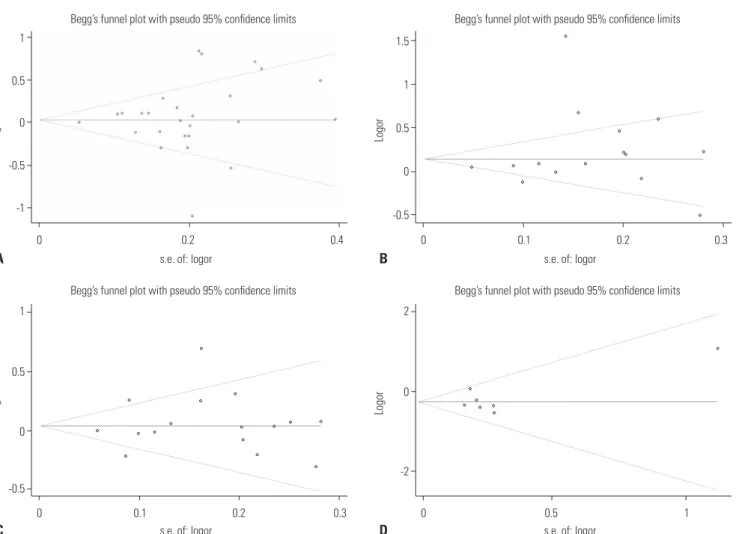
Publication bias
Begg’s funnel plot and Egger’s test were performed to assess the publication bias of included studies. The shapes of the fun- nel plots did not reveal any evidence of obvious asymmetry in the all genetic models. In all genetic models, Egger’s test also did not show any significant statistical evidence of publication bias, indicating low risk of publication bias in this meta-analy- sis (Fig. 4, Table 6).
DISCUSSION
This is not the first meta-analysis to assess the associations be- tween three polymorphisms (-1082G/A, -819C/T, and -592A/C) in the IL-10 gene promoter and the risk of TB. We found that the results of our meta-analysis are inconsistent with a recent study of Liang, et al.39 in which some following shortcomings were found : 1) the NOS scores of 3 Chinese articles included were lower than 7 stars through quality assessment, 2) two studies that meet the inclusion criterion were excluded (Ma, et al.,28 Spinassé, et al.32), 3) the choice of genetic models was in- correct, 4) heterogeneity analysis and sensitivity analysis were missing, and 5) some extracted data was not accurate enough.
Therefore, we performed this meta-analysis to examine the as-
sociation between three IL-10 and IL-6 polymorphisms and TB risk again. Our meta-analysis results indicated that the presence of the IL-10 -1082G/A, -819C/T, and -592A/C poly- morphisms was not associated with the risk of TB in all genetic models. On the other hand, the IL-6 -174G/C polymorphism might be associated with an decreased risk of TB in some ge- netic models (C allele vs. G allele: OR=0.77, 95% CI=0.64–0.91, p=0.003; CC vs. GG: OR=0.72, 95% CI=0.57–0.90, p=0.005;
CC+CG vs. GG: OR=0.71, 95% CI=0.57–0.88, p=0.002).
We also carried out subgroup analysis based on ethnicity, sample types and control source in consideration of obvious heterogeneity. In the stratiied analysis by ethnicity, we ob- served significantly increased TB risk associated with the IL-10 -1082G/A polymorphism in recessive model in Europeans, IL- 10 -819C/T polymorphism in Asians in heterozygous model and dominant model, IL-10 -592A/C polymorphism in Asians in Allele model, homozygous model and recessive model re- spectively, and a decreased TB risk associated with IL-6 -174G/
C polymorphism was found in allele model, heterozygous model and dominant model in Asians. Different genetic back- ground and environmental exposures might contribute to this ethnic difference. Subgroup analysis based on sample types suggested that IL-10 -1082G/A polymorphism may be related with an increased risk of TB in homozygous model in the PTB+EPTB mixed sample. The results of subgroup analysis by control source revealed no signiicant association with TB sus- ceptibility among IL-10 and IL-6 polymorphisms.
In our meta-analysis, obvious heterogeneity was observed for IL-10 -1082G/A polymorphism in all genetic models, -819C/T polymorphism in heterozygous model and dominant model, and -592A/C polymorphism in all genetic models except for Table 4. Meta-Analyses of IL-10 Polymorphisms and Risk of TB after Omitting the Studies
Polymorphisms Omitted studies OR (95% CI) Z POR I2 (%) Pheterogeneity Effect model IL-10 -1082G/A
G vs. A Ates, et al.;20 García-Elorriaga, et al.;33 Oh, et al.;18
Ramaseri Sunder, et al.;31 Wu, et al.22 1.02 (0.96, 1.09) 0.69 0.488 9.4 0.336 F GG vs. AA Ates, et al.;20 Ramaseri Sunder, et al.;31 Wu, et al.22 1.04 (0.90, 1.21) 0.54 0.588 2.2 0.430 F AG vs. AA Ansari, et al.;37 Ates, et al.;20 García-Elorriaga, et al.;33 Oh, et al.;18
Ramaseri Sunder, et al.;31 Scola, et al.;13 Wu, et al.22 1.00 (0.92, 1.09) 0.01 0.989 0.0 0.486 F GG+AG vs. AA Ates, et al.;20 García-Elorriaga, et al.;33 Oh, et al.;18
Ramaseri Sunder, et al.;31 Scola, et al.;13 Wu, et al.22 1.01 (0.93, 1.10) 0.25 0.802 11.6 0.311 F GG vs. AG+AA Ansari, et al.;37 Ates, et al.;20 Meenakshi, et al.;35
Mosaad, et al.;27 Wu, et al.22 1.03 (0.90, 1.19) 0.46 0.645 0.0 0.623 F
IL-10 -819C/T F
TC vs. CC Zhang, et al.38 1.06 (0.96, 1.17) 1.19 0.234 0.0 0.671 F
TT+TC vs. CC Zhang, et al.38 1.04 (0.95, 1.14) 0.80 0.424 0.0 0.683 F
IL-10 -592A/C F
A vs. C Ma, et al.;28 Taype, et al.;26 Zhang, et al.38 1.08 (0.99, 1.17) 1.78 0.075 3.7 0.409 F
AA vs. CC Zhang, et al.38 0.99 (0.87, 1.13) 0.11 0.913 5.9 0.386 F
AA+AC vs. CC Zhang, et al.38 1.00 (0.91, 1.10) 0.08 0.936 29.1 0.138 F
AA vs. AC+CC Henao, et al.;17 Zhang, et al.38 0.96 (0.85, 1.09) 0.63 0.526 0.0 0.845 F
TB, tuberculosis; CI, confidence interval; OR, odds ratio; Pheterogeneity, p value of Q test for heterogeneity; F, fixed-effect models; IL-10, interleukin 10.