ABSTRACT
BACKGROUD/OBJECTIVES: Evidence has suggested an association between serum vitamin D
and metabolic syndrome (MetS), but prospective studies are very limited. The objective was
to assess the dose-response association between serum vitamin D concentration and MetS
risk using a systematic review and meta-analysis of updated observational studies.
MATERIALS/METHODS: Using MEDLINE, PubMed, and Embase, a systematic literature
search was conducted through February 2020 and the references of relevant articles were
reviewed. A random-effects model was used to estimate the summary odds ratio/relative
risk and 95% confidence interval (CI). Heterogeneity among studies was evaluated with
I
2statistic. In total, 23 observational studies (19 cross-sectional studies, and four cohort
studies) were included in the meta-analysis.
RESULTS: The pooled estimates (95% CI) for MetS per 25-nmol/L increment in serum vitamin D
concentration were 0.80 (95% CI, 0.76–0.84; I
2= 53.5) in cross-sectional studies, and 0.85 (95%
CI, 0.72–0.98; I
2= 85.8) in cohort studies. Similar results were observed, irrespectively of age of
study population, study location, MetS criteria, and adjustment factors. There was no publication
bias for the dose-response meta-analysis of serum vitamin D concentrations and MetS.
CONCLUSIONS: Dose-response meta-analysis demonstrated that a 25-nmol/L increment in
the serum vitamin D concentration was associated with 20% and 15% lower risks of MetS in
cross-sectional studies and cohort studies, respectively.
Keywords: Metabolic syndrome; vitamin D; meta-analysis; systematic review
INTRODUCTION
Vitamin D deficiency is regarded as a global health issue over the world [1]. Previous studies
have found high prevalence of vitamin D deficiency worldwide [2,3]. About 1 billion people
have low vitamin D levels and this is found in all ethnicities and age groups [4].
Vitamin D plays a critical role in calcium metabolism, skeletal maintenance, immunity, and
cell proliferation and differentiation [5]. Recently, vitamin D deficiency has been reported to
have a strong relationship with increased risks of cardiovascular disease (CVD) and metabolic
Original Research
Received: Jul 2, 2020 Revised: Sep 19, 2020 Accepted: Nov 3, 2020 §Corresponding Author: Jihye KimDepartment of Medical Nutrition, Graduate School of East-West Medical Science, Kyung Hee University, 1732 Deogyeong-daero, Giheung-gu, Yongin 17104, Korea. Tel. +82-31-201-3497
Fax. +82-31-204-8119 E-mail. [email protected]
©2021 The Korean Nutrition Society and the Korean Society of Community Nutrition This is an Open Access article distributed under the terms of the Creative Commons Attribution Non-Commercial License (https:// creativecommons.org/licenses/by-nc/4.0/) which permits unrestricted non-commercial use, distribution, and reproduction in any medium, provided the original work is properly cited. ORCID iDs Kyueun Lee https://orcid.org/0000-0002-5714-0827 Jihye Kim https://orcid.org/0000-0002-3280-7381 Funding
This research was supported by the Basic Science Research Program of the National Research Foundation of Korea (NRF), funded by the Ministry of Education, Science, and Technology (NRF2017 R1D1A1B03931307 and NRF2018R1D1A1B07045558). The NRF had no role in the study design, data analysis, or writing of this article.
Kyueun Lee and Jihye Kim
§Department of Medical Nutrition, Graduate School of East-West Medical Science, Kyung Hee University, Yongin 17104, Korea
Serum vitamin D status and metabolic
syndrome: a systematic review and
dose-response meta-analysis
Conflict of Interest
The authors declare no potential conflicts of interests.
Author Contributions
Conceptualization: Kim J; Formal analysis: Lee K, Kim J; Funding acquistion: Kim J; Methodology: Kim J; Supervision: Kim J; Writing - original draft: Lee K; Writing - review & editing: Kim J.
syndrome (MetS) [6,7]. MetS has been considered as a risk factor for CVD and type 2 diabetes
mellitus [8,9]. MetS has rapidly increased with changing diets and lifestyle factors [10,11].
Numerous studies have showed the inverse relationship between vitamin D levels and the
risk of developing MetS. In Beijing adults aged 21–97 years, the prevalence of MetS was at
least three times greater in subjects with lower plasma 25-hydroxyvitamin D (25[OH]D)
concentrations (< 10 ng/mL) than in those with higher plasma 25(OH)D concentrations
(> 30 ng/mL) after adjustment for potential risk factors [12]. In a cross-sectional study of
Australian adults aged 18–75 years, the prevalence of MetS was 65% lower in the highest
tertile of serum vitamin D concentrations than in the lowest tertile [13]. Meta-analysis of
cross-sectional studies also revealed an inverse association between serum vitamin D levels
and MetS risk [14,15]. However, these studies failed to demonstrate a prospective association
between serum vitamin D levels and MetS risk. Recently, more longitudinal studies have been
published on the relationship between serum vitamin D levels and MetS risk. In longitudinal
analysis of Preventive Health Program, an increase of serum 25(OH)D ≥75nmol/L was
associated with a lower risk of MetS [16].
In this context, the dose-response association between serum vitamin D levels and MetS risk
was explored through a systematic review and meta-analysis, combining data from updated
observational studies including prospective studies.
MATERIALS AND METHODS
Literature search strategy
Two investigators (KL and JK) independently searched the literatures. Using MEDLINE,
PubMed, and Embase, a systematic literature search was performed through February 2020.
The following search terms were used: (‘vitamin D’ or ’25 hydroxyvitamin D’ or ‘25(OH)
D’ or ‘cholecalciferol’) and (‘metabolic syndrome’ or ‘syndrome X’ or ‘insulin resistance
syndrome’). Additionally, references of the articles searched and meta-analyses or review
articles were reviewed to identify relevant studies.
Study eligibility
Observational studies were included, studies had to have vitamin D concentration as the
exposure variable, have MetS as the outcome variable, and report odds ratio (OR) or relative
risk (RR) and their confidence intervals (CIs) in adults. If duplication from the identical
study were identified, the study with the largest number of subjects was selected. Titles and
abstracts were checked out for first screening, and then full texts were reviewed. Publications
written in non-English language were also included if the summary estimates and 95% CIs
could be extracted from the table of full text. Two investigators (KL and JK) independently
reviewed all studies, and discrepancies were discussed for agreement.
Data extraction
Two investigators (KL and JK) extracted the data from the original studies and further
discussed the data to resolve any disagreements. The following data were extracted from
individual study: publication year, first author's name, study design, study location, number
and age of subjects, follow-up period for cohort studies, definition of MetS, OR or RR with
95% CI for MetS according to serum vitamin D, and adjusted variables. When multivariable
adjustment models were presented, the most-adjusted model was selected. For consistency,
data presented as ng/mL were converted to nmol/L with the conversion factor of 2.496. For
studies that reported the 25(OH)D concentration as a range, the midpoint of the upper and
lower bounds of the range was calculated. If the upper boundary for the highest category was
not provided, the values were calculated based on the expectation that the boundary had the
same amplitude as the adjacent category. When the lowest category was open-ended, the
values were calculated through the computation of the midpoint.
Study quality assessment
Two investigators (KL and JK) independently assessed the quality of studies based on
the modified Newcastle-Ottawa quality assessment scale [17] for the following criteria:
justification of sample size, representativeness of the sample, comparability of subjects,
ascertainment of the risk factor, non-respondents, and apparent description of the statistical
analysis. The assessment scores ranged between 0 and 10. Total scores ≥ 8 (out of 10) are
considered as high quality. Total scores < 8 indicated low quality. Disagreement in quality
assessment between the 2 investigators were resolved by discussion. To avoid selection bias,
we did not reject any study based on the quality criteria.
Statistical analysis
Random-effects model was used for the linear or non-linear dose-response analysis [18].
When a study reported separate estimates of the serum vitamin D concentration according
to sex [19-21], the effect estimates in the same study for serum vitamin D concentration were
combined in a random-effects model in the main analysis.
The dose-response association between the exposure (serum vitamin D) and the outcome
(MetS) was examined in generalized least-squares trend estimation analysis. This analysis was
used first to estimate the study-specific slope lines and then to derive an overall slope, which
required the number of subjects and cases [18,22]. When the required numbers were not
provided, variance-weighted least squares meta-regression analysis was applied to calculate
the slopes [18,22]. For these two analyses, the mean or median value for each concentration
category was used. For studies not providing these values in each category, the midpoint of the
upper and lower boundary in each category was used as the average concentration.
To visualize and summarize the associations between exposure and outcome, the estimates
from each study with pooled estimates are presented as forest plots. A
P-value for
nonlinearity was estimated by testing the null hypothesis that the coefficient of the second
spline was equal to 0.
A subgroup and meta-regression analysis were performed to assess the sources of
heterogeneity, including the study design (cross-sectional/cohort), study location (North
America/Asia-Pacific/Europe), MetS criteria (National Cholesterol Education Program
Adult Treatment Panel III [NCEP ATP III]/International Diabetes Federation/Joint interim
statement/Chinese Diabetes Society)] and adjustment factors (age, alcohol intake, smoking,
physical activity, education, body mass index [BMI], energy intake, dietary or supplemental
calcium and vitamin D intake, serum parathyroid hormone [PTH] levels and season).
For a sensitivity analysis, one study at a time was removed and the pooled estimates from
remaining studies were calculated to assess the effect of the removed study. To identify
heterogeneity and inconsistency, the Q test and I
2statistic were calculated [23,24]. The
assumption of heterogeneity was considered valid for
P-values < 0.10. The tau-squared
statistic was calculated to estimate the between-study variance. Publication bias were
evaluated by visual inspection of the funnel plot with a pseudo 95% CI and by Egger's
regression asymmetry test and [25] and Begg's test [26]. The detection of publication bias
was considered as
P-value < 0.1. In addition, the Luis Furuya Kanamori (LFK) index was
applied for the identification of publication bias [27]. The closer the value of the LFK index to
zero, the more symmetrical plot would be and zero represents complete symmetry. The LFK
values beyond ± 1 were deemed consistent with possible publication bias. Statistical analyses
were conducted using Stata/SE 14.2 (STATA, College Station, TX, USA) and MetaXL version
5.3 (EpiGear International, Sunrise Beach, Australia).
RESULTS
Literature search
A total of 3,226 papers were searched and 609 were excluded due to duplication. Additionally,
two articles were included from reference review. During title and abstract screening, 2,510
articles were excluded. The following 86 articles were further excluded from full text review:
3 not related to exposure, 4 reviews, 3 studies that did not conduct in adults, 56 studies that
did not report OR or 95% CI, 12 studies that did not report data for vitamin D concentration,
5 studies reported in the same population, 2 study that focused on patients with particular
diseases, and 1 case-control study. Ultimately, 23 observational studies [12,13,16,19-21,28-44]
were included in the meta-analysis including 19 cross-sectional studies, and four cohort
studies (
Fig. 1
).
Study characteristics
A dose response meta-analysis on the association between serum vitamin D level and
MetS risk included 23 studies, including 19 cross-sectional studies
[12,13,20,21,28,30-38,40-44], and four cohort studies [16,19,29,39] (
Table 1
). Six studies [16,21,30,31,32,38]
were conducted in North America, eleven studies [12,19,20,28,29,33,35,37,41,43,44] were
conducted in Asia-Pacific and 6 studies [13,34,36,39,40,42] were conducted in Europe. The
follow-up period of the cohort studies was from 1.1 to 6.8 years. Eleven studies
[20,21,30,32-39] defined MetS according to the guidelines of the NCEP ATP III, while twelve studies
[13,16,19,28,29,31,33,40-44] defined MetS according to the Joint interim statement, or
International Diabetes Federation, or Chinese Diabetes Society criteria. Most studies were
adjusted for sex, age, alcohol intake, smoking, and physical activity. Nine studies
[13,32,34,37-41,43] provided the OR/RR adjusted for education. Eight studies [20,28,29,31,33-35,41]
provided the OR/RR adjusted for BMI. Three studies [31,32,38] reported the OR/RR adjusted
for vitamin D intake and supplement use. Five studies [13,28,30,31,35] reported the OR/RR
adjusted for calcium intake and supplement use. In the quality assessment of the studies, the
quality scores for the studies were between 5 and 10, with a mean score of 7.6.
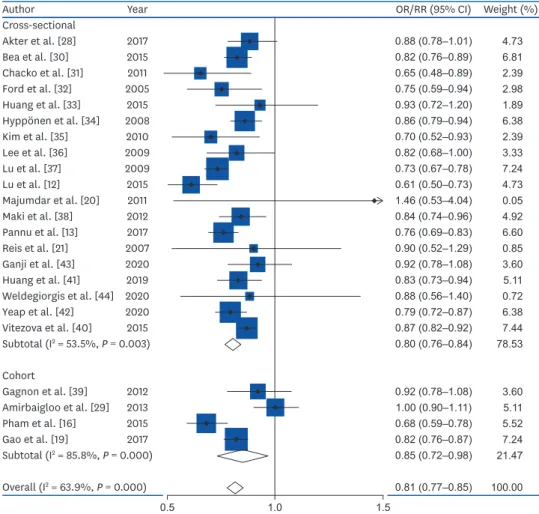
Dose-response meta-analysis between serum vitamin D concentration and MetS
Totally, 23 studies involving 15,540 cases and 70,369 participants were investigated. In a
dose-response meta-analysis, a 25-nmol/L increase in the serum vitamin D concentration
was associated with a 20% lower risk of MetS (OR = 0.80; 95% CI, 0.76–0.84; I
2= 53.5%;
τ
2= 0.003; Z = 41.52,
P < 0.001) in cross-sectional studies, a 15% lower risk of MetS (RR
= 0.85; 95% CI, 0.72–0.98; I
2= 85.8%; τ
2= 0.014; Z = 13.29,
P < 0.001) in cohort studies,
and an 19% lower risk of MetS in all studies (OR = 0.81; 95% CI, 0.77–0.85; I
2= 63.9%; τ
2=
0.0042; Z = 42.59,
P < 0.001) (
Fig. 2
). Compared with low concentration of serum vitamin
D, the estimated OR/RR of MetS was 0.81 (95% CI, 0.77–0.85) for 25 nmol/L, 0.67 (95% CI,
0.59–0.74) for 50 nmol/L, 0.54 (95% CI, 0.45–0.63) for 75 nmol/L, 0.35 (95% CI, 0.26–0.44)
for 125 nmol/L, and 0.27 (95% CI, 0.19–0.35) for 150 nmol/L. However, there was no
non-linear association between serum vitamin D and the MetS (
P non-linearity = 0.10); therefore,
a weighted linear regression model was applied (
Fig. 3
).
Records identified through database searching (n = 3,226)
PubMed (n = 1,034) Embase (n = 1,899) MEDLINE (n = 293)
Additional records identified through bibliography review (n = 2)
Records after duplicates removed (n = 2,619)
Records screened (n = 2,619)
Full-text articles assessed for eligibility (n = 109)
Studies included in quantitative synthesis (meta-analysis)
(n = 23)
Records excluded based on titles and abstract (n = 2,510)
Identification Scr eening Eligibility Incl uded
Full-text articles excluded, with reasons (n = 86) - Not related to exposure (n = 3)
- No adult population (n = 3) - Review (n = 4)
- Did not report OR or 95% CI (n = 56)
- Did not report data for vitamin D concentration (n = 12) - Reported the same population (n = 5)
- Study focused on patients (n = 2) - Case-control study (n = 1)
Fig. 1. Flow chart of the selection process according to the Preferred Reporting Items for Systematic Reviews and Meta-Analyses Statement.
Table 1. Characteristics of studies on the association between serum vitamin D status and metabolic syndrome Author, year Study design
(follow up period)
Location Age
(yrs) subjectsNo. of Criteria for metabolic syndrome
Serum vitamin D concentration
(nmol/L)
OR or RR
(95% CI) Adjustments Overall quality Cross-sectional studies
Ford et al.,
2005 [32] Cross-sectional US ≥ 20 8,421 Modified NCEP ATP III Q1 (≤ 48.4) 1.00 Age, sex, race/ethnicity, education, smoking status, cotinine concentration, total cholesterol concentration, C-reactive protein concentration, alcohol use, physical activity, fruit and vegetable intake, vitamin or supplement use, and season of study participation 6 Q2 (48.5–63.4) 0.82 (0.60–1.10) Q3 (63.5–78.1) 0.75 (0.55–1.02) Q4 (78.2–96.3) 0.60 (0.44–0.83) Q5 (≥ 96.4) 0.46 (0.32–0.67)
Table 1. (Continued) Characteristics of studies on the association between serum vitamin D status and metabolic syndrome Author, year Study design
(follow up period)
Location Age
(yrs) subjectsNo. of Criteria for metabolic syndrome
Serum vitamin D concentration
(nmol/L)
OR or RR
(95% CI) Adjustments Overall quality Reis et al.,
2007 [21] Cross-sectional US 44–96 1,070 Modified NCEP ATP III Men Men Age, current smoking, alcohol use, exercise, season of study participation, and hormone therapy (in women)
9 I (< 87.5) 1.00 II (87.5–97.4) 0.83 (0.39–1.73) III (97.5–110) 0.68 (0.32–1.43) IV (110.1–126.2) 0.65 (0.32–1.34) V (≥ 126.3) 0.57 (0.26–1.25) Women Women I (< 77.5) 1.00 II (77.5–92.4) 0.96 (0.48–1.90) III (92.5–103.7) 0.96 (0.51–1.79) IV (103.8–119.9) 1.33 (0.69–2.57) V (≥ 120) 0.88 (0.43–1.80) Hyppönen et
al., 2008 [34] Cross-sectional UK 42–46 6,810 Modified NCEP ATP III Lowest third (9–45) 1.00 Sex, month, hour of measurement, and insulin-like growth factor-I 7 Middle third (46–67) 0.58 (0.48–0.72) Highest third (68–231) 0.33 (0.26–0.42) Lee et al.,
2009 [36] Cross-sectional UK 40–79 men 3,069 Modified NCEP ATP III Q1 (< 35.7) 1.00 Age, smoking, alcohol consumption, physical activity, season and center, PTH, and HOMA-IR 7 Q2 (35.7–49.4) 0.94 (0.62–1.43) Q3 (49.5–65.1) 0.78 (0.56–1.08) Q4 (65.2–85.9) 0.61 (0.36–1.04) Q5 (> 85.9) 0.60 (0.47–0.78) Lu et al., 2009
[37] Cross-sectional China 50–70 3,262 Modified NCEP ATP III Q1 (≤ 28.7) 1.00 Age, sex, geographic location, residential region, visit date, education, physical activity, smoking, alcohol drinking, family history of CVD and diabetes, self-reported coronary heart disease and stroke, and inflammatory factors 7 Q2 (28.8–36.8) 0.94 (0.76–1.17) Q3 (36.9–45.5) 0.71 (0.57–0.88) Q4 (45.6–57.6) 0.58 (0.47–0.72) Q5 (≥ 57.7) 0.40 (0.32–0.50) Kim et al.,
2010 [35] Cross-sectional Korea ≥ 40 1,330 Modified NCEP ATP III Q1 (10–29.7) 1.00 Age, gender, BMI, season of blood draw, smoking, drinking, exercise, total energy, Ca and sodium intake, PTH, and serum Ca levels 9 Q2 (30–39.2) 0.72 (0.47–1.09) Q3 (39.4–49.4) 0.72 (0.46–1.12) Q4 (49.7–61.2) 0.55 (0.35–0.89) Q5 (61.4–116.8) 0.34 (0.21–0.58) Chacko et al.,
2011 [31] Cross-sectional US women50–79 292 Joint interim statement T1 (< 35) 1.00 Age, race/ethnicity, month of blood draw, geographic region, case-control status, smoking status, alcohol intake, physical activity, supplemental vitamins (vitamin D, Ca, magnesium, multivitamins with minerals), and BMI
7 T2 (35–51) 0.43 (0.20–0.93)
T3 (≥ 52) 0.38 (0.16–0.91)
Majumdar et
al., 2011 [20] Cross-sectional India 18–75 441 Modified NCEP ATP III Q1 (< 28.2)Men Men1.00 Age, BMI, and smoking habits 7 Q2 (28.2–38.0) 0.3 (0.1–0.9) Q3 (38.1–47.0) 0.8 (0.3–2.0) Q4 (47.1–57.8) 0.9 (0.3–2.3) Q5 (> 57.8) 0.6 (0.2–1.7) Women Women Q1 (< 25.2) 1.00 Q2 (25.2–34.2) 1.1 (0.4–3.4) Q3 (34.3–42.9) 1.1 (0.4–3.4) Q4 (43.0–53.5) 1.5 (0.5–4.9) Q5 (> 53.5) 1.2 (0.4–3.6)
Author, year Study design (follow up
period)
Location Age
(yrs) subjectsNo. of Criteria for metabolic syndrome
Serum vitamin D concentration
(nmol/L)
OR or RR
(95% CI) Adjustments Overall quality Maki et al.,
2012 [38] Cross-sectional US ≥ 20 3,529 Modified NCEP ATP III Q1 (7.5–44.9) 1.00 Age, sex, race/ethnicity, education, smoking status, serum cotinine, C-reactive protein, alcohol use, physical activity, sum of total fruit and vegetable Healthy Eating Index scores, and daily intake of vitamin D from dietary supplements 6 Q2 (45–59.9) 0.75 (0.54–1.03) Q3 (60–74.9) 0.69 (0.49–0.96) Q4 (75–215) 0.40 (0.27–0.59) Bea et al.,
2015 [30] Cross-sectional US Mean 65 2,096 Modified NCEP ATP III Deficient (< 50) 1.00 Age, race/ethnicity, supplemental Ca, waist-hip ratio and sex
9 Inadequate
(50–75) 0.70 (0.54–0.92) Adequate (≥ 75) 0.47 (0.35–0.63) Huang et al.,
2015 [33] Cross-sectional Taiwan 22–39 355 Modified NCEP ATP III T1 (21.5–58.8) 1.00 Age, sex, smoking status, alcohol consumption, physical activity, BMI, and HOMA-IR
8 T2 (58.9–79.4) 0.81 (0.19–3.40)
T3 (79.5–218.2) 0.64 (0.14–2.89) Lu et al., 2015
[12] Cross-sectional China 21–97 3,275 International Diabetes Federation
< 25 1.00 Age, sex, BMI, waist circumference, FPG,
triglyceride, HDL-C, low-density lipoprotein, systolic blood pressure, and diastolic blood pressure 7 25–50 0.70 (0.46–1.06) 50–75 0.27 (0.15–0.46) ≥ 75 0.16 (0.06–0.38) Vitezova et al.,
2015 [40] Cross-sectional Netherlands ≥ 55 3,240 Joint interim statement < 50 1.00 Age, sex, physical activity, diet quality score, family history of cardiometabolic diseases, baseline cardiometabolic diseases, smoking, education, income, season of blood draw, and year of blood draw
8 50–75 0.70 (0.58–0.84)
≥ 75 0.61 (0.49–0.77)
Akter et al.,
2017 [28] Cross-sectional Japan 18–69 1,790 Joint interim statement < 50 1.00 Age, sex, energy intake, smoking status, alcohol intake, physical activity, night or rotating shift work, Ca intake and BMI
9 50–75 0.79 (0.55–1.15)
≥ 75 0.52 (0.25–1.04) Pannu et al.,
2017 [13] Cross-sectional Australia 18–75 3,404 Joint interim statement Low (33) 1.00 Age, gender, country of birth, income, education, smoking, season, energy intake, physical activity level, body weight, alcohol, dietary fiber, magnesium, Ca, and retinol
10 Medium (54) 0.77 (0.58–1.04)
High (77) 0.35 (0.26–0.48)
Huang et al.,
2019 [41] Cross-sectional China women49–86 616 International Diabetes Federation
Deficient (< 50) 1.00 Age, years after menopause, BMI, education, season of blood sampling, exercise, PTH, estradiol (pg/mL) 7 Insufficient (50–75) 0.76 (0.52–1.11) Sufficient (≥ 75) 0.38 (0.22–0.66) Ganji et al.,
2020 [43] Cross-sectional Qatar women20–80 700 International Diabetes Federation
Q1 (< 32.5) 1.00 Age, income, education, and
menopause 8
Q2 (32.5–45) 1.37 (0.88–2.15) Q3 (45–62.5) 1.34 (0.85–2.13) Q4 (≥ 62.5) 0.50 (0.29–0.85) Yeap et al.,
2020 [42] Cross-sectional Australia Mean 58.1 4,858 International Diabetes Federation < 50 Males Unadjusted 5 50–100 1.00 > 100 0.56 (0.37–0.86) 0.24 (0.15–0.86) Females 1.00 0.61 (0.46–0.81) 0.37 (0.46–0.81) Weldegiorgis et al., 2020 [44]
Cross-sectional China > 50 2,764 Joint interim statement Q1 (≤ 24.6) 1.00 Age, sex, cigarette status, alcohol consumption, physical activity, total serum cholesterol, low-density lipoprotein, and creatinine
7 Q2 (24.6–35) 0.76 (0.55–1.06)
Q3 (35–48.7) 0.74 (0.53–1.03) Q4 (≥ 48.8) 0.67 (0.45–0.90)
Table 1. (Continued) Characteristics of studies on the association between serum vitamin D status and metabolic syndrome
Subgroup, meta-regression and sensitivity analysis
The results of the subgroup and meta-regression analyses are presented in
Table 2
. The
subgroup analysis revealed no differences according to age group. For study design,
cross-sectional studies (OR = 0.80; 95% CI, 0.76–0.84) [12,13,20,21,28,30-38,40-44] and cohort
studies (RR = 0.85; 95% CI, 0.72–0.98) [16,19,29,39] showed significant inverse associations.
Subgroup analyses showed no difference in study design, study location and MetS criteria (
P
> 0.1). Study quality (
P = 0.010), and adjustment for alcohol intake (P = 0.045) contributed to
heterogeneity. Regarding to adjustment factors such as smoking, physical activity, education,
BMI, energy intake, calcium intake or supplement use, vitamin D intake or supplement use,
serum PTH levels, and season, no differences were found (
P > 0.1). By study design, study
quality contributed to heterogeneity (
P = 0.092) across cross-sectional studies and study
quality (
P = 0.001) and adjustment for alcohol intake (P = 0.001) contributed to heterogeneity
across cohort studies.
In a sensitivity analysis, the pooled estimates were in the range of 0.80 (95% CI, 0.77–0.85) to
0.82 (95% CI, 0.79–0.86). When 2 studies [12,29] were excluded, the heterogeneity decreased
(I
2= 50.8%) with the different result (OR = 0.83; 95% CI, 0.80–0.86).
Publication bias
Publication bias for the dose-response meta-analysis of serum vitamin D concentrations and
MetS risk was not observed (Begg's
P = 0.94, Egger's P = 0.78, LFK index= 0.53). Funnel plot
for publication bias was presented in
Fig. 4
.
Author, year Study design (follow up
period)
Location Age
(yrs) subjectsNo. of Criteria for metabolic syndrome
Serum vitamin D concentration
(nmol/L)
OR or RR
(95% CI) Adjustments Overall quality Cohort studies
Gagnon et al.,
2012 [39] Cohort (5 yrs) Australia ≥ 25 11,247 Modified NCEP ATP III Q1 (< 45) 1.00 Age, sex, ethnicity, season, latitude, smoking, family history of type 2 diabetes, physical activity, education, epidermal growth factor receptor, and HOMA-IR 9 Q2 (45–57.5) 1.26 (0.95–1.65) Q3 (60–67.5) 0.87 (0.65–1.17) Q4 (70–82.5) 0.91 (0.68–1.21) Q5 (85–232.5) 0.72 (0.53–0.98) Amirbaigloo et
al., 2013 [29] Cohort (6.8 yrs) Iran ≥ 20 644 Joint interim statement < 50 1.00 BMI, waist circumference, FPG, blood pressure, triglyceride, HDL-C, and smoking status
8 50–75 0.96 (0.66–1.39)
> 75 1.01 (0.66–1.55) Pham et al.,
2015 [16] Cohort (1.1 yrs) Canada Mean 51 6,682 Joint interim statement < 50 1.00 Gender, baseline age, season at baseline, season at follow-up, tobacco smoking status, alcohol drinking status, physical activity at baseline, and physical activity change during follow-up 7 50–75 0.78 (0.60–1.01) 75–100 0.49 (0.37–0.64) 100–125 0.37 (0.27–0.52) > 125 0.24 (0.16–0.34) Gao et al.,
2017 [19] Cohort (4 yrs) China Mean 46 474 Chinese Diabetes Society Men Men Age, physical activity, smoking, alcohol consumption, family history of obesity, diabetes, hypertension, hyperlipidemia and CVD, baseline weight, FPG, 2-hour postprandial glucose level, triglyceride, HDL-C, systolic blood pressure, and diastolic blood pressure
7 Q1 (13.93–32.6) 1.00 Q2 (32.61–39.15) 1.00 (0.38–2.62) Q3 (39.16–45.15) 0.88 (0.32–2.40) Q4 (45.15–64.14) 0.29 (0.06–1.30) Women Women Q1 (15.42–36.57) 1.00 Q2 (36.58–41.71) 0.82 (0.26–2.58) Q3 (41.72–49.49) 0.66 (0.19–2.23) Q4 (49.5–80.3) 0.33 (0.07–1.58)
OR, odds ratio; RR, relative risk; CI, confidence interval; NCEP ATP III, National Cholesterol Education Program Adult Treatment Panel III; PTH, parathyroid hormone; HOMA-IR, homeostasis model assessment of insulin resistance; CVD, cardiovascular disease; BMI, body mass index; Ca, calcium; FPG, fasting plasma glucose; HDL-C, high-density lipoprotein cholesterol.
Author Year OR/RR (95% CI) Weight (%) Cross-sectional Akter et al. [28] 2017 0.88 (0.78–1.01) Bea et al. [30] 2015 0.82 (0.76–0.89) 0.65 (0.48–0.89) 0.75 (0.59–0.94) 0.93 (0.72–1.20) 0.86 (0.79–0.94) 0.70 (0.52–0.93) 0.82 (0.68–1.00) 0.73 (0.67–0.78) 0.61 (0.50–0.73) 1.46 (0.53–4.04) 0.84 (0.74–0.96) 0.76 (0.69–0.83) 0.90 (0.52–1.29) 0.92 (0.78–1.08) 0.83 (0.73–0.94) 0.88 (0.56–1.40) 0.79 (0.72–0.87) 0.87 (0.82–0.92) 0.80 (0.76–0.84) 0.92 (0.78–1.08) 1.00 (0.90–1.11) 0.68 (0.59–0.78) 0.82 (0.76–0.87) 0.85 (0.72–0.98) 0.81 (0.77–0.85) 4.73 6.81 2.39 2.98 1.89 6.38 2.39 3.33 7.24 4.73 0.05 4.92 6.60 0.85 3.60 5.11 0.72 6.38 7.44 78.53 3.60 5.11 5.52 7.24 21.47 100.00 0.5 1.0 1.5 Chacko et al. [31] 2011 Ford et al. [32] 2005 Huang et al. [33] 2015 Hyppönen et al. [34] 2008 Kim et al. [35] 2010 Lee et al. [36] 2009 Lu et al. [37] 2009 Lu et al. [12] 2015 Majumdar et al. [20] 2011 Maki et al. [38] 2012 Pannu et al. [13] 2017 Reis et al. [21] 2007 Ganji et al. [43] 2020 Huang et al. [41] 2019 Weldegiorgis et al. [44] 2020 Yeap et al. [42] 2020 Vitezova et al. [40] 2015 Subtotal (I2 = 53.5%, P = 0.003) Cohort Gagnon et al. [39] 2012 Amirbaigloo et al. [29] 2013 Pham et al. [16] 2015 Gao et al. [19] 2017 Subtotal (I2 = 85.8%, P = 0.000) Overall (I2 = 63.9%, P = 0.000)
Fig. 2. Forest plot for the linear dose-response relationship between serum vitamin D status (per 25-nmol/L increment) and metabolic syndrome.
OR, odds ratio; RR, relative risk; CI, confidence interval.
OR
/RR of the MetS
Vitamin D concentration (nmol/L) 0 0 25 50 75 100 125 150 1.6 1.4 1.2 1.0 0.8 0.6 0.4 0.2
Fig. 3. Linear dose-response regression model on the relationship between serum vitamin D and the risk of MetS in observational studies. The solid line represents the weighted regression line, with weights proportional to the precision of the OR/RR.
DISCUSSION
This meta-analysis revealed a linear inverse association between serum vitamin D
concentration and the risk of MetS in both cross-sectional and cohort studies. In a
dose-Table 2. Subgroup analysis of studies on the association of serum vitamin D status with the risk of MetS in observational studiesStudy No. of studies OR or RR (95% Cl) I2 (%) P value for
heterogeneity P * All studies 23 0.81 (0.77–0.85) 63.9 0.000 Age 0.475 Total 10 0.82 (0.74–0.91) 73.5 0.000 Middle 4 0.81 (0.72–0.89) 70.0 0.019 Elderly 9 0.80 (0.76–0.85) 52.3 0.032 Study design 0.374 Cross-sectional 19 0.80 (0.76–0.84) 53.5 0.003 Cohort 4 0.85 (0.72–0.98) 85.8 0.000 Study location 0.290 North America 6 0.77 (0.70–0.84) 43.7 0.114 Asia-Pacific 11 0.82 (0.75–0.90) 74.0 0.000 Europe 6 0.83 (0.78–0.88) 46.6 0.096 MetS criteria 0.840 NCEP ATP-III 11 0.81 (0.77–0.86) 34.3 0.124 Others 12 0.81 (0.75–0.86) 75.6 0.000 Quality assessment 0.010 High (≥ 8) 10 0.86 (0.81–0.92) 55.2 0.017 Low (< 8) 13 0.77 (0.73–0.82) 55.5 0.008
Adjustment for confounders
Alcohol 0.045 Yes 13 0.78 (0.74–0.82) 34.3 0.108 No 10 0.84 (0.79–0.90) 40.6 0.000 Smoking 0.798 Yes 17 0.82 (0.77–0.86) 64.6 0.000 No 6 0.80 (0.74–0.87) 68.5 0.007 Physical activity 0.500 Yes 17 0.82 (0.78–0.87) 70.3 0.000 No 6 0.83 (0.73–0.93) 77.9 0.000 Education 0.626 Yes 9 0.82 (0.77–0.87) 63.9 0.005 No 14 0.80 (0.74–0.86) 66.1 0.000 BMI 0.477 Yes 9 0.82 (0.72–0.91) 74.3 0.000 No 14 0.80 (0.77–0.84) 53.9 0.009 Energy intake 0.640 Yes 3 0.79 (0.70–0.88) 47.0 0.152 No 20 0.81 (0.77–0.86) 66.3 0.000
Calcium (dietary intake or supplement use) 0.442
Yes 5 0.79 (0.73–0.85) 37.2 0.173
No 18 0.82 (0.77–0.87) 68.4 0.000
Vitamin D (dietary intake or supplement use) 0.480
Yes 3 0.77 (0.67–0.88) 28.0 0.249 No 20 0.82 (0.78–0.86) 67.1 0.000 Serum PTH 0.782 Yes 3 0.81 (0.73–0.89) 0.0 0.534 No 20 0.81 (0.77–0.85) 68.1 0.000 Season 0.536 Yes 9 0.80 (0.74–0.86) 57.1 0.017 No 14 0.82 (0.77–0.87) 69.2 0.000
MetS, metabolic syndrome; OR, odds ratio; RR, relative risk; CI, confidence interval; NCEP ATP-III, National Cholesterol Education Program Adult Treatment Panel III; BMI, body mass index; PTH, parathyroid hormone.
response meta-analysis, a 25-nmol/L increase in serum vitamin D concentration was
associated with a 20% lower risk of MetS in cross-sectional studies and a 15% lower risk
of MetS in cohort studies. A 25-nmol/L increment in serum vitamin D concentration was
associated with a 19% lower risk of MetS when all the studies were combined. Study quality
contributed to heterogeneity among cross-sectional study whereas study location, study
quality, adjustment for alcohol intake, physical activity, and BMI contributed to heterogeneity
among cohort study.
These findings are line with the results of previous meta-analyses. A 25-nmol/L increment in
serum vitamin D concentration was associated with a 13% lower risk of MetS in 16
cross-sectional studies [14]. A meta-analysis of eight cross-cross-sectional studies found that the highest
group of serum vitamin D levels was associated with a 51% lower risk of MetS than the lowest
group [15]. A meta-analysis of prospective studies reported that individuals in the top third
of vitamin D level had a 14% lower risk of MetS compared with those in the bottom third of
vitamin D [45].
Numerous studies have supported inverse relationships between vitamin D status and the
components of MetS as well as MetS itself. In a clinical trial of overweight and obese women
aged 20–40 years, 6-week supplementation with 50,000 IU of vitamin D/week reduced the
waist circumference in the intervention group [46]. A vitamin D intervention of 50,000 IU/
week for four months reduced triglyceride levels in an Iranian population aged 30–50 years
[47]. In a clinical trial of diabetic patients, fasting plasma glucose levels decreased in the
intervention group supplemented with 50,000 IU of vitamin D/week for eight weeks [48].
A 14-year follow-up study in US women aged 22–44 years revealed that individuals with
vitamin D insufficiency had a greater risk of hypertension after adjustment for potential
confounders [49]. Given these results, the protective effects of a higher vitamin D status on
the components of MetS might ultimately reduce the risk of MetS.
Potential mechanisms have been suggested to explain the inverse association between
serum vitamin D concentration and the risk of MetS. Hypovitaminosis D has long been
Standar d err or Log OR/RR Funnel plot 0.5 −1.0 −0.5 0 0.5 1.0 0.4 0.2 0.1 0.3 0
Fig. 4. Funnel plot for publication bias in the relationship between serum vitamin D and the risk of metabolic syndrome in observational studies.
suspected to increase the risk of glucose intolerance by influencing insulin sensitivity or β
cell function. Chiu et al. reported that 25(OH)D concentration was positively correlated with
insulin sensitivity and hypovitaminosis D was negatively related to β cell function in
glucose-intolerant subjects [50]. Vitamin D is an essential nutrient for insulin secretion. Indeed,
insulin secretion was found to be impaired in subjects with vitamin D-deficiency [50].
Vitamin D not only accelerates the biosynthetic capacity of β cells, but also facilitates the
insulin synthesis from proinsulin [50].
Vitamin D is closely linked to atherogenic lipid profile. Vitamin D deficiency causes
adipogenesis and hyperlipidemia through the decrease of sirtuin (SIRT)-1, which stimulate
lipolysis and inhibits adipogenesis by deacetylation of peroxisome proliferator-activated
receptor gamma [51]. Moreover, SIRT-1 plays a critical role in lipid metabolism through the
control of the secretion and action of insulin [52]. Chang et al reported that SIRT-1 activity
decreased significantly in obese rats fed vitamin D-insufficient diet [53].
Low vitamin D levels may elevate blood pressure by activating the renin-angiotensin system
via the vitamin D receptor (VDR) [54]. Li et al. reported that renin activity and circulating
plasma angiotensin II concentrations were significantly elevated in VDR knock-out mice [55].
VDR liganded with 1,25-dihydroxyvitamin D, the active form of vitamin D, suppresses renin
gene expression, and VDR agonists have exhibited protective effects on blood pressure and
cardiac tissue [55].
Vitamin D deficiency is associated with reduced calcium absorption in intestine, leading to
low serum calcium concentrations. Low serum calcium levels stimulates PTH secretion to
ensure adequate serum calcium levels; however, the resulting secondary hyperparathyroidism
has several deleterious effects [56]. Epidemiological studies have demonstrated that elevated
PTH levels are associated with higher risk of cardiometabolic factors [57]. A cohort study
of adults aged 55–85 years in the Netherlands demonstrated that higher PTH levels were
associated with higher blood pressure levels after adjustment for potential confounders
[58]. Ahlstrom et al. found that plasma PTH levels were positively correlated with and waist
circumference in a Swedish population aged 70 years [59]. Taken together, these results
indicate that the impacts of the serum vitamin D concentration on individual components of
MetS might influence the risk of MetS.
In addition, vitamin D has been suggested to play important roles in inflammation [60]. For
instance, 1,25-dihydroxyvitamin D regulates the production of pro-inflammatory cytokines
including tumor necrosis factor-α, interleukin (IL)-1, IL-6, IL-8, and in immune system
cells [61,62]. In patients aged 48–81 years with type 2 diabetes, 1,25-dihydroxyvitamin D
downregulated cytokines in monocytes, whereas this did not occur in the control group [62].
To the best of our knowledge, the present study is the first meta-analysis including
prospective studies to reveal a dose response inverse relationship between serum vitamin D
status and the risk of MetS. Previous meta-analysis failed to examine prospective association
between vitamin D and MetS because they mostly included cross-sectional studies. This
meta-analysis included studies with good quality and the studies adjusted for potential
confounders of MetS such as sociodemographic and lifestyle factors.
Our results may be hampered by heterogeneity. This heterogeneity could be attributable
to differences in study quality and adjustment factor such as alcohol intake across cohort
studies. Nevertheless, it is clear that there is a majority agreement among the study results
and an overall consensus regarding the inverse association between vitamin D and MetS
when evaluated as combined and as separate outcomes as well.
This study has a few limitations. Small number of cohort studies were included in the
meta-analysis. The possibility of unmeasured confounding factors might exist in this study.
However, a small E-value indicates no unmeasured confounding is needed to explain away the
observed association [63]. The effect size could be overestimated because the estimates were
pooled from OR and RR. Also, the results should be interpreted cautiously because of the
evidence of heterogeneity across the studies in this analysis. The possibility for ecological bias
may exist because meta-analyses use aggregated data rather than analyzing individual data.
In conclusion, this dose-response meta-analysis demonstrated that a 25-nmol/L increment
in the serum vitamin D concentration was associated with 20% and 15% lower risks of MetS
in cross-sectional studies and cohort studies, respectively. In the subgroup analysis, study
quality and adjustment for alcohol intake contributed to heterogeneity. Also, vitamin D
status was inversely associated with risk of MetS regardless of race- or geographic region.
A linear association between serum vitamin D and MetS risk suggest that maintaining the
proper vitamin D level may reduce the public health burden for MetS in general population.
The importance of vitamin D status should be emphasized for the higher risk groups such
as chronic alcohol drinker. Further well-designed clinical trials are required to evaluate the
causal association between vitamin D status and MetS risk and determine the benefit of
vitamin D supplementation for the prevention of MetS.
REFERENCES
1. Holick MF, Chen TC. Vitamin D deficiency: a worldwide problem with health consequences. Am J Clin Nutr 2008;87:1080S-1086S.
PUBMED | CROSSREF
2. Mithal A, Wahl DA, Bonjour JP, Burckhardt P, Dawson-Hughes B, Eisman JA, El-Hajj Fuleihan G, Josse RG, Lips P, Morales-Torres J; IOF Committee of Scientific Advisors (CSA) Nutrition Working Group. Global vitamin D status and determinants of hypovitaminosis D. Osteoporos Int 2009;20:1807-20.
PUBMED | CROSSREF
3. Wahl DA, Cooper C, Ebeling PR, Eggersdorfer M, Hilger J, Hoffmann K, Josse R, Kanis JA, Mithal A, Pierroz DD, Stenmark J, Stöcklin E, Dawson-Hughes B. A global representation of vitamin D status in healthy populations. Arch Osteoporos 2012;7:155-72.
PUBMED | CROSSREF
4. Palacios C, Gonzalez L. Is vitamin D deficiency a major global public health problem? J Steroid Biochem Mol Biol 2014;144 Pt A:138-45.
PUBMED | CROSSREF
5. Kim M, Na W, Sohn C. Correlation between vitamin D and cardiovascular disease predictors in overweight and obese Koreans. J Clin Biochem Nutr 2013;52:167-71.
PUBMED | CROSSREF
6. Anderson JL, May HT, Horne BD, Bair TL, Hall NL, Carlquist JF, Lappé DL, Muhlestein JB; Intermountain Heart Collaborative (IHC) Study Group. Relation of vitamin D deficiency to cardiovascular risk factors, disease status, and incident events in a general healthcare population. Am J Cardiol 2010;106:963-8.
PUBMED | CROSSREF
7. Botella-Carretero JI, Alvarez-Blasco F, Villafruela JJ, Balsa JA, Vázquez C, Escobar-Morreale HF. Vitamin D deficiency is associated with the metabolic syndrome in morbid obesity. Clin Nutr 2007;26:573-80.
PUBMED | CROSSREF
8. Wilson PW, D'Agostino RB, Parise H, Sullivan L, Meigs JB. Metabolic syndrome as a precursor of cardiovascular disease and type 2 diabetes mellitus. Circulation 2005;112:3066-72.
9. Wu SH, Liu Z, Ho SC. Metabolic syndrome and all-cause mortality: a meta-analysis of prospective cohort studies. Eur J Epidemiol 2010;25:375-84.
PUBMED | CROSSREF
10. Borch-Johnsen K. The metabolic syndrome in a global perspective. The public health impact--secondary publication. Dan Med Bull 2007;54:157-9.
PUBMED
11. Lee SE, Han K, Kang YM, Kim SO, Cho YK, Ko KS, Park JY, Lee KU, Koh EH; Taskforce Team of Diabetes Fact Sheet of the Korean Diabetes Association. Trends in the prevalence of metabolic syndrome and its components in South Korea: findings from the Korean National Health Insurance Service Database (2009–2013). PLoS One 2018;13:e0194490.
PUBMED | CROSSREF
12. Lu Y, Liu M, Pei Y, Li J, Tian H, Cheng X, Fang F, Sun B, Xiao H, Li N, Miao X, Li C. Low levels of serum 25-hydroxyvitamin D and risk of metabolic syndrome in China. Int J Clin Exp Med 2015;8:13790-6. PUBMED
13. Pannu PK, Zhao Y, Soares MJ, Piers LS, Ansari Z. The associations of vitamin D status and dietary calcium with the metabolic syndrome: an analysis of the Victorian Health Monitor survey. Public Health Nutr 2017;20:1785-96.
PUBMED | CROSSREF
14. Ju SY, Jeong HS, Kim DH. Blood vitamin D status and metabolic syndrome in the general adult population: a dose-response meta-analysis. J Clin Endocrinol Metab 2014;99:1053-63.
PUBMED | CROSSREF
15. Parker J, Hashmi O, Dutton D, Mavrodaris A, Stranges S, Kandala NB, Clarke A, Franco OH. Levels of vitamin D and cardiometabolic disorders: systematic review and meta-analysis. Maturitas 2010;65:225-36.
PUBMED | CROSSREF
16. Pham TM, Ekwaru JP, Setayeshgar S, Veugelers PJ. The effect of changing serum 25-hydroxyvitamin D concentrations on metabolic syndrome: a longitudinal analysis of participants of a preventive health program. Nutrients 2015;7:7271-84.
PUBMED | CROSSREF
17. Modesti PA, Reboldi G, Cappuccio FP, Agyemang C, Remuzzi G, Rapi S, Perruolo E, Parati G; ESH Working Group on CV Risk in Low Resource Settings. Panethnic differences in blood pressure in Europe: a systematic review and meta-analysis. PLoS One 2016;11:e0147601.
PUBMED | CROSSREF
18. Greenland S, Longnecker MP. Methods for trend estimation from summarized dose-response data, with applications to meta-analysis. Am J Epidemiol 1992;135:1301-9.
PUBMED | CROSSREF
19. Gao Y, Ran X, Ren Y, Chen T, Zheng T, Zhong L, Tian H. Relationship between vitamin D level and the incidence of metabolic syndrome in adults in Chengdu city: a prospective cohort study. Chin J Evid-Based Med 2017;17:1121-6.
CROSSREF
20. Majumdar V, Nagaraja D, Christopher R. Vitamin D status and metabolic syndrome in Asian Indians. Int J Obes 2011;35:1131-4.
PUBMED | CROSSREF
21. Reis JP, von Mühlen D, Kritz-Silverstein D, Wingard DL, Barrett-Connor E. Vitamin D, parathyroid hormone levels, and the prevalence of metabolic syndrome in community-dwelling older adults. Diabetes Care 2007;30:1549-55.
PUBMED | CROSSREF
22. Orsini N, Bellocco R, Greenland S. Generalized least squares for trend estimation of summarized dose-response data. Stata J 2006;6:40-57.
CROSSREF
23. Higgins JP, Thompson SG. Quantifying heterogeneity in a meta-analysis. Stat Med 2002;21:1539-58.
PUBMED | CROSSREF
24. Higgins JP, Thompson SG, Deeks JJ, Altman DG. Measuring inconsistency in meta-analyses. BMJ 2003;327:557-60.
PUBMED | CROSSREF
25. Egger M, Davey Smith G, Schneider M, Minder C. Bias in meta-analysis detected by a simple, graphical test. BMJ 1997;315:629-34.
PUBMED | CROSSREF
26. Begg CB, Mazumdar M. Operating characteristics of a rank correlation test for publication bias. Biometrics 1994;50:1088-101.
27. Furuya-Kanamori L, Barendregt JJ, Doi SA. A new improved graphical and quantitative method for detecting bias in meta-analysis. Int J Evid-Based Healthc 2018;16:195-203.
PUBMED | CROSSREF
28. Akter S, Eguchi M, Kurotani K, Kochi T, Kashino I, Ito R, Kuwahara K, Tsuruoka H, Kabe I, Mizoue T. Serum 25-hydroxyvitamin D and metabolic syndrome in a Japanese working population: the Furukawa Nutrition and Health Study. Nutrition 2017;36:26-32.
PUBMED | CROSSREF
29. Amirbaigloo A, Hosseinpanah F, Sarvghadi F, Tohidi M, Eskandary PS, Azizi F. Absence of association between vitamin D deficiency and incident metabolic syndrome: Tehran Lipid and Glucose Study. Metab Syndr Relat Disord 2013;11:236-42.
PUBMED | CROSSREF
30. Bea JW, Jurutka PW, Hibler EA, Lance P, Martínez ME, Roe DJ, Sardo Molmenti CL, Thompson PA, Jacobs ET. Concentrations of the vitamin D metabolite 1,25(OH)2D and odds of metabolic syndrome and its components. Metabolism 2015;64:447-59.
PUBMED | CROSSREF
31. Chacko SA, Song Y, Manson JE, Van Horn L, Eaton C, Martin LW, McTiernan A, Curb JD, Wylie-Rosett J, Phillips LS, Plodkowski RA, Liu S. Serum 25-hydroxyvitamin D concentrations in relation to cardiometabolic risk factors and metabolic syndrome in postmenopausal women. Am J Clin Nutr 2011;94:209-17.
PUBMED | CROSSREF
32. Ford ES, Ajani UA, McGuire LC, Liu S. Concentrations of serum vitamin D and the metabolic syndrome among U.S. adults. Diabetes Care 2005;28:1228-30.
PUBMED | CROSSREF
33. Huang CY, Chang HH, Lu CW, Tseng FY, Lee LT, Huang KC. Vitamin D status and risk of metabolic syndrome among non-diabetic young adults. Clin Nutr 2015;34:484-9.
PUBMED | CROSSREF
34. Hyppönen E, Boucher BJ, Berry DJ, Power C. 25-hydroxyvitamin D, IGF-1, and metabolic syndrome at 45 years of age: a cross-sectional study in the 1958 British Birth Cohort. Diabetes 2008;57:298-305.
PUBMED | CROSSREF
35. Kim MK, Il Kang M, Won Oh K, Kwon HS, Lee JH, Lee WC, Yoon KH, Son HY. The association of serum vitamin D level with presence of metabolic syndrome and hypertension in middle-aged Korean subjects. Clin Endocrinol (Oxf ) 2010;73:330-8.
PUBMED | CROSSREF
36. Lee DM, Rutter MK, O'Neill TW, Boonen S, Vanderschueren D, Bouillon R, Bartfai G, Casanueva FF, Finn JD, Forti G, Giwercman A, Han TS, Huhtaniemi IT, Kula K, Lean ME, Pendleton N, Punab M, Silman AJ, Wu FC; European Male Ageing Study Group. Vitamin D, parathyroid hormone and the metabolic syndrome in middle-aged and older European men. Eur J Endocrinol 2009;161:947-54.
PUBMED | CROSSREF
37. Lu L, Yu Z, Pan A, Hu FB, Franco OH, Li H, Li X, Yang X, Chen Y, Lin X. Plasma 25-hydroxyvitamin D concentration and metabolic syndrome among middle-aged and elderly Chinese individuals. Diabetes Care 2009;32:1278-83.
PUBMED | CROSSREF
38. Maki KC, Fulgoni VL 3rd, Keast DR, Rains TM, Park KM, Rubin MR. Vitamin D intake and status are associated with lower prevalence of metabolic syndrome in U.S. adults: National Health and Nutrition Examination Surveys 2003–2006. Metab Syndr Relat Disord 2012;10:363-72.
PUBMED | CROSSREF
39. Gagnon C, Lu ZX, Magliano DJ, Dunstan DW, Shaw JE, Zimmet PZ, Sikaris K, Ebeling PR, Daly RM. Low serum 25-hydroxyvitamin D is associated with increased risk of the development of the metabolic syndrome at five years: results from a national, population-based prospective study (the Australian Diabetes, Obesity and Lifestyle Study: AusDiab). J Clin Endocrinol Metab 2012;97:1953-61.
PUBMED | CROSSREF
40. Vitezova A, Zillikens MC, van Herpt TT, Sijbrands EJ, Hofman A, Uitterlinden AG, Franco OH, Kiefte-de Jong JC. Vitamin D status and metabolic syndrome in the elderly: the Rotterdam Study. Eur J Endocrinol 2015;172:327-35.
PUBMED | CROSSREF
41. Huang H, Guo J, Chen Q, Chen X, Yang Y, Zhang W, Liu Y, Chen X, Yang D. The synergistic effects of vitamin D and estradiol deficiency on metabolic syndrome in Chinese postmenopausal women. Menopause 2019;26:1171-7.
42. Yeap BB, Dedic D, Budgeon CA, Murray K, Knuiman MW, Hunter M, Zhu K, Cooke BR, Lim EM, Mulrennan S, Walsh JP, Green DJ. U-shaped association of vigorous physical activity with risk of metabolic syndrome in men with low lean mass, and no interaction of physical activity and serum 25-hydroxyvitamin D with metabolic syndrome risk. Intern Med J 2020;50:460-9.
PUBMED | CROSSREF
43. Ganji V, Sukik A, Alaayesh H, Rasoulinejad H, Shraim M. Serum vitamin D concentrations are inversely related to prevalence of metabolic syndrome in Qatari women. Biofactors 2020;46:180-6.
PUBMED | CROSSREF
44. Weldegiorgis TZ, Hidru TH, Yang XL, Xia YL, Ma L, Li HH. Association between serum
25-hydroxyvitamin D concentrations and metabolic syndrome in the middle-aged and elderly Chinese population in Dalian, northeast China: a cross-sectional study. J Diabetes Investig 2020;11:184-91.
PUBMED | CROSSREF
45. Khan H, Kunutsor S, Franco OH, Chowdhury R. Vitamin D, type 2 diabetes and other metabolic outcomes: a systematic review and meta-analysis of prospective studies. Proc Nutr Soc 2013;72:89-97.
PUBMED | CROSSREF
46. Khosravi ZS, Kafeshani M, Tavasoli P, Zadeh AH, Entezari MH. Effect of vitamin D supplementation on weight loss, glycemic indices, and lipid profile in obese and overweight women: a clinical trial study. Int J Prev Med 2018;9:63.
PUBMED | CROSSREF
47. Salekzamani S, Mehralizadeh H, Ghezel A, Salekzamani Y, Jafarabadi MA, Bavil AS, Gargari BP. Effect of high-dose vitamin D supplementation on cardiometabolic risk factors in subjects with metabolic syndrome: a randomized controlled double-blind clinical trial. J Endocrinol Invest 2016;39:1303-13.
PUBMED | CROSSREF
48. Talaei A, Mohamadi M, Adgi Z. The effect of vitamin D on insulin resistance in patients with type 2 diabetes. Diabetol Metab Syndr 2013;5:8.
PUBMED | CROSSREF
49. Griffin FC, Gadegbeku CA, Sowers MR. Vitamin D and subsequent systolic hypertension among women. Am J Hypertens 2011;24:316-21.
PUBMED | CROSSREF
50. Chiu KC, Chu A, Go VL, Saad MF. Hypovitaminosis D is associated with insulin resistance and beta cell dysfunction. Am J Clin Nutr 2004;79:820-5.
PUBMED | CROSSREF
51. Liu HX, Wang YM, Hu JP, Huang LY, Fang NY. Adipocyte differentiation is regulated by mitochondrial trifunctional protein α-subunit via sirtuin 1. Exp Cell Res 2017;357:271-81.
PUBMED | CROSSREF
52. Ye X, Li M, Hou T, Gao T, Zhu WG, Yang Y. Sirtuins in glucose and lipid metabolism. Oncotarget 2017;8:1845-59.
PUBMED | CROSSREF
53. Chang E, Kim Y. Vitamin D decreases adipocyte lipid storage and increases NAD-SIRT1 pathway in 3T3-L1 adipocytes. Nutrition 2016;32:702-8.
PUBMED | CROSSREF
54. Vaidya A, Williams JS. The relationship between vitamin D and the renin-angiotensin system in the pathophysiology of hypertension, kidney disease, and diabetes. Metabolism 2012;61:450-8.
PUBMED | CROSSREF
55. Li YC. Vitamin D regulation of the renin-angiotensin system. J Cell Biochem 2003;88:327-31.
PUBMED | CROSSREF
56. Pilz S, Tomaschitz A, März W, Drechsler C, Ritz E, Zittermann A, Cavalier E, Pieber TR, Lappe JM, Grant WB, Holick MF, Dekker JM. Vitamin D, cardiovascular disease and mortality. Clin Endocrinol (Oxf ) 2011;75:575-84.
PUBMED | CROSSREF
57. Pilz S, Tomaschitz A, Drechsler C, Ritz E, Boehm BO, Grammer TB, März W. Parathyroid hormone level is associated with mortality and cardiovascular events in patients undergoing coronary angiography. Eur Heart J 2010;31:1591-8.
PUBMED | CROSSREF
58. Snijder MB, Lips P, Seidell JC, Visser M, Deeg DJ, Dekker JM, van Dam RM. Vitamin D status and parathyroid hormone levels in relation to blood pressure: a population-based study in older men and women. J Intern Med 2007;261:558-65.
59. Ahlström T, Hagström E, Larsson A, Rudberg C, Lind L, Hellman P. Correlation between plasma calcium, parathyroid hormone (PTH) and the metabolic syndrome (MetS) in a community-based cohort of men and women. Clin Endocrinol (Oxf ) 2009;71:673-8.
PUBMED | CROSSREF
60. Garbossa SG, Folli F. Vitamin D, sub-inflammation and insulin resistance. A window on a potential role for the interaction between bone and glucose metabolism. Rev Endocr Metab Disord 2017;18:243-58.
PUBMED | CROSSREF
61. Neve A, Corrado A, Cantatore FP. Immunomodulatory effects of vitamin D in peripheral blood monocyte-derived macrophages from patients with rheumatoid arthritis. Clin Exp Med 2014;14:275-83.
PUBMED | CROSSREF
62. Giulietti A, van Etten E, Overbergh L, Stoffels K, Bouillon R, Mathieu C. Monocytes from type 2 diabetic patients have a pro-inflammatory profile. 1,25-dihydroxyvitamin D(3) works as anti-inflammatory. Diabetes Res Clin Pract 2007;77:47-57.
PUBMED | CROSSREF
63. VanderWeele TJ, Ding P. Sensitivity analysis in observational research: introducing the E-value. Ann Intern Med 2017;167:268-74.