INTRODUCTION
Lung cancer continues to increase steadily around the world and remains the most common causes of death in cancer pa- tients (1, 2). Patients with unresectable lung cancer are primarily treated with chemotherapy with/without radiation therapy and are regularly followed with computed tomography (CT) scan- ning to evaluate treatment responses (3). A common method to evaluate treatment response is the Response Evaluation Criteria in Solid Tumor (RECIST) criteria, which depend largely on the longest diameter of the lesion seen on the CT images (4). It is as- sumed that the survival rates of patients who responded accord- ing to the RECIST criteria will be prolonged (5). However, con-
ventional CT may be limited in the assessment of treatment responses because the changes in tumor size can be insignificant in the early follow-up stages of treatment (6, 7).
18F-fluorodeoxyglucose positron emission tomography (18F- FDG PET) scanning offers the ability to visualize increased glu- cose metabolism in tumor cells compared with normal cells, with varying consequences for treatment outcome (8, 9). Contrast-en- hanced MRI can be useful for differentiating between malignant and benign lesions in solitary pulmonary nodules or monitoring of treatment response after chemotherapy (10-12). These new im- aging modalities based on the pathophysiology of tumor growth are increasingly used in tumor evaluations. Dynamic contrast-en- hanced CT (DCE-CT) scans have been used in monitoring tu-
J Korean Soc Radiol 2013;69(2):131-138 http://dx.doi.org/10.3348/jksr.2013.69.2.131
Received March 25, 2013; Accepted June 7, 2013 Corresponding author: Tae Hoon Kim, MD
Department of Radiology, Gangnam Severance Hospital, 211 Eonju-ro, Gangnam-gu, Seoul 135-720, Korea.
Tel. 82-2-2019-3517 Fax. 82-2-3462-5472 E-mail: [email protected]
This is an Open Access article distributed under the terms of the Creative Commons Attribution Non-Commercial License (http://creativecommons.org/licenses/by-nc/3.0) which permits unrestricted non-commercial use, distri- bution, and reproduction in any medium, provided the original work is properly cited.
This work was supported by the LG Life Sciences Radiol- ogy Research Fund for 2010.
Purpose: To evaluate the contrast enhancement patterns of lung cancer after che- motherapy using a dynamic contrast-enhanced (DCE) CT and to determine whether the enhancement patterns of tumors at early stages of treatment can predict treat- ment responses.
Materials and Methods: Forty-two patients with advanced lung cancers under- went DCE-CT and follow-up CT after chemotherapy. We evaluated peak and net en- hancement (PE and NE, respectively) and time-density curves (TDCs) (type A, B, C, and D) on DCE-CT images. Treatment responses were evaluated using revised Re- sponse Evaluation Criteria in Solid Tumor criteria.
Results: NE and PE values were significantly higher in the progressive disease (PD) groups than in the stable disease (SD) or partial response (PR) groups (p < 0.05).
Types B, C, and D on TDCs were observed mostly in the PR and SD groups (96.0%), whereas type A was most frequent in the SD and PD groups (97.2%), which were significantly different in terms of PE and NE.
Conclusion: Contrast enhancement pattern regarding the response of treatment on DCE-CT images could be helpful in predicting treatment response of advanced lung cancer after treatment.
Index terms Lung Cancer
Dynamic Computed Tomography Treatment Monitoring
Dynamic Contrast-Enhanced CT in Advanced Lung Cancer after Chemotherapy with/without Radiation Therapy: Can It Predict Treatment Responsiveness of the Tumor?
진행성폐암 환자에서 항암화학치료 또는 방사선치료 후 역동적조영증강 CT를 이용한 치료반응 평가에 대한 연구
Mi Ri Yoo, MD, Sung Ho Whang, MD, Chul Hwan Park, MD, Sang Jin Kim, MD, Tae Hoon Kim, MD
Department of Radiology and Research Institute of Radiological Science, Yonsei University Health System, Seoul, Korea
target lesions, we obtained pre-contrast CT images through the target lesions, with the field of view as small as possible in order to minimize patients’ radiation exposures. After the injection of contrast materials, subsequent DCE-CT series were obtained through the lesions at 30, 60, 90, 120 seconds, and 5 minutes. For injection of contrast media, an 18-gauge cannula was placed in the superficial vein of the antecubital fossa. A total of 100 mL of iopromide (Prosure® M300, LG Life Sciences, Seoul, Korea) was administered intravenously at a rate of 4 mL/sec using a power injector (Envision CT; Medrad, Pittsburgh, PA, USA) in all pa- tients. The exposure parameters for CT scans were 100 kVp, 175 mA, 1.2 mm collimation, table pitch 1, 500 msec rotation time, 5 mm slice thickness, and a 5 mm reconstruction increment.
CT scans at 120 seconds covered the whole thorax with 120 kVp and 175 mA for tumor re-staging, which might be changed. The dose-length product (DLP) in the CT units was used to evaluate the radiation doses received by the patient. The effective radia- tion dose was calculated by multiplying the DLP by the conver- sion coefficient (k = 0.014) for the chest, and was expressed as millisievert (mSV) (15).
Images were reconstructed on the scanner’s workstation using commercially available software (Syngo, Somaris 5®; Siemens Medical Solutions, Germany), with a slice thickness of 5 mm by using a standard algorithm. All dynamic and staging CT data were transferred to our picture archiving and communication system (PACS) (Centricity 1.0; GE Medical Systems, Mt. Pros- pect, IL, USA), which displayed all images on monitors (1536 × 2048 image matrices, 60-foot-lambert luminescence).
DCE-CT Image Analysis
Images were evaluated in one image interpretation section by consensus of two radiologists (M.R.Y. and S.H.H.) who had 4 and 8 years of experience in chest imaging interpretations. All images were set up with a mediastinal window [width, 400 Hounsfield unit (HU); level, 20 HU] and lung window (width, 1500 HU; level, -700 HU) on the PACS monitors. Target tumor size was measured based on the longest diameter of the lesions on the DCE-CT images obtained at 90 seconds after injection of contrast material and the follow-up CT images.
Attenuation values for the lesion were measured on the serial DCE-CT images with a mediastinal window. The region of in- terest (ROI) was drawn as the largest possible circle to encom- mor responses after chemotherapy or radiation therapy (13, 14).
This method is useful due to its fast data acquisitions.
However, there are some difficulties in evaluating early treat- ment responses in advanced lung cancer with the RECIST crite- ria because tumor shrinkage usually does not occur or is mini- mal until several cycles of chemotherapy have been completed (12). Therefore, the purpose of this study is to evaluate the en- hancement pattern of tumors after chemotherapy with/without radiation therapy in patients with advanced lung cancer using dynamic contrast-enhanced CT, and to assess whether the en- hancement pattern of tumors at early stages of treatment can predict treatment responses assessed by the RECIST criteria during follow-ups.
MATERIALS AND METHODS
Patients
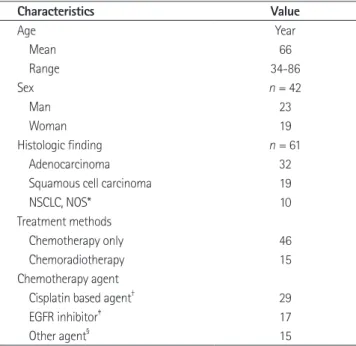
Between April 2010 and November 2011, 42 patients who had residual tumors after chemotherapy with/without radiation therapy for advanced non-small cell lung cancer (NSCLC) (stage IIIB/IV; unresectable) were retrospectively enrolled in this study. All patients underwent DCE-CT examinations with- in one month after each cycle of chemotherapy (a mean interval of 20 ± 7 days; range, 14 to 30 days). Additional follow-ups by using conventional CT scanning were performed with a time interval of 3 months between CT scans at our institute. During the follow-up period, patients who had metastatic lesions or lymph nodes in other sites were excluded in this study. Patients who had insufficient renal functions (creatinine level > 150 µmol/L) or an allergy to iodinated contrast materials were ex- cluded. Of the 42 enrolled patients, 23 were male and 19 were female. The mean age at the time of examination was 66.0 ± 13.0 years (age range, 34-86 years). Institutional Review Board approval was gained for this study and written informed con- sent was obtained from all patients for DCE-CT scans.
Dynamic Contrast-Enhanced CT Imaging
CT scans were performed with a 64-slice multi-detector CT scanner (Somatom Sensation 64; Siemens Medical Solutions, Erlangen, Germany). Scanning was performed in a craniocau- dal direction at end-inspiratory suspension with patients in the supine positions. After acquiring the scout images to localize the
sis of variance to evaluate the statistical significance of differenc- es in PE and NE values among the three groups in lesions with type A TDC pattern. Receiver operating characteristic (ROC) analysis was performed to evaluate cutoff values of WI and WO to predict the treatment response. A p-value less than 0.05 was considered statistically significant. SPSS software (version 19.0;
Statistical Package for the Social Sciences, Chicago, IL, USA) was used for statistical evaluations.
RESULTS
A total of 61 lesions were detected on the dynamic CT images in 42 patients. The characteristics of the 42 patients with ad- vanced NSCLC are summarized in Table 1. On the basis of treatment responses assessed by the RECIST criteria, there were 7 PR lesions (11.5%), 16 PD lesions (26.2%), and 38 SD lesions (62.3%). The mean longest diameter of all tumors was 2.9 ± 1.7 cm (range, 0.9 to 8.6 cm); 2.8 ± 1.0 cm in PR, 3.2 ± 2.0 cm in SD, and 2.2 ± 0.8 cm in PD (Table 2). The mean effective radia- pass the lesions. Necrotic areas, cavities, and calcifications were
avoided (13). We referred the PET images to differentiate be- tween residual tumor and atelectasis or fibrosis in cases where they were available. We computed mean values based on two measurements obtained from two ROIs for each lesion on the dynamic series of images. We obtained tumor attenuation val- ues (TAVt, in HU), where t represents each designed time point before and after the injection of contrast medium. Peak en- hancement (PE) was defined as the attenuation value with the maximum TAVt during the entire dynamic period after injec- tion of contrast medium. Time (in second) corresponding to PE during the early dynamic period was also recorded. Wash-in (WI) was calculated by subtracting the pre-enhancement atten- uation value from the PE attenuation value (PE-TAV0) (16).
Wash-out (WO) as absolute loss of enhancement was calculated by subtracting the attenuation value at 5 minutes (TAV300) from the PE value (PE-TAV300) (16).
In order to analyze the enhancement pattern on the dynamic CT images, we plotted the mean attenuation values of the le- sions at each time point as a time-density curve (TDC). TDCs were classified as one of the following four types according to WI and WO patterns: type A, an early WI and early WO pat- tern; type B, an early WI and maintaining a plateau; type C, an early WI and then continuous acceleration during the dynamic period; and type D, net enhancement less than 15 HU without an early WI pattern during the dynamic period.
Evaluation of Treatment Response
On follow-up conventional CT scans, the treatment response was evaluated according to the RECIST criteria (RECIST 1.1) as follows: complete response, disappearance of the lesions; partial response (PR), at least a 30% decrease in the diameter of the le- sion on the follow-up CT images; progressive disease (PD), a more than 20% and 5 mm absolute increase in lesion diameter;
stable disease (SD), neither sufficient shrinkage of the lesion to qualify for PR nor sufficient increases in size to qualify for PD (4).
Statistical Analysis
All parameters were presented as mean ± standard deviations.
We used Fisher’s exact test to evaluate differences of distribution of three groups formed based on the RECIST criteria between TDC type A and type B, C and D. And then, we used an analy-
Table 1. Patient Characteristics, Treatment Methods and Histologic Finding
Characteristics Value
Age Year
Mean 66
Range 34-86
Sex n = 42
Man 23
Woman 19
Histologic finding n = 61
Adenocarcinoma 32
Squamous cell carcinoma 19
NSCLC, NOS* 10
Treatment methods
Chemotherapy only 46
Chemoradiotherapy 15
Chemotherapy agent
Cisplatin based agent† 29
EGFR inhibitor‡ 17
Other agent§ 15
Note.-Except for age and sex, values are number of the lesions (n = 61).
*Confirmed as NSCLC with needle aspiration biopsy but not categorized into any of the subtype of NSCLC on pathologic report.
†Cisplatin with gemcitabine, docetaxel, paclitaxel, pemetrexel or irinotecan.
‡Erlotinib or gefinitib.
§Non-cisplatin single agent such as gemcitabine, docetaxel, pemetrexed.
EGFR = epidermal growth factor receptor, NOS = not otherwise specified, NSCLC = non-small cell lung cancer
terns of contrast enhancement according to the RECIST groups are summarized in Table 3. The TDCs showed that there were 36 type A lesions (Fig. 1), 7 type B, 16 type C (Fig. 2), and 2 type D lesions. There was statistically significant difference of distri- bution of RECIST groups between the type A lesions and the other types of the groups (p < 0.05). Most lesions that were type B (100%), type C (93.8%), or type D (100%) on the TDCs be- longed to the PR and SD groups according to the RECIST crite- tion dose for the dynamic CT scans in 42 patients was 3.5 mSV
(dose range, 2.9-5.4 mSV).
Degree and Pattern of Contrast Enhancement
The mean NE values were 46.5 ± 14.9 HU in PR, 44.9 ± 18.2 HU in SD, and 63.1 ± 13.5 HU in PD group, respectively. The PE mean values were 83.0 ± 14.9 HU in PR, 81.9 ± 18.3 HU in SD, and 98.4 ± 12.5 HU in PD group, respectively (Table 2). Pat-
Table 2. Size and Degree of Contrast Enhancement According to the Response Evaluation Criteria in Solid Tumor (RECIST) Classification after Chemotherapy (Mean Interval, 20 ± 7 days)
RECIST Diameter (cm) NE (HU) PE (HU)
PR (n = 7) 2.8 ± 1.0 46.5 ± 14.9 83.0 ± 14.9
SD (n = 38) 3.2 ± 2.0 44.9 ± 18.2 81.9 ± 18.3
PD (n = 16) 2.2 ± 0.8 63.1 ± 13.5 98.4 ± 12.5
p-value < 0.05 < 0.05
Note.-Data are mean ± standard deviations.
HU = Hounsfield unit, NE = net enhancement, PD = progressive disease, PE = peak enhancement, PR = partial response, SD = stable disease
Table 3. Time-Density Curves (TDC) According to the Response Evaluation Criteria in Solid Tumor (RECIST) Groups
RECIST Types of Time-Density Curve (TDC)*
Total (n)
A B C D
PR 1 3 3 0 7
SD 20 4 12 2 38
PD 15 0 1 0 16
Total (n) 36 7 16 2 61
Note.-*A = showing an early wash-in and early wash-out, B = showing an early wash-in and maintaining a plateau, C = showing an early wash-in and continuous acceleration, D = showing no early wash-in in the dynamic period.
PD = progressive disease, PR = partial response, SD = stable disease
Fig. 1. A 69-year-old men with stage IV non-small cell carcinoma in the left upper lobe with lung to lung metastasis.
A. Dynamic contrast-enhanced CT images at pre-contrast, 30, 60, 90, 120 sec, and 5 minutes over the lesion after chemotherapy with a cisplatin regimen.
B. The time-density curve shows early wash-in and wash-out pattern consistent with type A. Net enhancement and peak enhancement values were 44 HU and 81 HU, respectively. The lesion was categorized as progressive disease according to the Response Evaluation Criteria in Solid Tumor criteria.
Note.-HU = Hounsfield unit, TAV = tumor attenuation value
A B
30 50 70 90
Mean TAV (HU)
0 30 60 90 120 300
Time (seconds)
enhancement values indicated that the sensitivity and specificity were 62.5% and 82.2%, respectively, with a net enhancement value of 60.3 HU as a cutoff value to differentiate between the PD group and the PR or SD groups. When the cutoff value was set at 94.5 HU for the peak enhancement value, the sensitivity and specificity were 75.0% and 75.6%, respectively (Fig. 4).
DISCUSSION
In our study, we tried to demonstrate that the dynamic CT ria. There were 35 lesions showing type A patterns on the TDCs
that belonged to the SD or PD groups. The SD group comprised 20 (55.6%) and the PD group included 15 lesions (41.7%). Al- though the type A TDC pattern were exclusive to the SD or PD groups and thus could not be used to differentiate between the two groups, net and peak enhancement differed significantly among the SD and PD (p < 0.05) (Table 2, Fig. 3).
The mean values of NE and PE were significantly higher in the PD group than in the PR or SD groups according to the RE- CIST criteria (Fig. 3) (p < 0.05). The ROC curve analysis of net
Fig. 3. Mean values of net and peak enhancement in 61 lesions among three groups according to the Response Evaluation Criteria in Solid Tumor criteria on the dynamic contrast-enhanced CT images in 41 patients with advanced lung cancer.
A. Net enhancement (NE) differed significantly between the PD group and the PR or SD groups (p < 0.05).
B. Peak enhancement (PE) differed significantly between the PD group and the PR or SD groups (p < 0.05).
Note.-HU = Hounsfield unit, PD = progressive disease, PR = partial response, SD = stable disease
0.00 20.00
20.00 40.00
40.00 60.00
60.00 80.00
80.00 100.00
100.00 120.00
NE (HU) PE (HU)
PR SD PD PR SD PD
A B
Fig. 2. An 83-year-old woman with stage IV adenocarcinoma in the left upper lobe.
A. Dynamic contrast-enhanced CT images at pre-contrast, 30, 60, 90, 120 sec, and 5 minutes over the lesion after chemotherapy with agefinitib regimen.
B. The time-density curve shows early wash-in and continuous acceleration pattern consistent with type C. Net enhancement and peak en- hancement values were 40 HU and 70 HU, respectively. The lesion was categorized as stable disease according to the Response Evaluation Criteria in Solid Tumor criteria.
Note.-HU = Hounsfield unit, TAV = tumor attenuation value
A B
20 40 60 80
Mean TAV (HU)
0 30 60 90 120 300
Time (seconds)
differentiation of progressive disease from stable or responding disease is important. Most of the type A lesions which shows early WI and WO patterns on dynamic CT were included in SD and PD groups on the follow-up conventional CT. Although TDC patterns were not useful for differentiations between the SD and the PD groups in our study, the NE and PE of the le- sions were significantly higher in the PD group as compared with the PR and SD groups.
The NE and PE of lesions have been used to differentiate be- tween benign and malignant lung tumors on the DCE-CT im- ages. Jeong et al. (16) reported that nodules showing persistent enhancements of ≥ 25 HU in 2 minutes and 5-31 HU WO on the delayed phase were usually malignant, and lesions with less than 25 HU WI and without WO greater than 31 HU were usu- ally benign. Donmez et al. (18) demonstrated that all malignant lesions except one lung cancer had an early peak enhancement with rapid WO, and all benign lesions displayed early increasing enhancements with an early plateau within 2 minutes after con- trast administration or with a late plateau in 4 minutes on dy- namic MRI. On the perfusion CT images the sensitivity, specifici- ty, and accuracy for differentiating between benign and malignant nodules were 96.4%, 69.6%, and 84.3%, respectively, for a cutoff NE value set at 20 HU (20). In our study, we demonstrated that when the cutoff values were set at 94.5 HU for PE and at 60.3 HU for NE, the sensitivities and specificities for differentiating between the PD group and PR or SD group were 75.0% and 75.6% in PE and were 62.5% and 82.2% in NE, respectively.
Generally, the tumor response to radiation therapy is believed to be a slow process with maximum response (minimum volume) an average of 5-11 months after radiation therapy completions (21, 22). In this study, 15 lesions were treated with chemo-radiotherapy but mean interval between termination of radiotherapy and time of dynamic CT taken were 292 days (range, 86 to 600 days), which might be explained that radiation itself may have little ef- fects on acute microvascular damages.
Our study has a few obstacles which will be bridged in the fu- ture. First, the study population was too small to generalize the results, especially with respect to the PR group. Second, we did not compare directly the degree or pattern of contrast enhance- ments before and after treatment. We need to understand the pattern of contrast enhancement before treatment, and how it changes after treatment according to treatment response status.
might be helpful to predict the effects of chemotherapy with the assessment of enhancement patterns in dynamic CT in response to therapy as RECIST criteria.
It is clinically important for imaging studies to non-invasively monitor treatment responses during the follow-up period after chemotherapy with/without radiation therapy. However, it is still difficult to evaluate treatment responses in the early follow- up stages of treatment because the change in lesion size may be insignificant according to the RECIST criteria (6, 12). Until now, only a few studies reported that the dynamic contrast enhance- ment pattern could be useful in assessing the blood supply of tu- mor tissues and in predicting treatment outcomes (12, 17). Lind et al. (13) also reported that blood flow into the tumor de- creased more significantly in the RECIST/Crabb respondents rather than in the non-respondents and was negatively correlat- ed with progression-free survival rates.
Donmez et al. (18) demonstrated that most of the malignant lesions had early peak enhancements with rapid washouts on dy- namic MRI. Furthermore, when clinicians evaluated the treat- ment responses after chemotherapy in patients with advanced NSCLC, it is recommended that once the disease was defined as progressive disease according to RECIST criteria, the regimen should be changed to second line therapy but patients experi- enced the clinical benefits in terms of stable disease or response, the clinician would continue the regimen or observe (19). Hence, Fig. 4. Receiver operating characteristic curves of peak enhancement (PE) and net enhancement (NE) values. Sensitivity and specificity for differentiating between the PD group and the PR or SD groups were 62.5% and 82.2%, respectively, at a cutoff NE value of 60.3 HU, and 75.0% and 75.6%, respectively, at a cutoff PE value of 94.5 HU.
Note.-HU = Hounsfield unit, PD = progressive disease, PR = partial response, SD = stable disease
0.0 0.2 0.4 0.6 0.8 1.0
Sensitivity
0.0 0.2 0.4 0.6 0.8 1.0
1-specificity
PE NE
dicts clinical benefit in advanced non-small-cell lung can- cer: results from Southwest Oncology Group randomized trials. J Clin Oncol 2008;26:463-467
6. Suzuki C, Jacobsson H, Hatschek T, Torkzad MR, Bodén K, Eriksson-Alm Y, et al. Radiologic measurements of tumor response to treatment: practical approaches and limita- tions. Radiographics 2008;28:329-344
7. Mazumdar M, Smith A, Schwartz LH. A statistical simula- tion study finds discordance between WHO criteria and RECIST guideline. J Clin Epidemiol 2004;57:358-365 8. Dorow DS, Cullinane C, Conus N, Roselt P, Binns D, McCar-
thy TJ, et al. Multi-tracer small animal PET imaging of the tumour response to the novel pan-Erb-B inhibitor CI- 1033. Eur J Nucl Med Mol Imaging 2006;33:441-452 9. Su H, Bodenstein C, Dumont RA, Seimbille Y, Dubinett S,
Phelps ME, et al. Monitoring tumor glucose utilization by positron emission tomography for the prediction of treat- ment response to epidermal growth factor receptor kinase inhibitors. Clin Cancer Res 2006;12:5659-5667
10. Schaefer JF, Vollmar J, Schick F, Vonthein R, Seemann MD, Aebert H, et al. Solitary pulmonary nodules: dynamic con- trast-enhanced MR imaging--perfusion differences in ma- lignant and benign lesions. Radiology 2004;232:544-553 11. Zou Y, Zhang M, Wang Q, Shang D, Wang L, Yu G. Quanti-
tative investigation of solitary pulmonary nodules: dy- namic contrast-enhanced MRI and histopathologic analy- sis. AJR Am J Roentgenol 2008;191:252-259
12. de Langen AJ, van den Boogaart V, Lubberink M, Backes WH, Marcus JT, van Tinteren H, et al. Monitoring response to antiangiogenic therapy in non-small cell lung cancer using imaging markers derived from PET and dynamic contrast-enhanced MRI. J Nucl Med 2011;52:48-55 13. Lind JS, Meijerink MR, Dingemans AM, van Kuijk C, Ollers
MC, de Ruysscher D, et al. Dynamic contrast-enhanced CT in patients treated with sorafenib and erlotinib for non- small cell lung cancer: a new method of monitoring treat- ment? Eur Radiol 2010;20:2890-2898
14. Kiessling F, Boese J, Corvinus C, Ederle JR, Zuna I, Schoen- berg SO, et al. Perfusion CT in patients with advanced bron- chial carcinomas: a novel chance for characterization and treatment monitoring? Eur Radiol 2004;14:1226-1233 15. Valentin J. Avoidance of radiation injuries from medical Third, the delayed imaging time was slightly short at 5 minutes.
In order to precisely evaluate the WO patterns of contrast me- dia, it might be helpful to take the additional dynamic CT imag- es after 5 minutes (16). Fourth, although we measured the atten- uation values in the areas apart from tumor necrosis, cavities, it was sometimes difficult to differentiate between fibrosis by radi- ation therapy and residual tumor in the lesions. It will be neces- sary to further study the PET scan to evaluate the tumor viabili- ty. Finally, patients were exposed to extra radiations due to the routine scans for tumor staging plus the additional dynamic scans when compared with that of our other studies (3.3 mSV;
dose range: 2.9-5.2 mSV).
In conclusion, the type A TDC pattern, defined as early WI and early WO of contrast enhancement, was observed mostly on the dynamic CT images in the SD and PD groups classified by the RECIST criteria. The SD and PD groups showing that type A TDC pattern of contrast enhancements can be differenti- ated according to PE or NE values, which are significantly high- er in the PD group as compared with the SD group. Therefore, DCE-CT scans can be helpful for predicting treatment response outcomes according to the RECIST criteria in patients with ad- vanced lung cancers after chemotherapy with/without radiation therapy.
REFERENCES
1. Jemal A, Siegel R, Ward E, Murray T, Xu J, Thun MJ. Cancer statistics, 2007. CA Cancer J Clin 2007;57:43-66
2. Schiller JH, Harrington D, Belani CP, Langer C, Sandler A, Krook J, et al. Comparison of four chemotherapy regimens for advanced non-small-cell lung cancer. N Engl J Med 2002;346:92-98
3. Pfister DG, Johnson DH, Azzoli CG, Sause W, Smith TJ, Baker S Jr, et al. American Society of Clinical Oncology treatment of unresectable non-small-cell lung cancer guideline: up- date 2003. J Clin Oncol 2004;22:330-353
4. Eisenhauer EA, Therasse P, Bogaerts J, Schwartz LH, Sar- gent D, Ford R, et al. New response evaluation criteria in solid tumours: revised RECIST guideline (version 1.1). Eur J Cancer 2009;45:228-247
5. Lara PN Jr, Redman MW, Kelly K, Edelman MJ, Williamson SK, Crowley JJ, et al. Disease control rate at 8 weeks pre-
small-cell lung cancer. J Clin Oncol 2009;27:6251-6266 20. Jiang NC, Han P, Zhou CK, Zheng JL, Shi HS, Xiao J. Dy-
namic enhancement patterns of solitary pulmonary nod- ules at multi-detector row CT and correlation with vascu- lar endothelial growth factor and microvessel density. Ai Zheng 2009;28:164-169
21. Woodford C, Yartsev S, Dar AR, Bauman G, Van Dyk J.
Adaptive radiotherapy planning on decreasing gross tu- mor volumes as seen on megavoltage computed tomogra- phy images. Int J Radiat Oncol Biol Phys 2007;69:1316- 1322
22. Werner-Wasik M, Xiao Y, Pequignot E, Curran WJ, Hauck W. Assessment of lung cancer response after nonoperative therapy: tumor diameter, bidimensional product, and vol- ume. A serial CT scan-based study. Int J Radiat Oncol Biol Phys 2001;51:56-61
interventional procedures. Ann ICRP 2000;30:7-67 16. Jeong YJ, Lee KS, Jeong SY, Chung MJ, Shim SS, Kim H, et
al. Solitary pulmonary nodule: characterization with com- bined wash-in and washout features at dynamic multi- detector row CT. Radiology 2005;237:675-683
17. Lazanyi KS, Abramyuk A, Wolf G, Tokalov S, Zöphel K, Ap- pold S, et al. Usefulness of dynamic contrast enhanced computed tomography in patients with non-small-cell lung cancer scheduled for radiation therapy. Lung Cancer 2010;70:280-285
18. Donmez FY, Yekeler E, Saeidi V, Tunaci A, Tunaci M, Acunas G. Dynamic contrast enhancement patterns of solitary pulmonary nodules on 3D gradient-recalled echo MRI. AJR Am J Roentgenol 2007;189:1380-1386
19. Azzoli CG, Baker S Jr, Temin S, Pao W, Aliff T, Brahmer J, et al. American Society of Clinical Oncology Clinical Practice Guideline update on chemotherapy for stage IV non-
진행성폐암 환자에서 항암화학치료 또는 방사선치료 후 역동적조영증강 CT를 이용한 치료반응 평가에 대한 연구
유미리 · 황성호 · 박철환 · 김상진 · 김태훈
목적: 진행형폐암 환자에서 화학요법 후 dynamic contrast-enhanced CT (DCE-CT)를 이용한 조영증강 양상을 평가하 고, 치료 초기 단계의 조영증강 양상으로 치료반응을 조기에 예측할 수 있는지 알아보고자 하였다.
대상과 방법: 진행성폐암 환자 중에서 화학요법과 방사선치료 후 DCE-CT와 추적 CT를 시행한 환자 42명을 대상으로 하였다. DCE-CT 영상에서 최고 및 순수 조영증강(peak and net enhancement; PE, NE) 정도 및 시간-음영곡선(time- density curve; TDC)에 따라 4가지 형태의 조영증강 양상(A, B, C, D형)을 평가하였다. 치료반응은 개정된 Response Evaluation Criteria in Solid Tumor로 평가했다.
결과: NE와 PE 값은 진행형(progressive disease; PD)군이 안정형(stable disease; SD) 혹은 부분관해(partial response;
PR)군보다 유의하게 높았다(p < 0.05). TDC상에서 B, C, 그리고 D형은 PR과 SD군에서 대부분 관찰되었다(96.0%).
반면, A형은 SD와 PD군에서 대부분 관찰되었으며(97.2%), SD와 PD군 사이에 PE와 NE 값은 통계적으로 유의한 차이 가 있었다(p < 0.05).
결론: DCE-CT에서 조영증강 양상은 치료 결과에 따라 유의하게 달랐다. 그러므로, DCE-CT는 진행성폐암에서 치료반 응을 예측하는 데 도움이 될 수 있다.
연세의료원 영상의학과 영상과학연구소