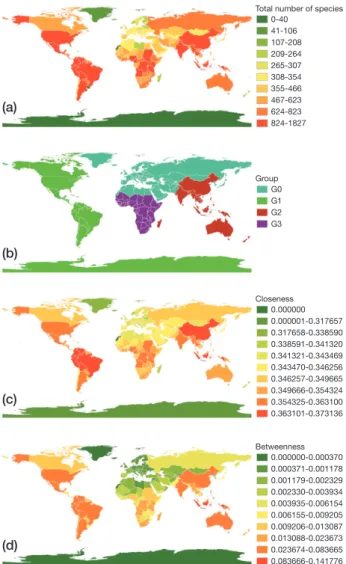
Co-occurrence Patterns of Bird Species in the World
5
0
0
전체 글
(2)
(3)
(4)
(5)
수치
관련 문서
Common corporate digital crimes include piracy, financial fraud, espionage, and theft of services.. _______________________________________ such as
1 John Owen, Justification by Faith Alone, in The Works of John Owen, ed. John Bolt, trans. Scott Clark, "Do This and Live: Christ's Active Obedience as the
First, elementary school teachers were aware of the necessity to operate the English curriculum based on key competencies, but they perceived their efforts
There is well-rounded education based on the personality in the pursuit of the alternative school; for example, the study of ‘mind’ represents in the Won-buddhism, which
The daily variation of the extreme temperature, correlation between continentality and oceanity, and extreme value occurrence time were studied for the
This study was conducted to investigate the storage period and optimal temperature of seed potato which were based on technique of dormancy prolonging by
The surface of untreated Ti, SLA treated Ti, and AA plasma polymerized SLA/Ti were also examined for their proliferation and differentiation of
This study examined the achievement, satisfaction and interest of an English grammar class based on flipped learning in order to find out the effect of
