Print ISSN: 2288-4637 / Online ISSN 2288-4645 doi:10.13106/jafeb.2021.vol8.no2.0123
Critical Factors Affecting Customers’ Purchase Intention of Insurance Policies in Indonesia
Adinoto NURSIANA
1, Fongnawati BUDHIJONO
2, Muhammad FUAD
3Received: November 05, 2020 Revised: December 30, 2020 Accepted: January 08, 2021
Abstract
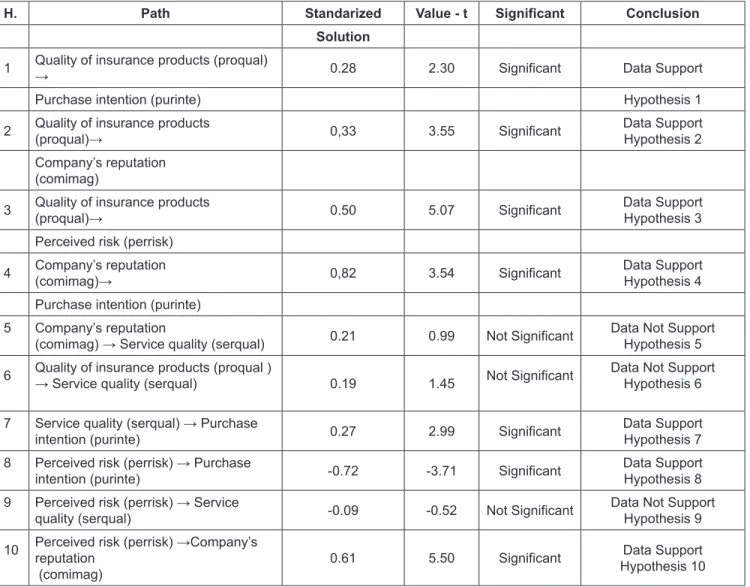
The purpose of this study was to analyze the influence of product quality factors, product risk, company reputation, and service quality on the purchase intention of insurance policies by customers in Indonesia. The variables in this study are product quality, service quality, company reputation, perceived risk, and purchase intention. This study uses a quantitative approach. Primary data were obtained from 154 respondents. Data processing and model testing use the Structural Equation Modeling procedure with Lisrel 8.80. At the significance level of 0.05, the research found that product quality had a positive and significant effect on purchase intention; product quality had a positive and significant effect on company reputation; product quality had a positive and significant effect on perceived risk perception; company reputation had a positive and significant effect on purchase intention; company reputation has a positive and insignificant effect on service quality; product quality has a positive, but non-significant effect on service quality; service quality has a positive and significant effect on purchase intention; perceived risk has a negative and significant effect on purchase intention; perceived risk has a positive and significant impact on service quality; and perceived risk has a positive and significant effect on company reputation.
Keywords: Company Reputation, Product Quality, Perceived Risk, Service Quality, Purchase Intention JEL Classification Code: M30, M31, M38, M40
The customer’s decision to buy a product depends on whether the product purchased has a value according to the price or sacrifice consented by the customer (Andaleeb &
Conway, 2006; Dipin & Ashish, 2014). The customer will buy an insurance company product that has high value and low risk, in other words, the purchase of insurance products is related to product quality and risk (Tran, 2020, Tham et al., 2019; Yang et al., 2015, Harridge, 2006). However, research from Weedige et al. (2019) and Chen et al. (2017) found that the purchase intention of customers for insurance products is not related to risk; beside that customers pay attention to the reputation of the company that sells the product (Xu et al., 2005; Cabral, 2000).
Insurance companies are service companies, so to increase buying interest, the services provided to customers by insurance companies are very important (Szymanski &
Henard, 2001; Abdullah et al., 2009). Customers will buy insurance from a company that can provide good services, in other words, the customer’s purchase intention is influenced by the services provided by the company, and companies that have a good reputation will provide good service quality as well. (Tran & Le, 2020; Klongthong et al., 2020; Siddiqui and Sharma, 2010). In addition to the good
1
First Author and Corresponding Author. Faculty Member, Sekolah Tinggi Ilmu Ekonomi Wiyatamandala, Jakarta, Indonesia [Postal Address: Jalan Mangga Dua Raya No. 8 Blok 20-22 Kelurahan Pinangsia, Kecamatan Taman Sari, Jakarta, 11110, Indonesia]
Email: [email protected]
2
Faculty Member, Universitas Prasetiya Mulya, Indonesia.
Email: [email protected]
3
Faculty Member, Institut Bisnis dan Informatika Kwik Kian Gie, Indonesia. Email: [email protected]
© Copyright: The Author(s)
This is an Open Access article distributed under the terms of the Creative Commons Attribution Non-Commercial License (https://creativecommons.org/licenses/by-nc/4.0/) which permits unrestricted non-commercial use, distribution, and reproduction in any medium, provided the original work is properly cited.
1. Introduction
Everyone in life faces risk. Since risk is almost always inherent in human life, it must be managed properly (Bong et al., 2019). One way to reduce this risk is to buy an insurance policy from an insurance company (Abdel et al., 2015).
Currently, insurance companies in Indonesia are growing
rapidly, which results in competition for their customers,
thus requiring insurance companies to develop defense
strategies to avoid losing customers (Gardener et al., 1999).
quality of service from insurance companies, customers will also choose products that are of good quality (Ulaga, 2003;
Umamaheswari, 2019). The customer’s decision to buy a product depends on whether the product purchased has a value according to the price or sacrifice consented by the customer (Andaleeb & Conway, 2006), besides that, the customer pays attention to the reputation of the company that sold the product (Xu et al., 2005; Cabral, 2000).
Products that are assessed by customers result in companies that can provide good service, and good service quality will gain an increased company reputation (Gatti et al., 2012;
Giovanis, 2017).
The purpose of this study was to analyze the influence of product quality factors, product risk, company reputation, and service quality on the purchase intention of insurance policies by customers.
2. Literature Review 2.1. Product Quality
Product quality is defined as the customer’s assessment of the products they buy (Atinga et al., 2011; Agyapong et al., 2018). If the quality of the product is higher than the expectation, the customer will feel the product is of high quality and vice versa (Bicen, 2015; Zeithaml, 1988; Zeithaml et al., 1996). Products are divided into tangible products and intangible products. In life insurance companies, the products provided are intangible products in the form of protection and investment (Vijaya, 2016). Customers will calculate how many benefits are obtained from the products and services and the sacrifice of not purchasing competitors’
products (Sirdeshmukh et al., 2002). If the benefits of the product obtained do not match his expectations, then he will no longer use the products and services of the company and will move to competing companies that can provide higher value (Ulaga, 2003; Zeithaml, 1988; Lai et al., 2009;
Ganesan, 1994). The quality of the product provided to customers will affect customer satisfaction (Steenkamp, 1990; Lai et al., 2009).
2.2. Perceived Risk
The risk felt by customers is a phenomenon of uncertainty faced by customers in the purchasing process because they made the wrong decision (Bong et al., 2019). Risk can also be defined as consumer confidence about the potential negative and uncertain results of transactions made (Bong et al., 2019;
Kim et al., 2007). Based on the theory of risk perceived by customers, customers perceived risk because they face uncertainty and undesirable consequences for decisions that do not match their expectations (Masoud, 2013; Pavlou,
2003; Bong et al., 2019). The concept of perceived risk can be classified into various types, namely, security risk and privacy risk (Zikmund & Scott, 1973; Peter & Ryan, 1976;
Sandeep, 2016). The level of perceived risk can be reduced by its relationship with the transaction process carried out (Pavlou, 2003; Koufaris & Hampton, 2004; Ostrowska, 2019). There is a positive relationship between perceived risk, perceived security, and perceived privacy on trust (Murkherjee & Nath, 2007; Mirabi et al., 2015; Yoon & Lee, 2014).
2.3. Company Reputation
The company’s reputation is related to physical attributes and company behavior, such as the name of the company, the shape of the company’s office building, products, services, and the way the company communicates with its customers (Guru & Umamaheswari, 2018; Li, 2013; Nguyen & Leblanc, 2001). The company’s reputation is a valuable asset and must be taken care of by the company (Faullant et al., 2008). With a good reputation, the company will find it easier to get loyal customers; in the end the company will benefit because it can save promotional costs and transaction costs in selling its products because customers trust a company that has a good reputation (Famiyeh et al., 2018; Xu et al., 2005). A company’s reputation is a customer’s perception of the company (Lai & Babin, 2009). Customers will be more confident in brand products from companies that have a good reputation (Faullant et al., 2008). In general, companies with a good reputation will be able to satisfy customers, and result in customers not moving to products of other companies (Wen et al., 2004).
2.4. Service Quality
Service quality is one of the important things for an insurance company to be able to compete with other insurance companies (Bloemer et al., 1999; Bolton & Drew., 1991;
Caruana, 2002). With good service quality, customers will not switch to other insurance companies and the insurance company can even increase the number of customers who come from unsatisfied insurance companies with the services provided (Caruana, 2002; Bitner & Hubbert, 1994). Service quality is the difference between customer perceptions of service and what customers expect from the company (Parasuraman et al., 1994; Bitner & Hubbert, 1994; Caruana, 2002). This service quality includes facilities and the relationship between employees and customers (Olorunniwo et al., 2006).
Service quality is a comparison of the perception of
the level of service received by customers with customer
expectations (Liu et al., 2000) Providing the best quality service is the most effective way to compete with other companies, and is a weapon that is widely used by leading companies (Elgin & Nedunchezhian, 2012). Customers will remain loyal to the company if the value received is better than expected compared to competing companies (Kumar, 2004; Palmatier et al., 2007). While service quality is important to convince customers to choosing an insurance company that can provide better service than the others, many companies realize that by providing consistent quality of service, they will get the customer’s intention to buy the product (Kumar, 2004). There is a positive and significant relationship between service quality and customer intention to buy company products (Palmatier et al., 2007). To increase service value, company should concentrate more on aspects of service quality than customer satisfaction (Wu et al., 2011).
However, improvements made to aspects of service quality will also increase customer satisfaction because service quality can also be a benchmark for customer satisfaction (Umamaheswari, 2019). Service quality is the main predictor of customer intention to buy company products (Li, 2013).
2.5. Customer’s Purchase Intention
Purchase intention is the customer’s preference to purchase a product or service (Agyapong et al., 2018). In other words, purchase intention has another aspect, namely, that the customer will buy the product after evaluating the products and services offered by the company (Bolton &
Drew, 1991; Gundersen et al., 1996). Purchase intention is the result of an evaluation of the comparison of expectations with perceptions of the product experience (Oliver, 1980).
Purchase intention is usually related to consumer behavior, perceptions and attitudes (Oliver, 1993; Oliver, 1999;
Sebjan & Tominc, 2015). Purchasing behavior is a key point for consumers to access and evaluate certain products (Umamaheswari, 2019; Hong & Cha, 2013). If the product is in accordance with their expectations, customers will be satisfied with these products and services, which positively affect company profits (Anderson et al., 1994; Luo &
Homburg, 2007).
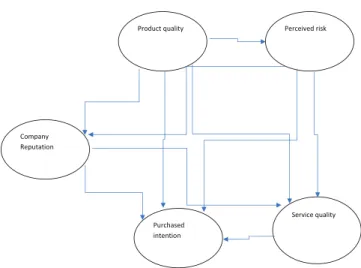
3. Research Model
The purchase intention of customers depends on the quality of the product, the quality of service and the reputation of the company that sells the product (Xu et al., 2005; Cabral, 2000). Customers’ purchase intentions are also influenced by the use and risk of the product (Hong & Cha, 2013; Masoud, 2013). Based on the explanation above, the following research model was formulated:
4. Hypothesis Formulation 4.1. Hypothesis 1, 2,3
Every insurance company strives to provide quality products according that meet the needs of its customers.
The quality of insurance products will influence customers to make purchases (Wang & Hazen, 2016), and creating a company reputation and product quality will also affect the risk perceived by customers (Parasuraman et al., 1994;
Abdullah et al., 2009; Andaleeb & Conway, 2006; Sebjan &
Tominc, 2015). From the above explanation, the following hypotheses are formulated:
H1: The quality of insurance products has a positive and significant effect on purchase intention.
H2: The quality of the insurance product has a positive and significant effect on the company’s reputation
H3: The quality of insurance products has a positive and significant effect on perceived risk.
4.2. Hypotheses 4, 5, 6 and 7
Before making a decision to buy an insurance policy, consumers will seek information about the insurance company and how the company’s reputation in serving its customers. The company’s reputation represents the communication process created by the company and specific messages about the mission, vision, goals and main values given to customers (Klongthong et al., 2020; Bravo et al., 2009). From this explanation, the following hypotheses can be formulated:
Company Reputation
Product quality
Purchased intention
Perceived risk
Service quality