J. Kor. Soc. Fish. Tech., 45(4), 223 233, 2009 DOI:10.3796/KSFT.2009.45.4.223
A primary study on the effect of artificial disturbance on a fishing area by shrimp beam trawl
Bong-Jin C HA *, Sang-Pil Y OON
1, Jae-Soung L EE
1, Soung-gill K IM
1, Rae-Hong J UNG
1, Won-Duck Y OON
2and Jong-keun S HIN
3Fisheries Resources and Environment Division, West Sea Fisheries Research Institute, NFRDI, Incheon 400-420, Korea
1
Tidal Flat Research Instiute, NFRDI, Gunsan 573-882, Korea
2
Environment Research Division, NFRDI, Busan 619-902, Korea
3
Ecology and Oceanography Division, NFRDI, Busan 619-902, Korea
4
Research and Development Planning Division, NFRDI, Busan 619-902, Korea
It has been considered that fishing areas for shrimp beam trawl have been in ruin because Korean local governments have permitted trawling into the areas limited by the fisheries local regulations from 1994.
Physical and biological effects of the trawling were investigated in the study. Physical effects were investigated by optical methods such as trawling tracking by side scan sonar and comparing the gear both before and after trawling. Biological aspects were investigated by grab sampling of benthic animals, concentration of trace metals in sediment and a flux evaluation of NH 4
+
, PO 4 , and SiO 2 by coring. The fishing activity had physical impacts on the seabed but these recovered naturally in less than fourty days naturally, which increased the benthic biodiversity, increases the trace metal concentration of and nutrient flux into the seawater, especially phosphate and silicate. This method and these results can help in further studies looking for disturbances by fishing.
Key words : Fishing disturbance, Shrimp beam trawl, Trawling impact, Side scanning, Biological aspect
* Corresponding author: [email protected], Tel:82-32-724-0631, Fax: 82-32-724-0569
2004 2006 59 61
, ,
,
. , 61
.
30
(Michael, 2005),
(Malik and Mayer, 2007),
(Biasi, 2004;
Simpson and Watling, 2006),
(Duineveld et al., 2007),
(Burridge et al., 2002),
(megafaunal benthic communities) (Kaiser et al,. 1998) . FAO(Fisheries Technical paper, 2005)
.
.
, ,
, .
, 20
(side scan sonar) , ,
.
(side scan sonar, S150I, DSME U-Tech, Korea)
.
9 40
.
Fig. 1 b
,
Fig. 1. The area of the investigation around Gujora in Geoje island.
34 48 N
34 43 N Gujora
a
b
128 38 E 128 44 E
. Fig. 1
,
Fig. 1
a .
. Fig. 2
.
2007 4
7
Fig. 1 b Fig. 1. a
1 .
0.05m
2van Veen grab
2 .
1.0mm
, 10%
.
, .
(m
2) .
2007 7 Fig. 1 b
.
, HNO 3 : HClO 4 : HF=2 : 1 : 2
ICP MS (Elan 6000, Perkim Elmer) Cu, Cd, Pb, Cr, As, Zn
. 80 C ( Φ 63μm)
.
1g 50mL
(HNO 3 : HF : HClO 4 2 :
2 : 1) .
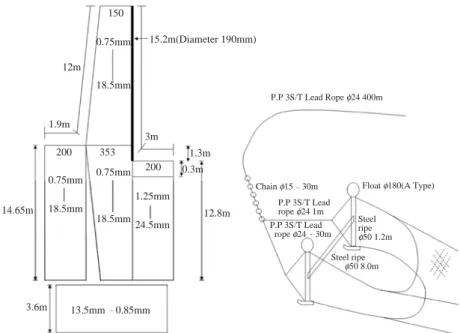
Fig. 2. Drawings and diagram of the shrimp beam trawl used in the experiment.
150
200 353 200 0.75mm
0.75mm 1.25mm 24.5mm 0.75mm
18.5mm 18.5mm
18.5mm 12m
3.6m 14.65m
3m
0.3m
12.8m
13.5mm 0.85mm
15.2m(Diameter 190mm)
P.P 3S/T Lead Rope φ24 400m
Chain φ15 30m Float φ180(A Type) P.P 3S/T Lead
rope φ24 1m P.P 3S/T Lead rope φ24 30m
Steel ripe φ50 1.2m Steel ripe
φ50 8.0m 1.3m
1.9m
2% HNO 3 100mL .
(ICP MS, Perkin
Elmer, Elan 6000) , Hg
(Milestone, AMA 254) .
Standard Reference Material PACS 2(Marine
Sediment) ,
class 100 clean room .
2007 4 Fig. 1 b
Fig. 1 a
.
(Lenght:40cm, Diameter : 8cm, Acryl)
. ,
. 0.45 m
.
, Fig. 3 (a)
Fig. 3. Detecting of recovering process of the disturbance from trawling the seabed by the side scan sonar in (a) of the Fig. 1.
(a) : Just after
(b) : 9 days after
(c) : 40 days after
.
8m ,
Fig. 4
.
3 8cm ,
6 10cm
. Fig. 3
(b) 8 11 7
Fig. 3 (c)
12 10
. , 40 . ,
. ,
.
. Fig. 5
2
.
,
, Fig. 5
,
.
.
.
,
Fig. 4. Changing of detected parts(Ski) of the gear on the seabed after trawling.
Fig. 5. Snapshots from the recording for the ground rope
movement of the shrimp beam trawl according to time
series in the fishing area and shrimp season that was
recorded by underwater camera attached to float line
during trawling.
.
Fig. 6
, Fig. 7
, Table 1 ,
Exp (Experiment) Con
(Control) . , Exp1
, Con1 , Exp2 , Con2
. Fig. 6
58% ,
.
. ,
.
Fig. 7 Table 1 22
44
.
. 780 2800ind./
3
Fig. 7. The species, density and diversity of polychaete Community in the experiments and controls(Con : Fishing area, Exp : non-fishing area ; Exp1, Con1 : fishing season, Exp2, Con2 : fishing off season).
Fig. 6. Ratio of the number of fauna in the experiments and controls(Con : Fishing area, Exp : non-fishing area ; Exp1, Con1 : fishing season, Exp2, Con2 : fishing off season).
100%
80%
60%
40%
20%
0%
50 40
30 20
10 0
4
3
2
1
0
No. species(taxa/0.1m
2) Density(ind./m
2) Diversity(H )
3000 2500 2000 1500 1000 500 0 Exp1 Con1 Exp2 Con2
Exp1 Con1 Exp2 Con2 Exp1 Con1 Exp2 Con2 Exp1 Con1 Exp2 Con2
Polychaeta Crustacea Mollusca Other
Table 1. Collected species from two sites around Geoje island(Con : Fishing area, Exp : non fishing area ; Exp1, Con1 : fishing season, Exp2, Con2 : fishing off season)
A specific species Mediomastus californiensis Magelona japonica Ampharete arctica Euchone alicaudata Sigambra tentaculata Heteromastus filiformis Ammotrypane aulogaster Glycinde gurjanovae Nephtys oligobranchia Cirratulidae sp.
Flabelligeridae sp.
Aquilaspio krusandensis Glycera chirori Paraprionospio pinnata Tharyx sp.
Polydora sp.
Sternaspis scutata Lumbrineris longifolia Minuspio multibranchiata Ophiodromus pugettensis Pseudopolydora paucibranchiata Amaeana occidentalis Aricidea neosucica nipponica Loimia medusa
Lumbrineris japonica Scoloplos armiger Eumida sanguinea Spiochaetopterus koreana Aphelochaeta monilaris Chone teres
Amphisamytha japonica Dorvillea rudolphi Lygdamis giardi Scolelepis sp.
Anaitides koreana Aonides oxycephala Cabia pilargiformis japonica Minuspio pulchra Nectoneanthes multignatha Prionospio paradisea Spiophanes kroeyeri Syllidae sp.
Cirrophorus branchiatus Diopatra sugokai Exogone uniformis Harmothoninae sp.
Nereis longior Pilargis berkeleyae Pista cristata Prionospio saccifera Amphicteis genneri Chaetozone sp.
Clymenella koreana Heterospio sinica Inermonephtys gallardi Leiochrides sp.
Lumbrineris cruzensis Mellina elisabethae Notomastus latericeus Owenia fusiformis Spiophanes bombyx Trochochaeta sp.
Total number Total Species number
Exp 1 Con1 Exp2 Con2
6 20 45 1 15
1 3 5 22
1 15
7 5 9
4 1 2 6 3 7 6 1 4 5 1 4 3 3 1 3 3 2 2 2 1 2 1 2
1 1
1 1 1 1
7 22
4 4 1 2 6
3 3 2 2 5 4 2 1 4
1
1 1
1
1
1
87 7 35
8 27 27 18 6 3 1 10
3 2 6 4 8 7 3 2
2 1
1
1 3 1
1 1
2 1
1 1
5 18
9 2 1 4 6 17
1 8 2 1 2
1 1 3
2
3 2 3
1
1 1
1 1
1
230 44
78 22
280 31
97
26
.
.
. ,
.
,
. ,
,
,
.
(Kaiser et al. 1998, FAO 2005)
.
, Food
Web(Marta Coll et al., 2002)
.
Fig. 8
,
. Cd Zn
,
NOAA ERL(Effect Range Low)
.
8cm, 10cm
,
. ,
,
. Fig. 8. Density of trace metals before trawling and after trawling in the fishing area and shrimp season.
150
100
50
0
0.15
0.10
0.05
0.00
Metal concentration(mg/kg) Cd. Ha concentration(ma/ka)
Ou Pb Or As Zn Hg Od Trace metal
Before
After
( , , )
Table 2 Fig. 9 ,
6 7cm
.
, 8 9cm
.
1.5 .
Fig. 9. Vertical distributions of dissolve ammonium, phosphate, and silicate in pore water of the fishing and non-fishing area. The vertical error bars represent the range of sampling depth.
Table 2. Benthic fluxes of porewater ammonium, phosphate, silicate of the fishing and non-fishing area
NH
4+
PO
43
Si(OH)
4(mmol m
2yr
1)
Fishing 12.8 0.28 13.4
Non-fishing 15.3 1.91 22.2
2 0 2 4 6 8 10 12 14 16
0 30 60 90 120 150
0 30 60 90
200 300 400 500
Fishing area NH
4+
fishing
(μM) NH
4+
(μM)
PO
4 3fishing
( μM) PO
43