* Corresponding author : Chang Sug Lee, The industrial R&D center, Korea Spectral Products, KSP, Seoul 152-779, Korea, Tel:
+82-2-2109-8871, Fax: +82-2-2109-8872 E-mail: [email protected]
Prediction of Nutrient Composition and In-Vitro Dry Matter Digestibility of Corn Kernel Using Near Infrared Reflectance Spectroscopy
Sung Won Choi1, Chang Sug Lee1*, Chang Hee Park1, Dong Hee Kim1, Sung Kwon Park2, Beob Gyun Kim3 and Sang Ho Moon4
1Korea Spectral Products, Seoul 152-779, Korea, 2National Institute of Animal Science, RDA, Suwon 441-706, Korea,
3Department of Animal Science and Technology, Konkuk University, Seoul 143-701, Korea,
4Division of Food Bio Science, Konkuk University, Chungju 380-701, Korea
ABSTRACT
Nutritive value analysis of feed is very important for the growth of livestock, and ensures the efficiency of feeds as well as economic status. However, general laboratory analyses require considerable time and high cost. Near-infrared reflectance spectroscopy (NIRS) is a spectroscopic technique used to analyze the nutritive values of seeds. It is very effective and less costly than the conventional method. The sample used in this study was a corn kernel and the partial least square regression method was used for evaluating nutrient composition, digestibility, and energy value based on the calibration equation. The evaluation methods employed were the coefficient of determination (R2) and the root mean squared error of prediction (RMSEP). The results showed the moisture content (R2val=0.97, RMSEP=0.109), crude protein content (R2val=0.94, RMSEP=0.212), neutral detergent fiber content (R2val=0.96, RMSEP=0.763), acid detergent fiber content (R2val=0.96, RMSEP=0.142), gross energy (R2val=0.82, RMSEP=
23.249), in vitro dry matter digestibility (R2val=0.68, RMSEP=1.69), and metabolizable energy (approximately R2val >0.80). This study confirmed that the nutritive components of corn kernels can be predicted using near-infrared reflectance spectroscopy.
(Key words : Nutrient Composition, Digestibility, Corn kernel, NIRS, PLSR)
Ⅰ. INTRODUCTION
For the past ten years, feed production has been increased around the world. The main reason of this production increase may be attributable to the increase of corn share in the feeds. Every year South Korea imports more than six million tons of corn as feed for livestock. Most of the farmers are suffered because of the import price is twofold higher than the domestic corn price. Another burden on the farmer is the fact that the price of feed has not gone down very much despite the price of corn going down. To reduce the burden on the farmers, local governments have attempted to find solutions, such as constructing the culture area for growing the feed crops and developing efficient grains. One of the methods that could reduce the burden on the farmers is the supply of proper feed through the effective analysis of nutrients. However, the conventional analysis method is troublesome, as it requires several stages of pre-treatments
and the results of the analysis are dependent on the skill of the analyzers. In addition, the amount of cost and time required for the analysis is immense.
The development of an analysis method using near-infrared spectroscopy (NIRS) started in the early 1970s. Researchers have been analyzed the crude protein (CP), neutral detergent fiber (NDF), lignin, and In Vitro Organic Matter Digestibility (IVOMD) (Norris et al., 1976; Starr et al., 1981; Ruano- Ramos et al., 1999; Deaville and Flinn, 2000) in the feed using reflectance NIRS. They were able to predict the dry-matter digestibility (DMD), dry-matter intake (DI), organic matter digestibility (OMD), and digestible energy intake (DEI) of several grasses and legume forages. In the United States of America (USA), 80% of the forage crops produced in the state of Wisconsin and 70% of all feeds across the USA were analyzed using this method. In Korea, Lee et al.
(2009) conducted a test to estimate the components of a forage crop using NIRS. The fact that the R2 of the ADF
and NDF was 0.94 shows that this method was successful for estimating the components of the forage crop. Then, Park et al. (2006) reported that they prepared a verification formula for the CP, NDF, and ADF of corn silage and that they were effective. Park et al. (2004) also conducted research on the value of the raw feed materials using NIRS.
The aim of this study was to assess the possibility of predicting the nutrients, digestibility, and energy value of corn kernel analysis using NIRS by comparing them with the results from the wet analysis method.
Ⅱ. MATERIALS AND METHODS 1. Samples
For this study, 62 samples (yellow corn kernel) were collected from the USA and white corn kernel from South Africa. Assistance was provided by Department of Animal Science and Technology, Konkuk University for the preparation of the samples and the analysis of components.
2. Spectroscopic Analysis
The samples were grind using the sample mill to reduce the effect of the size of the particles on the results, and the samples were then physically pre-treated with a stainless sieve (1 mm). The pre-treated samples (10 g) were put in the sample cup Then, they were measured three times in the range of 900~2100 nm using NIRS (Korea Spectral Products, DAF-M, Korea), which was composed of the silicon and indium gallium arsenide array detector (InGaAs with the thermoelectric cooling), and averaged before they were converted to the spacing of 1nm using the interpolation to get the absorbance (log 1/R: absorbance) spectrum.
The materials for optical windows applied to the sample cup was Coring 7980 fused silica, and the reflector was coated with gold, as this has good reflectance.
3. Chemical Analysis
Chemical analysis is needed to determine the linear correlation with the reflectance spectrum measured with the
NIRS. It is used for reference analysis of the results when the analysis method is applied using partial least square regression(PLSR).
(1) Nutrient Composition
The water in the sample was dried under a temperature of 135℃ for two hours, and the analysis was made based on the change of mass before and after the drying (AOAC, 2005; method 930.15). The NDF and ADF were analyzed using Goering and van Soest (1970). The crude fiber was analyzed using method 978.10 (AOAC, 2005). The Crude Protein was analyzed using Kjeldahl (AOAC, 2005)
(2) Digestibility
The in Vitro Dry Matter Digestibility (IVDMD) analysis was initiated by Tilley and Terry (1963) and amended by Moore (Harris, 1970). It was applied in many fields. In this study, the analysis was done according to the method of Boisen and Fernández (1997).
(3) Energy Value
The value was obtained using a bomb calorimeter (Parr 1261 bomb calorimeter) for the gross energy (GE), while the following formula was used for the metabolizable energy (ME).
Metabolizable Energy(ME)
=
4. Calibration
(1) Partial Least Square Regression
PLSR is used to extract information on the chemical composition from the spectrum data acquired form NIRS.
This is a method to derive a calibration equation on the relation between the independent variable (X) acquired from NIRS and the measured dependent variables (Y) of the chemical information (Martens and Naes, 1990).
The PLSR method reduces the independent variables of the database to the principal component without the loss of information. Though it is similar to the principal component analysis, it also considers the dependent variables at the same time in order to solve the problem of multicollinearity caused by the reduction of the explanation due to the high
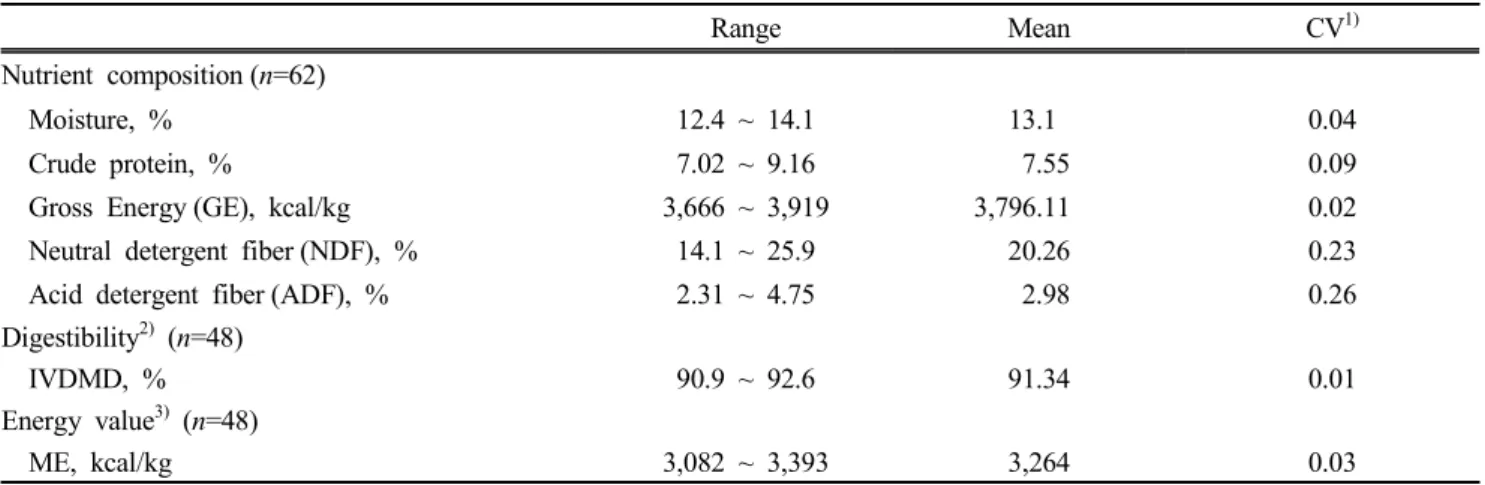
Table 1. Statistical distribution of nutrient compositions and digestibility of samples in complete data sets
Range Mean CV1)
Nutrient composition (n=62)
Moisture, % 12.4 ~ 14.1 13.1 0.04
Crude protein, % 7.02 ~ 9.16 7.55 0.09
Gross Energy (GE), kcal/kg 3,666 ~ 3,919 3,796.11 0.02
Neutral detergent fiber (NDF), % 14.1 ~ 25.9 20.26 0.23
Acid detergent fiber (ADF), % 2.31 ~ 4.75 2.98 0.26
Digestibility2) (n=48)
IVDMD, % 90.9 ~ 92.6 91.34 0.01
Energy value3) (n=48)
ME, kcal/kg 3,082 ~ 3,393 3,264 0.03
1)CV: Coefficient of Variation, 2)IVDMD: in vitro dry matter digestibility, 3)ME: metabolizable energy.
correlation between variables. The optimal calibration equation is prepared by comparing it with the residuals from the increase in the factor number.
In this study, the R statistical software version 3.1.0 (R Development Core Team 2014, Package ‘PLS’) was used for the preparation of calibration equation.
(2) Model Performance Evaluation
The accuracy of the developed calibration equation indicates that the predicted value explains the actual value.
This is verified using the unknown samples, which are not used for preparing the model. It is expressed as the coefficient of determination (R2), root mean square error of calibration (RMSEC), root mean square error of prediction (RMSEP), and standard error of the estimate (SEE). It is assumed that if the R2 is closer to 1 and the error is closer to 0, the accuracy of the calibration model is high.
Ⅲ. RESULT AND DISCUSSION 1. Statistical properties of data set
The range and basic statistics of the nutrient composition, digestibility, and energy value are shown in Table 1. The data includes the information on the reference analysis, while the composed data are classified into the calibration set for the preparation of the calibration equation and the validation set for verification.
The calibration set affects the accuracy of the prediction
depending on its composition. So, the proper size for the data sets are critical and that the features of the chemical components and the spectrum for the measuring target should be included. In addition, De Groot (1999) argued that the development of a new calibration equation and the recalibration of the system required re-sampling and that organizing the data sets, including the unnecessary sample selection, would save a lot of labor and cost. The distribution of the nutrient composition for the corn kernel sample shows 0.02~0.26 for the coefficient of variation (CV), and the largest variations were in the NDF and ADF. On the other hand, IVDMD and GE showed small values of 0.01 and 0.02, respectively.
2. Calibration and Validation
The spectra transformation methods were used with the data from the corn kernel sample using the reflectance spectrum and the wet analysis results for each component to prepare the calibration equation using PLSR. The prepared calibration equation used the number of factors, adopting the prediction error reported by Varmuza and Filzmoser (2009), to check the reduction and increase in the prediction error and to minimize the problem of overfitting.
(1) Nutrient composition
The preparation of the calibration equation and the results for the verification of the nutrients in the corn kernel are shown in Table 2 and Fig. 1. The prediction results for the
Table 2. The prediction of nutrient composition of corn kernel, as fed basis (Total n=62)
Composition Spectra
Transformation
Calibration (n=35) Validation (n=27)
R2cal1) RMSEC3) R2val2) RMSEP4)
Moisture, % C 0.96 0.101 0.97 0.109
Crude protein, % B 0.97 0.131 0.94 0.212
Neutral detergent fiber (NDF), % A 0.97 0.868 0.96 0.763
Acid detergent fiber (ADF), % C 0.98 0.125 0.96 0.142
GE, kcal/kg C 0.98 9.967 0.82 23.249
1)R2cal: coefficient of determination for calibration, 2)R2val: coefficient of determination for validation, 3)RMSEC: root mean square error of calibration, 4)RMSEP: root mean square error of prediction, A: Multiplicative Scatter Correction (MSC), B: Standard normal variate (SNV), C: SNV+De-trending.
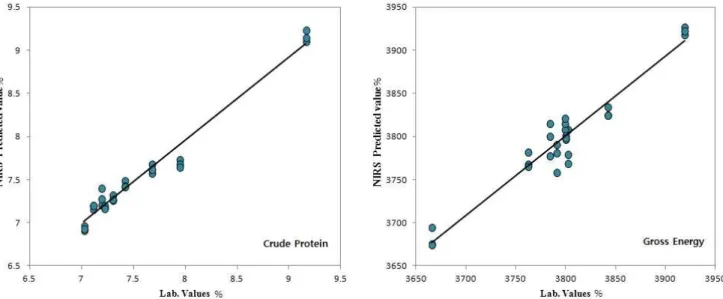
Fig. 1. Relationship between lab values and NIR-predicted crude protein (left figure) and gross energy (right figure) value of corn kernel.
moisture in the corn kernel using NIRS showed that the R2val=0.97 and the RMSEP=0.109, while Armstrong (2006) showed good results, with R2=0.97 and SECV=0.76, when he used NIRS. The prediction results for the crude protein showed R2val=0.94 and RMSEP=0.212. The results for NDF showed R2val=0.96 and RMSEP=0.763, while the results for ADF showed R2val=0.96 and RMSEP=0.142. The corn silage results using NIRS that were disclosed by Valdes et al.
(1985) showed R2=0.91 and SEE=0.43 in CP and R2=0.61 and SEE=1.78 in ADF, while Jones et al. (1987) showed R2=0.94 and RMSEP=0.17 in CP and R2=0.73 and RMSEP=0.93 in ADF. The GE prediction showed R2val= 0.82 and RMSEP=23.249, which were less than those predicted by Zhou et al. (2012), who used NIRS for the distiller’s dried grains of corn (R2=0.95, SEP=0.22). Chin
(1998) reported that because the preparation of accurate calibration formula requires the sample size needed for each predictor, there will be various samples and accurate analysis results from laboratory tests.
(2) Digestibility and Energy Value
The results for the digestibility and energy value of the corn kernel from the calibration equation are shown in Table 3 and Fig. 2. The results from the calibration equation on the IVDMD of the corn kernel using the NIRS were R2cal=0.77 and RMSEC=0.469, while the calibration results were R2val=0.68 and RMSEP=1.69. Martin et al. (1980) evaluated the IVDMD in terms of the value of the feed, as it has a high correlation with the IVDMD, while Smith et al. (1997) reported the effect of IVDMD on the valuation
Table 3. Calibration and validation statistics for NIRS analysis of digestibility and energy value in corn kernel (Total n=48)
Spectra Transformation
Calibration (n=31) Validation (n=17)
R2cal1)
RMSEC3) R2val2)
RMSEP4) Digestibility (%. DM)
IVDMD, % B 0.77 0.469 0.68 1.69
Energy value As-fed basis
ME, kcal/kg B 0.93 28.88 0.86 34.54
DM basis
ME, kcal/kg C 0.89 42.17 0.78 53.22
1)R2cal: coefficient of determination for calibration, 2)R2val: coefficient of determination for validation, 3)RMSEC: root mean square error of calibration, 4)RMSEP: root mean square error of prediction, A: Multiplicative Scatter Correction (MSC), B: Standard normal variate (SNV), C: SNV+De-trending.
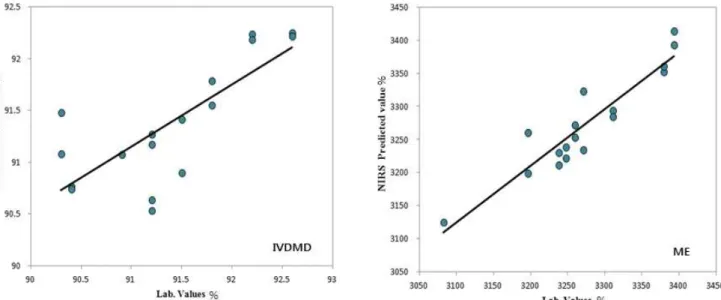
Fig. 2. Relationship between lab values and NIRS predicted IVDMD (left figure) and ME (right figure) value of corn kernel.
of roughage. Valdes et al. (1987) and Snyman et al. (1993) showed that the R2, or the prediction result of the digestibility of the feed for livestock using NIRS and MLR, was more than 0.90, while Park et al. (2006) reported the prediction results for corn silage IVDMD using NIRS and PLSR with R2=0.70 and SECV=1.57.
The result for the ME of the corn kernel using the NIRS was found to be R2cal=0.93 and RMSEC=28.88, and the condition of AS-fed basis while the result of calibration was found to be R2val=0.86 and RMSEP=34.54. Under the DM basis, the results for the calibration equation were found to be R2cal=0.89 and RMSEC=42.17, while the results for verification were found to be R2val=0.78 and RMSEP=
53.22. Zhou et al. (2012) showed accurate ME prediction results for the distiller’s dried grains of corn at R2=0.93 and Standard error of cross-validation (SECV)=0.34, which were more accurate than the results in this study. These results indicate that NIRS can allow prediction of Nutrient compositions and Digestibility of corn kernel. Further work will be necessary to acquire more sample and to improve predicted results using calibration method.
Ⅳ. ACKNOWLEDGEMENT
This work was carried out with the support of the
“Cooperative Research Program for Agriculture Science and
Technology Development (Project No. PJ907038),” Rural Development Administration, Republic of Korea.
Ⅴ. REFERENCES
AOAC. 2005. Official methods of analysis (16th ed.), Association of Official Analytical Chemist, Arlington, VA. Washington D. C., USA.
Armstrong, P.R. 2006. Rapid Single-Kernel NIR Measurement of Grain and Oil-Seed Attributes. Applied Engineering in Agriculture. 22(5):767-772.
Boisen, S. and Fernández, J.A. 1997. Prediction of the total tract digestibility of energy in feed stuffs and pig diets by in vitro analyses. Animal Feed Science and Technology. 68:277-286.
Chin, W.W. 1998. The Partial Least Squares Approach to Structural Equation Modeling. Modern Methods for Business Research. NJ:
Lawrence Erlbaum Associates. Mahwah. pp. 295-336.
De Groot, P.J., Postma, G.J., Melssen, W.J. and Buydens, L.M.C.
1999. Selecting a representative training set for the classification of demolition waste using remote NIR sensing. Analytical chimica acta. 392:67-75.
Deaville, E.R. and Flinn, P.C. 2000. Near infrared spectroscopy: an alternative approach for the estimation of forage quality and voluntary intake. Forage evaluation in ruminant nutrition. CAB International. UK. pp. 301-320.
Goering, H.K. and Van Soest, P.J. 1970. Forage fiber analysis.
Agriculture Handbook. No. 379. ARS-USDA. Washington, D. C.
Harris, L.E. 1970. In vitro dry matter and organic matter digestion (Moor modification of Tilly and Terry Technique). Nutrition Research Techniques for Domestic and Wild Animals. 1:
5051-5053.
Jones, G.M., Wade, N.S., Baker, J.P. and Ranck, E.M. 1987. Use of near infrared reflectance spectroscopy in forage testing. Journal of Dairy Science. 70:1086-1091.
Lee, H.W., Kim, J.D., Kim, W.H. and Lee, J.K. 2009. Prediction on the quality of forage crop by near infrared reflectance spectroscopy. Journal of The Korean Society of Grassland Science. 29(1):31-36.
Martens, H. and Naes, T. 1990. Multivariate calibration. Journal of Chemometrics. 4(6):441.
Martin, G.E., Bacino, C.B. and Papp, N.L. 1980. Hypothermiaelicited by the intracerebral microinjection of neurotensin. Peptides. 1:
333-339
Norris, K.H., Barnes, R.E.F., Moore, J.E. and Shenk, J.S. 1976.
Predicting forages quality by infrared reflectance spectroscopy.
Journal of Animal Science. 43:889-897.
Park, H.S., Lee, J.K. and Lee, H.W. 2004. Applications of Near Infrared Reflectance Spectroscopy (NIRS) in Forage Evaluation.
Journal of The Korean Society of Grassland Science. 24(1):
81-90.
Park, H.S., Lee, J.K., Lee, H.W., Hwang, K.J., Jung, H.Y. and Ko, M.S. 2006. Effect of sample preparations on prediction of chemical composition for corn silage by near infrared reflectance spectroscopy. Journal of The Korean Society of Grassland Science. 26(1):53-62.
Ruano-Ramos, A., Garcia-Ciudad, A. and Garcia-Criado, B. 1999.
Determination of nitrogen and ash content in total herbage and botanical components of grassland systems with near infrared spectroscopy. Journal of the Science of Food and Agriculture.
79:137-143.
Smith, K.F., REED, K.F.M. and FOOT, J.Z. 1997. An assessment of the relative importance of specific traits for the genetic improvement of nutritive value in dairy pasture. Grass and Forage Science. 52:167-175.
Snyman, M.A., Olivier, J.J., Cloete, J.A.N. and King, B.R. 1993.
Produksienorme vir Afrinoskape in twee omgewings. Karoo Agric. 5(1):25-28.
Starr, C.A., Morgan, A.G., and Smith, D.B., 1981. An evaluation of near infrared reflectance analysis in some plant breeding programs. Journal of Agricultural Science. 97:107-115.
Tilly, J.M.A. and Terry, R.A. 1963. A two-stage technique for in vitro digestion of forage crops. Journal of British Grassland Society. 18:401-411
Valdes, E.V., Young, L.G., McMillan, I. and Winch, J.E. 1985.
Analysis of hay, haylage and corn silage samples by near infrared reflectance spectroscopy. Journal of Animal Science.
65(3):753-760.
Valdes, E.V., Hunter, R.B. and Pinter, L. 1987. Determination of quality parameters by near infrared reflectance spectroscopy in whole-plant corn silage. Canadian Journal of Plant Science, 67:747-754.
Varmuza, K. and Filzmoser, P. 2009. Introduction to Mutivariate Statistical Analysis in Chemometrics. Taylor & Francis Group.
USA. pp. 103-190.
Zhou, L.J., Zhang, L.Y., Zhang, En.X., Li, J.T., Yang, W.J. and Wang, Z.Y. 2012. Rapid determination of swine available energy and amino acids in corn distillers dried grains with solubled by near-infrared reflectance spectroscopy. Animal Feed Science and Technology. 175:198-202.
(Received August 11, 2014 / Revised September 16, 2014 / Accepted September 19, 2014)