603
©The Korean Society of Food Science and Technology
근적외선 분광분석법을 이용한 향미벼의 아밀로스 및 단백질 정량분석
김정순·송미희
1·최재을
1·이희봉
1·안상낙
1*
농촌진흥청 국립농업과학원 농업유전자원센터, 1충남대학교 농학과
Quantification of Protein and Amylose Contents by Near Infrared Reflectance Spectroscopy in Aroma Rice
Jeong-Soon Kim, Mi-Hee Song
1, Jae-Eul Choi
1, Hee-Bong Lee
1, and Sang-Nag Ahn
1* National Agrobiodiversity Center, National Academy of Agricultural Science, RDA
1
Department of Agronomy, Chungnam National University
Abstract
The principal objective of current study was to evaluate the potential of near infrared reflectance spectroscopy (NIRS) as a non-destructive method for the prediction of the amylose and protein contents of un-hulled and brown rice in broad-based calibration models. The average amylose and protein content of 75 rice accessions were 20.3% and 7.1%, respectively. Additionally, the range of amylose and protein content were 16.6-24.5% and 3.8-9.3%, respectively. In total, 79 rice germplasms representing a wide range of chemical characteristics, variable physical properties, and origins were scanned via NIRS for calibration and validation equations. The un-hulled and brown rice samples evidenced distinctly different patterns in a wavelength range from 1,440 nm to 2,400 nm in the original NIR spectra. The optimal performance calibration model could be obtained by MPLS (modified partial least squares) using the first derivative method (1:4:4:1) for un-hulled rice and the second derivative method (2:4:4:1) for brown rice. The correlation coefficients (r
2) and standard error of calibration (SEC) of protein and amylose contents for the un-hulled rice were 0.86, 2.48, and 0.84, 1.13, respectively. The r
2and SEC of protein and amylose content for brown rice were 0.95, 1.09 and 0.94, 0.42, respectively.
The results of this study suggest that the NIRS technique could be utilized as a routine procedure for the quantification of protein and amylose contents in large accessions of un-hulled rice germplasms.
Keywords:
NIR spectrum, aroma rice, amylose, germplasm evaluation, MPLS
서 론
쌀은현미상태에서도영양성분이주식에가깝게단백질
,
지질,
탄수화물이고루 분포되어있으며
,
기능성성분도 다량함유되어 있으며(1),
단백질 함량(2,3)
및아밀로스(4,5)
는쌀의미질을결정하는중요한이화학적특성으로보고되었다
(6).
Infrared reflectance spectroscopy(NIRS;
근적외선 분광분석법)
에의한분석방법은시료를비파괴적으로신속하게정성및정 량적인분석이 가능하기 때문에다량의 시료를짧은 시간내에 분석할 수 있어
,
선진국에서는 쌀의 식미 평가를NIRS
분석용 프로그램을 이용한 자동화시스템의 개발(7,8)
등 다양한 방법에 의한가능성을시도하고있다(9-11).
최근국내에서도
NIRS
를이용한여러가지예측모델(12-17)
이개발하고있으며
,
특히 쌀의단백질(18)
및아밀로스(19,20)
함량및 백미(21),
현미의 성분(18,22),
현미의 함수율(16),
미강의 성분,
벼 생체 엽(23),
강낭콩 종실의 특성(24)
등다양한 상태의 농작물에대한품질평가방법으로
NIRS
를이용한연구결과들이보고되었다.
본연구는 농촌진흥청 농업유전자원센터에 보존되고 있는 다 양한 향미 유전자원의 성분분석을 위한 신속
,
정확한 평가 및 선발체계를구축하고자근적외선분광분석법을이용하여현미 및 벼상태의향미자원으로부터획득한spectrum
의비교분석을 통해 비파괴적으로아밀로스및단백질함량을분석하고자실시하였다.
재료 및 방법
실험재료
본실험에사용한벼유전자원은
Table 1
과같이2006
년농촌 진흥청국립농업유전자원센터로부터활력이80%
이상인향미자 원65
점과다면적재래자원14
점을 분양받아2007
년증식한 재 료를사용하였다.
전체자원중
75
자원에대한이화학적특성분석을통한검량식 작성을위해,
향미10g
씩을실험실용현미제현기(SY88-TH, Sangy- ong Machine Ind. Co. Ltd., Incheon, Korea)
로탈영시켜서 사미,
피해 립등을 제거한후
,
현미상태로NIR
스펙트럼을 작성 후,
동일한 샘플을이화학적 분석에이용하였다
.
이화학적특성 분석 용샘플은 현미를분쇄기로90
초간분쇄하여100 mesh
의채로 친현미가루를 이용하여,
아밀로스함량 및단백질함량을 농촌진 흥청쌀품질및식미평가서에 의거하여조사하였다.
아밀로스함량 분석
아밀로스함량 분석은
Juliano(26)
의비색 정량 법에 따라100
*Corresponding author: Sang-Nag Ahn, Department of Agronomy, Chungnam National University, Daejeon 305-764, Korea
Tel: 82-42-821-5728 Fax: 82-42-822-2631 E-mail: [email protected]
Received July 9, 2008; revised October 29, 2008;
accepted October 29, 2008
mg
의현미가루에95% ethanol 1 mL
와1 N NaOH 9 mL
가해진 탕항온수조에10
분간 호화시킨 후20
oC
증류수로100 mL
을채운다음
,
그 중5 mL
를 취해1 N acetic acid 1 mL
와2% I
2-KI (iodine solution) 2 mL
를가해 증류수로100 mL
까지 채우고30
oC
에서
20
분간발색반응시켜620 nm
의파장에서UV/Vis
분광광도 계(UV-2450, Shimadzu, Tokyo, Japan)
로측정하였다.
단백질함량 분석
단백질함량은
Micro Kjeldahl
질소정량 법(4)
을이용하여다음 과같이정량하였다.
현미시료500 mg
을500 mL Kjeldahl
분해병에 넣고 진한 황산
(H
2SO
4) 20 mL
을 가한 후 분해촉매제(Kjeltabs) 1 g
을넣고400
oC
에서2
시간동안분해하였다.
실온에 서냉각후가스를방출시키고 증류수를300 mL
가하면서분해 병의내벽을 세척하고45% NaOH 50 mL
을가하여 용액을알칼리화하여
Kjeldahl
증류장치로75 mL
까지증류한후, 2%
붕 산용액(H
3BO
4) 10 mL
을가하여0.1 N H
2SO
4표준용액으로 자동 분석 장치(Kjeltec 2400, Foss, Silver Spring, MD, USA)
를 이용 하여질소함량(N)
을분석후,
질소보정계수를N
×5.95(%)
로하여단백질함량으로환산하였다
.
근적외선 스펙트럼 수집
분양받은향미와 다면적재래자원의 현미및벼 상태에대한
NIR
을이용한근적외선스펙트럼을측정하기위해,
근적외선분 광분석기(NIRsystems 6500, Foss)
를사용하였으며,
시료를half cup seed holder
에채운후실온에서 가시광선및근적외선대역(400- 2500 nm)
에서scanning
한후스팩트럼은 한품종당3
반복으로 얻은원시spectrum
을standard normal variance
와detrend
로입도 차이에서오는산란을보정하였다.
NIRS 검량식 작성
NIRS
을이용한 정량분석을위해우선 원시spectrum
을파일로 작성한후검량식을 얻어야한다.
검량식은 원시spectrum
을4
가지수처리
(math treatment)
방법을통하여spectrum
을영역별로중첩에서 생기는
noise
와bias
를최소화하였다.
원시spectrum
을 가공하여 데이터분석및 아밀로스와 단백질에대한 검량식을 작성하고이를79
자원의현미에적용하여시료의가상적인아밀 로스와단백질함량을얻었다.
수처리
(math treatment)
는우선1
차미분(1st derivative)
을이용 한1, 4, 4, 1(1st derivative, 4 nm gap, 4 point smooth, and 1 point second smooth))
조건, 1, 10, 10, 1
조건과2
차미분을이용한
2, 4, 4, 1
조건및2, 10, 10, 1
조건을사용하였다.
수처리 된spectrum
은회귀분석을통해검량식을작성하였다.
회귀분석은
PLS(partial least squares), MPLS(modified partial least squares), PCR(principal component regression)
법을 사용하여 검량 식을산출하였으며,
작성된검량식을상호비교분석하여 최 적의검량식을도출하였다.
실험치
(lab data)
와NIR
데이터의 통계적인 모집단 분포의 해 석과 그 상관관계에 관한 통계분석은WINISI II software(Ver 1.50, Foss)
를 사용하여RSQ(R
2; squared coefficient of multiple determination in calibration), SEC(standard error of calibration),
그리고
SEP(standard error of prediction)
값을분석하였는데, SEC, SEP, Bias
식은다음과같다.
SEC= ,
SEP=
Bias=
여기에서
xi:
각각의화학성분값, yi:
각각의NIR
측정값, n:
시료 수
, p:
보정계수에 이용한filter
의수, :
화학분석에의한 평균값, :
근적외선분석에의한평균값(22).
결과 및 고찰
단백질 및 아밀로스함량 분석
75
점의 향미및다면적재래유전자원의현미로부터측정한단 백질및아밀로스함량 범위를Table 2
에서살펴보면단백질함량 의범위는3.8-9.3%
였으며,
평균 단백질함량은7.1%
이고단백질함량이
6.6-7.5%
인자원은26
점으로전체의32.9%
를차지하였다.
전체자원의아밀로스함량의범위는
8.5-27.4%
였으며,
평균아밀 로스함량은20.3%
이고아밀로스함량이12.5%
이하인 저아밀로 스 자원은7
점이었으며,
아밀로스함량이16.6-24.5%
인고아밀로스자원은
58
자원으로전체의73.4%
를차지하였다.
75
점의향미및 다면적재래유전자원의 시료에 대한단백질 및아밀로스함량에대한분석결과Table 2
에서보는바와같이X
i– y
i( )2
∑ n p – – 1 ---
x
i– y
i( )
–
(x y –
)2i 1= n
∑
n 1 – --- 1 n--- x
ii 1= n
∑ 1 n--- y
i x y= –i 1= n
– ∑
y x
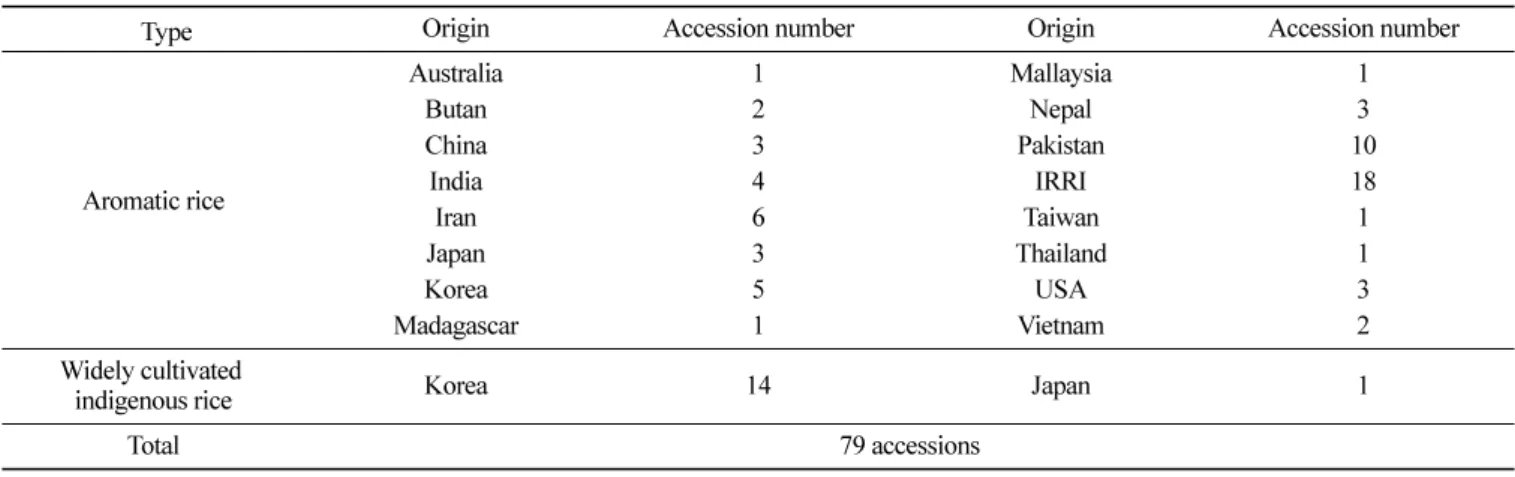
Table 1. List of origin and accession number of domestic and foreign aroma rices and widely cultivated indigenous rice varieties.
Type Origin Accession number Origin Accession number
Aromatic rice
Australia 1 Mallaysia 1
Butan 2 Nepal 3
China 3 Pakistan 10
India 4 IRRI 18
Iran 6 Taiwan 1
Japan 3 Thailand 1
Korea 5 USA 3
Madagascar 1 Vietnam 2
Widely cultivated
indigenous rice Korea 14 Japan 1
Total 79 accessions
비교적 정규분포에 가까운 양상을 나타내고 있으므로 근적외선 분광분석기를이용한현미의아밀로스함량및단백질함량에대 한검량식 작성에사용될 샘플집단으로 무리가없을 것으로판 단된다
.
이와 유사한결과를쌀의 분석결과에서보고한 바있다(19,21).
근적외선
spectrum
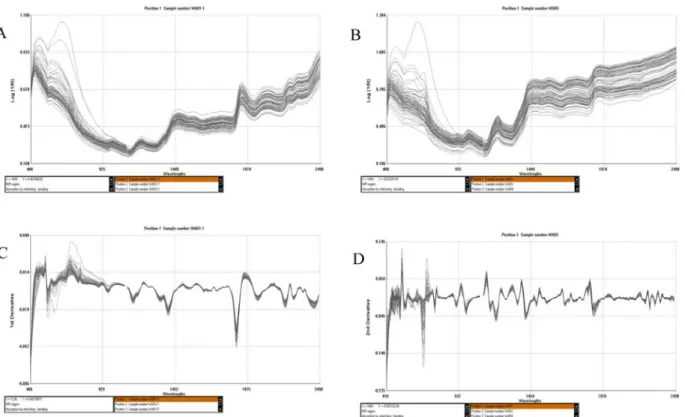
수집Fig. 1(A, B)
는75
점의향미 및다면적재래유전자원에 대한 벼상태및현미상태에서의NIR
원시spectrum
을나타낸 것으로1,490 nm
이상의파장범위에서 벼상태및현미상태에서 큰차 이를보였으며,
전체spectrum
의양상은Kim
등(19)
과Kwon
등(22)
이보고한현미상태의NIR
원시spectrum
의양상과비슷하였다.
가시광선범위는
chlorophyll
과같이주로색도와연관된영역 으로 다양한spectrum
양상을 나타내기때문인데,
본실험에 사 용한재료의 영색과현미색이다양하므로, Fig. 1
에서벼상태 및 현미상태에서 얻은가시광선범위의spectrum
이분산되는 현상을나타내었다
. Song
등(21)
에의하면도정된 브랜드쌀의경우 현 미색이 제거되어 백미 상태이므로 가시광선 범위에서는 흡광도Table 2. Protein and amylose contents of the brown rice by Kjedhal method and Juliano method Biotype Verities Amylose
(%) Protein
(%) Biotype Verities Amylose
(%) Protein (%) Domestic
aroma rice
Tongil Hyangmibyeo1ho 18.2±0.22 7.4±0.10 Basmati 1 26.0±0.02 7.6±0.03
Hyangmibyeo2ho 18.5±0.09 7.8±0.04 Basmati 213 C 23.2±0.02 6.4±0.06 Japonica Hyangnambyeo 17.4±0.14 5.8±0.06 Basmati 372 26.2±0.03 8.6±0.12 Aranghyangchalbyeo 08.5±0.16 6.5±0.05 Chahora 144 26.5±0.02 9.0±0.03
Mihayangbyeo 18.5±0.09 6.9±0.05 Dinorado 27.2±0.04 8.4±0.04
Foreigne aroma
rice Indica
Hyanggaengdo 22.6±0.19 7.6±0.05 Domsiah 23.4±0.04 8.4±0.06
Hyangdo 23.4±0.15 8.7±0.06 Mulai 25.8±0.04 7.2±0.10
Iranbyeopssi 20.3±0.14 9.3±0.09
Japonica
Muhyang99-8 18.5±0.15 5.8±0.05
Iranbyeopssi 20.7±0.15 9.2±0.11 Jahyangna861 08.9±0.17 6.4±0.06
Iranbyeopssi 21.5±0.17 9.3±0.15 Daebunhyangdo2 18.4±0.13 6.0±0.05
Basmati 370 21.4±0.14 7.7±0.06 415 X Ir352 09.3±0.19 7.1±0.06
Jasmine 85 18.2±0.15 4.6±0.15 Shiyayuuine 16.7±0.14 7.8±0.04
Dellmont 19.7±0.11 7.0±0.08 A-2 08.5±0.14 7.9±0.08
Aroma 21.5±0.14 4.6±0.04 A-3, Choh hang 09.0±0.18 7.1±0.06
Ds20 18.9±0.13 7.0±0.04 Daw Dam 09.2±0.11 6.8±0.04
05-Irri-M-46 27.4±0.10 8.1±0.05 KINANDANG PAT 24.7±0.02 4.5±0.03
Goolarath 18.1±0.13 7.4±0.11 Kung-ShanWu-Shen-Ken 22.0±0.03 8.3±0.06
Ir841-85-1-1-2 17.9±0.04 6.7±0.08 Iari 7447 08.8±0.03 8.1±0.04
Seratus Malam 24.6±0.07 7.4±0.08 Masino Basmati 26.3±0.09 7.8±0.12
TALLI 24.8±0.04 7.5±0.04 Inaguhu 24.2±0.02 7.7±0.06
05-Irri-M-46 26.1±0.07 7.1±0.04 Flores 21.5±0.02 6.3±0.07
Basmati 107 21.1±0.08 8.8±0.04 Rasomotrafotsy 23.4±0.00 6.9±0.04
Basmati 405 22.5±0.11 8.4±0.05
Widely cultivated indigenous
rice Japonica
Pungwoog 17.0±0.09 6.0±0.13
Basmati 5853 22.5±0.09 6.6±0.07 Palgoeng 17.6±0.09 5.4±0.14
Basmati 5874 22.8±0.08 7.6±0.07 Noinjo 21.0±0.04 6.2±0.15
Basmati 6129 22.8±0.05 7.4±0.05 Dadajo 19.4±0.02 5.9±0.06
Basmati 6311 22.0±0.08 7.2±0.18 Donnado 19.3±0.03 5.4±0.06
Basmati 6313 22.6±0.08 6.6±0.05 Nagdongbyeo 16.6±0.04 6.2±0.09
Basmati 6141 21.0±0.03 8.0±0.14 Paldal 17.3±0.03 6.5±0.04
Gerdeh 16.4±0.03 8.7±0.04 Tongil 21.8±0.03 7.4±0.10
AZUCENA 23.3±0.02 7.2±0.05 Koshihikari 17.7±0.03 4.1±0.04
Binicol 24.5±0.02 7.6±0.13 Dongjinbyeo 20.7±0.03 5.5±0.06
Milfor 6 24.6±0.02 7.9±0.04 Ilpumbyeo 18.8±0.03 3.8±0.05
Basmati 5836 24.3±0.00 6.8±0.03 Nampyeongbyeo 19.4±0.02 6.1±0.05
Basmati 5854 23.6±0.03 8.0±0.04 Sindongjinbyeo 18.8±0.03 5.5±0.04
Basmati 5875 21.6±0.03 8.8±0.04 Dongjin 1 ho 19.0±0.03 6.0±0.04
Basmati 6113 24.4±0.00 8.4±0.04 Joonambyeo 20.3±0.00 4.4±0.46
Basmati 6129 25.7±0.02 7.4±0.03
의차이가 적다고보고하였다
.
Fig. 1
의A
와B
는 벼 상태 및 현미상태로부터 획득한 원시spectrum
으로가시광선범위와는 달리700 nm
에서2,500 nm
사이 의근적외선 범위에서는 특정파장대별로 큰흡광도 차이를나타내었고
, Fig. 1.
의C
와D
는전처리된스펙트럼의 피크는아래 로돌출될수록 강한흡광도(27)
를의미하는데C
와D
특정파장중
, 1,440 nm
를정점으로 근적외선범위 쪽으로 갈수록흡광도의 중첩 현상이나타났다. 1,900 nm
와1,420 nm
부근에서강한 흡광Fig. 1. The original spectra (un-hulled rice, A; brown rice, B) and derivative of the mean spectra (un-hulled rice, C; brown rice, D) of the NIR spectrums of 75 accessions of aroma rices by reflection method. The un-hulled and brown rice samples had shown an different patterns from 1,440 nm to 2,400 nm wavelength range in original NIR spectra.
Fig. 2. Three dimensional display of 3 major principal component analysis of the protein content (un-hulled rice, A; brown rice, B) and
the amylose content (un-hulled rice, C; brown rice, D) axis on 75 accessions of aroma rices and widely cultivated indigenous rice in RDA
Genebank.
도를나타내었고이는근적외선범위가일반화학성분의변위보 다도입도 및물성의변위에 기인하는기준선의 변동이 심하고 흡광도가 커질수록 다중산란현상에의해 흡광도가 증가하기 때 문인것으로 벼
(20,21)
및강낭콩 종실(24)
의NIR
분석결과가 보 고되어 있다.
또한Kim
과Kim(28)
의 보고에 의하면starch
와cellulose
의spectrum
은유사하며, cellulose
의peak
는1,450 nm
부근과
2,100 nm
부근에서 나타난다고 하였다.
특히Song
등(21)
등의보고에의하면
1,460 nm
부근은O-H 2
차배음대, 1,570 nm
부근은단백질과 관련된
N-H
영역그리고1,780 nm
부근은C-H
기를 갖는 영역에서 차이를 나타낸다고 하였다
.
본실험에서도유사한
spectrum
의 양상을 관찰할 수 있었다.
이러한 결과들은Abrams
등(28)
과Clarke
등(29)
이보고한O-H, C-H, N-H, C=O
등의관능기는 다양한화학결합을 나타내며 이를응용함으로서 근적외선분광법을이용한수분
,
단백질,
전분,
지방등의복수의성분을동시에신속하게측정할수있다고하였다
.
Fig. 2
는1
차미분한spectrum
을 대상으로WINISI II software
(Ver 1.50)
의Score center-select
기능을이용하여 주성분분석(prin- cipal component analysis)
을수행한 후center sample
로부터의 각시료간 거리
(mehalanobis distance)
를구해중복되는샘플들을 순 차적으로 제거하여75
자원의모집단을 분석한결과Fig. 2
과같 은3
차원 도식을 얻을 수 있었다.
벼 상태로부터 얻은spec- trum(Fig. 2, A
와C)
은비교적넓은범위에고루분포하였으나 현미상태로부터 얻은
spectrum(Fig. 2, B
와D)
은비교적 좁은범위 에고루분포하였다.
단백질함량에대한spectrum
보다아밀로스 함량의spectrum
이공간적으로 고르게분포하였지만모두 정규분 포의 양상을보였으며,
이는자연계에서 흔하게나타나는대표적인시료군의형태로서실험치분포
(Table 1)
과비교할때거의일 치함을알수있었다.
NIR spectrum
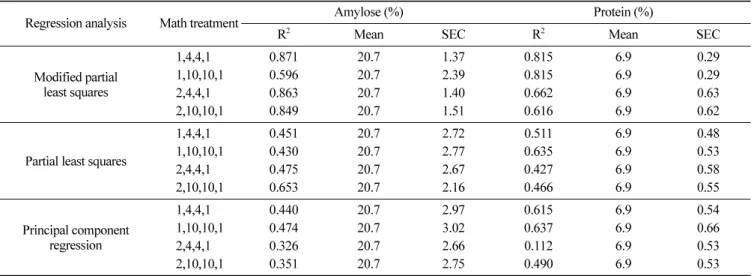
분석을 위한 검량식 작성Table 3
과Table 4
는벼와현미상태로부터획득한NIRS spec- trum
으로부터protein
과amylose
함량을예측하기위한최적의 검Table 3. Optimum calibration parameters according to three different regression analysis and four mathematical treatments for protein and amylose content in un-hulled rice
1)Regression analysis Math treatment Amylose (%) Protein (%)
R
2Mean SEC R
2Mean SEC
Modified partial least squares
1,4,4,1 0.871 20.7 1.37 0.815 6.9 0.29
1,10,10,1 0.596 20.7 2.39 0.815 6.9 0.29
2,4,4,1 0.863 20.7 1.40 0.662 6.9 0.63
2,10,10,1 0.849 20.7 1.51 0.616 6.9 0.62
Partial least squares
1,4,4,1 0.451 20.7 2.72 0.511 6.9 0.48
1,10,10,1 0.430 20.7 2.77 0.635 6.9 0.53
2,4,4,1 0.475 20.7 2.67 0.427 6.9 0.58
2,10,10,1 0.653 20.7 2.16 0.466 6.9 0.55
Principal component regression
1,4,4,1 0.440 20.7 2.97 0.615 6.9 0.54
1,10,10,1 0.474 20.7 3.02 0.637 6.9 0.66
2,4,4,1 0.326 20.7 2.66 0.112 6.9 0.53
2,10,10,1 0.351 20.7 2.75 0.490 6.9 0.53
1)
R
2: coefficient of determination in calibration. SEC: standard error calibration.
Math treatment a, b, c, d: a, derivative function; b, gap; c, smooth; d, second smooth.
Table 4. Optimum calibration parameters according to three different regression analysis and four mathematical treatments for protein and amylose content in brown rice
1)Regression analysis Math treatment Amylose (%) Protein (%)
R
2Mean SEC R
2Mean SEC
Modified partial least squares
1,4,4,1 0.860 20.9 1.40 0.856 7.1 0.35
1,10,10,1 0.779 20.9 1.80 0.849 7.1 0.36
2,4,4,1 0.943 20.9 0.90 0.859 7.1 0.37
2,10,10,1 0.570 20.9 0.45 0.854 7.1 0.35
Partial least squares
1,4,4,1 0.774 20.9 1.79 0.681 7.1 0.56
1,10,10,1 0.779 21.0 1.77 0.455 7.1 0.69
2,4,4,1 0.844 20.9 1.49 0.135 7.1 0.87
2,10,10,1 0.618 20.9 2.32 0.441 7.1 0.74
Principal component regression
1,4,4,1 0.359 20.9 3.00 0.310 7.1 0.77
1,10,10,1 0.359 20.9 3.00 0.398 7.1 0.73
2,4,4,1 0.400 20.9 3.09 0.062 7.1 0.90
2,10,10,1 0.360 20.9 2.99 0.293 7.1 0.83
1)
R
2: coefficient of determination in calibration. SEC: standard error calibration.
Math treatment a, b, c, d: a, derivative function; b, gap; c, smooth; d, second smooth.
량식작성을 위한회귀분석
(regression analysis)
과수 처리(math treatment)
방법에 따른 상관계수(R
2)
값과SEC(standard error cali- bration)
값의차이를비교하였다.
Table 3
에서벼상태로부터얻은NIRS spectrum
을분석하였을경우
,
다중선형회귀분석법(MPLS)
에의한미분방식중에서1,4,4,1
수처리방법에의한
1
차미분식을적용시protein
은R
2값이0.871
이며
SEC
값이1.37
이었고, amylose
는R
2값이0.815
이며SEC
값 이0.29
로가장유의한값을나타내었다.
또한
Table 4
에서현미상태로부터얻은NIRS spectrum
을분석 하였을 경우,
다중선형회귀분석법에 의한2,4,4,1
수처리방법에 의한2
차 미분을 적용 시protein
의R
2값이0.943
이며, SEC
값은0.90
이었고, amylose
의R
2값은0.859
이며, SEC
값은0.37
로높은유의성을나타내었다
.
최근에는 이러한
NIR
분석의 수처리 방법에 대한많은 연구 가이루어져 다중선형회귀 법(multiple linear regression),
주성분분석법
(principal component regression),
부분최소제곱법(partial least square)
등의통계방법들이개발되어 물질의정성뿐만아니 라정량분석에도 널리이용되고있다(30-32).
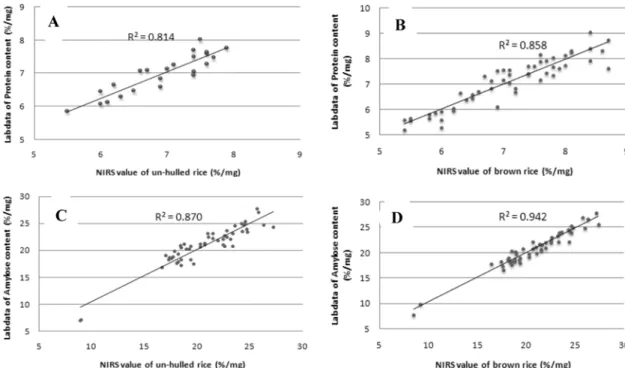
Fig. 3
은화학적분석에의한단백질과 아밀로스의 함량을조사한
lab data
와벼상태및현미상태의NIRS
검량식에서얻은calibration data
와의상관관계를나타낸것으로,
단백질의경우Fig.
3
의A(un-hulled rice), B(brown rice)
에서와 같이벼나현미상태에상관없이한쪽에 치우치지않고고르게분포되어있었다
.
벼 상태의 경우R
2가0.814
이었고현미상태의 경우R
2가0.858
로높 은유의성을나타내었다.
아밀로스의경우도Fig. 3
의C(un-hulled rice), D(brown rice)
에서와 같이저아밀로스자원과 고아밀로스자원이구분되지만벼나현미상태에상관없이한쪽에치우치지 않고 고르게분포되어있으며
,
벼상태의경우R
2가0.870
이었고 현미상태의 경우R
2가0.942
로높은유의성을나타내었다.
Table 5
은 향미자원으로부터 얻은 단백질과 아밀로스 함량의실측 데이터
(experimental data)
와NIR
분석에 의한 예측 데이터(prediction data)
에 대한 차이를 나타내었다.
습식분석 데이터와 예측data
의평균 단백질함량의차이는 벼상태의경우0.06
이 었고 현미상태의 경우0.12
정도로 근소한 차이를 보였고평균아밀로스함량 차이도벼상태의경우
0.33
이었고현미상태의 경 우0.37
로근소한차이를보였다.
그러나습식분석데이터와NIRS
분석에의한예측데이터의최소값과최대값의변이폭을비교하 였을 경우
,
현미로부터 얻은 단백질의 습식분석 데이터는4.4- 9.3%
의 나타내었으나, NIRS
분석에 의한 벼 상태에서는3.3- 10.8%,
현미상태에서는4.0-10.4%
로습식분석 데이터에비해 넓 은변이폭을 나타내었다.
아밀로스의 경우도습식분석데이터는8.5-27.4%
의나타내었으나,
벼상태에서는7.4-33.9%,
현미상태에서는
6.9-33.4%
로습식분석 데이터에비해넓은변이폭을나타 내었다.
Fig. 3. Correlations between near-infrared reflectance spectroscopy predicted data and experimental data of protein content (un-hulled rice, A; brown rice B) and amylose content (un-hulled rice, C; brown rice D).
Table 5. Calibration and validation results for the protein and the amylose content of un-hulled and brown rice (unit: %/mg) Constituent N Min Experimental data Max Mean Min Prediction data Max Mean RSQ
Protein Un-hulled 74 4.4 9.3 7.1 3.25 10.82 7.04 0.84
Brown 75 4.4 9.3 7.1 4.02 10.42 7.22 0.94
Amylose Un-hulled 70 8.5 27.4 20.3 7.36 33.90 20.63 0.86
Brown 75 8.5 27.4 20.3 6.95 34.38 20.67 0.95
1)
N, number of samples in calibration; RSQ (R
2), coefficient of determination in calibration ; Min, Minimum value; Max, Maximum value.
NIR
의분석방법은 시료의추출,
여과,
희석등의일련의과정없이측정된 시료를비파괴적으로 회수가 가능한장점이 있지 만
,
습식분석데이터의정확성에 의존하여분석하는2
차적인분 석방법이기 때문에 정확도가 무엇보다 중요하다(33-35).
따라서 본실험에서는탈영하지않은벼상태로부터 얻은NIR spectrum
과습식분석에 이용한현미로부터 얻은
NIR spectrum
을비교분 석하여시료의상태에따른예측데이터의변화를비교분석한것 으로근적외선스펙트럼을 이용한 벼 유전자원의 화학적 특성을 평가하는데 보다 효율적으로 이용될 수 있을 것으로 판단되며,
품질평가시스템을 구성하기쉽고
,
분석시숙련된기술을요하 지않으며,
결과의해석이용이할뿐만아니라저비용으로 평가 시스템을구성할수있는장점을가지고있는것같다.
요 약
본연구는향미및다면적재래벼유전자원에대하여근적외 선분광분석법을 이용하여
,
현미및벼상태의향미자원으로부터spectrum
을획득후,
아밀로스함량과단백질함량분석을하고자실 시하였다. 75
점의 향미및 다면적 재래 유전자원의 현미로부터 측정한단백질함량의범위는3.8-9.3%
였으며,
평균단백질함량은7.1%
이고 아밀로스함량의범위는8.5-27.4%
였으며,
평균 아밀로스함량은
20.3%
이었다. 79
점의향미및다면적재래유전자원에 대한 벼 상태 및현미상태에서의NIR
원시spectrum
을 나타낸 것으로1,490 nm
이상의파장범위에서큰차이를보였다. NIR
원시
spectrum
을MPLS
방법에의해서벼상태로부터얻은spectrum
은
1,4,4,1
수처리방법,
현미상태로부터얻은spectrum
은2,4,4,1
수 처리 방법의 결과가 유의성이 높았다
.
벼 상태에 대한MPLS(1,4,4,1)
방법에 의한R
2 및SEC
값은protein
은R
2 값이0.871, SEC
값이1.37
이었고, amylose
는R
2값이0.815, SEC
값이0.29
이었으며,
현미상태의 경우MPLS(2,4,4,1)
방법에 의한R
2 및SEC
값은protein
은R
2값이0.943, SEC
값이0.90
이며amylose
는R
2값이0.859, SEC
값이0.37
로높은유의성을나타내었다.
습식분석데이터와
NIR
예측data
에대한차이를살펴보았더니,
평균 단백질함량의 차이는벼상태는0.06,
현미상태는0.12
였고,
평 균아밀로스함량차이도벼상태는0.33
이었고현미상태는0.37
로근소한 차이를보였다
.
감사의 글
본연구는농촌진흥청 산학연과정의도움을받아수행하였다