Transcriptome Analysis of the Effects of Gomisin A on the Recovery of Carbon Tetrachloride-Induced Damage in Rat Liver
9
0
0
전체 글
(2) Young Mi Choi et al.. 162. superoxide dismutase conjugate, tetramethyl pyrazine, imatinib mesylate, perindopril, and ginkgo biloba downregulated the TGF pathway [9-14]. These therapy molecules protect the rat liver from fibrogenesis induced by CCl4, and the possible mechanism could involve the down-regulation of TGF-β. As the human genome project has been completed, attention is currently focused on understanding the gene expression profiles of disease states in cells and tissues, as well as the development of platform technology or methodology for detecting and quantitating gene expression levels. Northern blots, Southern blots, PCR, S1 nuclease protection, differential display, cDNA library sequencing, and serial analysis of gene expression (SAGE) methods have limited ability to analyze a large amount of data quantitatively. The DNA microarray system is one of the most powerful technologies for analyzing gene expression in many fields of biological research analyzing the expression profiles of thousands of genes in a wide range of biological systems [15-19]. This technology enables scientists to do a highsensitivity parallel screening of a large number of genes with a small amount of starting material. Recently, the introduction of fluorescent probes has made it possible to array tens of thousands of short oligo-nucleotides representing the full transcriptome of a species on a miniaturized slide-glass array [20]. In the present work, we investigated the transcriptome profile related to the hepatoprotective effects of gomisin A on CCL4induced rat liver damage. Using microarray technology, we screened for genes differentially expressed after treatment of gomisin A on rat livers that were damaged by CCl4. DNA microarray-based gene profiling identified 255 up-regulated genes and 230 down-regulated genes, and their specific metabolic pathways were described.. Materials and Methods Extraction and elucidation of gomisin A The fruits of S. chinensis used in this study were collected from Moongyeong, Korea in September, 2005. A voucher specimen (accession No. SC-PNUNPRL-1) was deposited in the Herbarium of Pusan National University. Pure gomisin A was identified by high performance liquid chromatography on a Phenomenex Luna C18 column (150×4.6 mm internal diameter, 5-µm particle size; Phenomenex, Torrance, CA, USA) [21]. The chemical structure of gomisin A used in this study was verified by liquid chromatography-mass spectrometry (LC-MS; Bruker BioApex FT Mass Spectrometer, Billerica, MA, USA) and nuclear magnetic resonance (NMR) analysis (Varian Lab Anim Res | June, 2011 | Vol. 27, No. 2. Inova 500 Spectrometer, Vernon Hills, IL, USA). Optical rotations were recorded on a Jasco DIP-370 Digital polarimeter, Essex, UK). IR spectra were recorded on an ATI Mattson Genesis Series FTIR, Golden Valley, MN, USA). NMR spectra (1H, 13C) were recorded in CDCl3 on a Varian Inova 500 Spectrometer operating at 500 MHz for 1H and 125 MHz for 13C, running gradients and using residual solvent peaks as internal references. High-resolution mass spectra were recorded on a Bruker BioApex FT Mass Spectrometer.. Maintenance of rats All subjects were female Sprague-Dawley (SD) rats, purchased from Samtaco Biokorea (Osan, Korea). These rats were kept in Pusan National University/Laboratory Animal Resources Center in accordance with the US National Institute of Health (NIH) Animal Care policies. The rats were given a standard irradiated chow diet (Purina Mills, St. Louis, MO, USA) ad libitum and were maintained in a specified pathogenfree state under a strict light cycle (light on at 06:00 and off at 18:00). Furthermore, the animal protocol used in this study has been reviewed and approved by the Pusan National University Institutional Animal Care and Use Committee (PNUIACUC). Experimental design for gomisin A treatment Eight-week-old SD rats were randomly divided into four groups with five rats per group. The first group of SD rats was not treated by any compounds as an untreated control group (UT group), while the second group received 100 mg/ kg body weight per day of gomisin A via oral administration for 4 days (gomisin A-treated group, GT group). The third group received a comparable volume of olive oil via oral gavage daily, while the fourth group received 100 mg/kg body weight per day of gomisin A via oral administration for 4 days. At the fifth day, all animals in the first and second groups were immediately euthanized using CO2 gas and the liver samples collected. Meanwhile, the third (CCl4-treated group, CT group) and fourth groups (gomisin A and CCl4treated group, GCT group) received 0.1 mL of CCl4 (SigmaAldrich, St. Louis, MO, USA) solution via intraperitoneal injection. After 24 hours post-CCl4 injection, these animals were immediately euthanized using CO2 gas. Liver samples were collected and stored in Eppendorf tubes at −70oC until assayed. Histological analysis Liver tissues collected from rats were fixed with 10% formalin for 12 hours, embedded in paraffin wax, and then sectioned into 5 µm-thick slices. The liver sections were stained with.
(3) Transcriptome analysis of the effects of gomisin A. 163. hematoxylin and eosin (H&E, Sigma-Aldrich) and morphological features were observed under light microscopy (Leica Mycrosystems, Heerbrugg, Switzerland).. RNA preparation and microarray procedure Total liver RNA was isolated from rat liver tissue using Trizol reagent (Invitrogen, Grand Island, NY, USA) according to the manufacturer’s instructions. The total RNA was dissolved in diethyl pyrocarbonate-treated distilled water, and stored at −70oC. DNA microarray analyses were performed according to the manufacturer’s standard protocol. Briefly, Cy5-dUTPlabeled cRNA were prepared from 200 µg of total RNA isolated from a liver of each group. Complementary RNA was labeled using a fluorescent cRNA labeling kit (Agilent, Delaware, DE, USA) according to the manufacturer’s instructions. Then, 10X blocking agent and ×25 fragmentation buffer were added to the labeled cRNAs by following the instructions from the hybridization kit (Agilent). For hybridization, total cRNAs were applied to a microarray (Rat 44K 4-Plex Gene Expression platform; Agilent) followed by incubation at 65oC overnight under humidified conditions. To control the labeling differences, technical replication was conducted in which duplicated reactions were carried out by switching over the fluorescent dyes. Microarray analysis was performed on using total cRNA hybridization images captured by a microarray scanner system (G2545CA; Agilent) using feature extraction (FE) 9.5.3 software at the scanning resolution of 5 mm. Analysis of microarray data Analysis of feature extraction text files produced by the Agilent scanner and further data evaluations were performed by using the Genespring GX7.3.1 software package (Agilent Technologies, Santa Clara, CA, USA). Relative expression levels of genes were calculated after normalization of the signal intensity values and outputted with the unigene and genebank descriptors to a Microsoft Excel data spreadsheet. Gene ontology (GO) analysis based on biological process and molecular function ontology analysis was performed using the web tool Database for Annotation, Visualization, and Integrated Discovery (DAVID). Kyoto Encyclopedia of Genes and Genomes (KEGG) biochemical pathways analysis was also performed by the web tool KEGG (http://www.genome.jp/ kegg/pathway.html).. Results and Discussion Histological analysis of the rat liver To investigate the protective effects of gomisin A on CCl4-. Figure 1. Histology of liver tissue. A, vehicle; B, gomisin A alone; C, carbon tetrachloride (CCl4) alone; D, CCl4+gomisin A. The hepatocytic morphology on the liver section stained with hematoxylin and eosin was observed with light microscope at ×400. Arrows indicate the necrotic hepatocytes.. induced hepatocellular damage, we examined the histopathology of livers from all four groups. In the GCT group rat liver, histological alteration of liver tissue was observed. In both the UT group (Figure 1A) and GT group (Figure 1B), the histopathology showed a normal distribution of hepatocytes with clear visible nuclei, portal triads, and central veins. After CCl4 treatment, extensive centrolobular necrosis was observed in and around the central vein of liver (Figure 1C). However, necrosis was significantly decreased in the liver section of the group pretreated with gomisin A for 4 days (Figure 1D). These results suggest that pretreatment with gomisin A may protect against hepatocellular damage induced by CCl4 treatment.. RNA preparation and microarray analysis Preparation of total RNA with high purity is essential for a successful microarray experiment. The quality of RNA was measured by Agilent 2100 Bioanalyzer (Agilent). The Agilent 2100 Bioanalyzer provides a platform for the electrophoresis of nucleic acids on a disposable chip [22,23]. Each RNA sample (1 mL) was loaded into individual wells on a chip and electrophoresed in the Bioanalyzer. 18s and 28s ribosomal peaks were present in all samples by giving RNA Integrity Numbers (RINs) from 8.0 to 10.0, which indicated the verification of a good quality of RNA samples for microarray analysis. Liver RNA samples from three individual rats were pooled for each experimental group. Each RNA sample was hybridized with 41,012 probes on Rat 44K 4-Plex Gene Expression platform. Systematic errors across all variables in an experiment Lab Anim Res | June, 2011 | Vol. 27, No. 2.
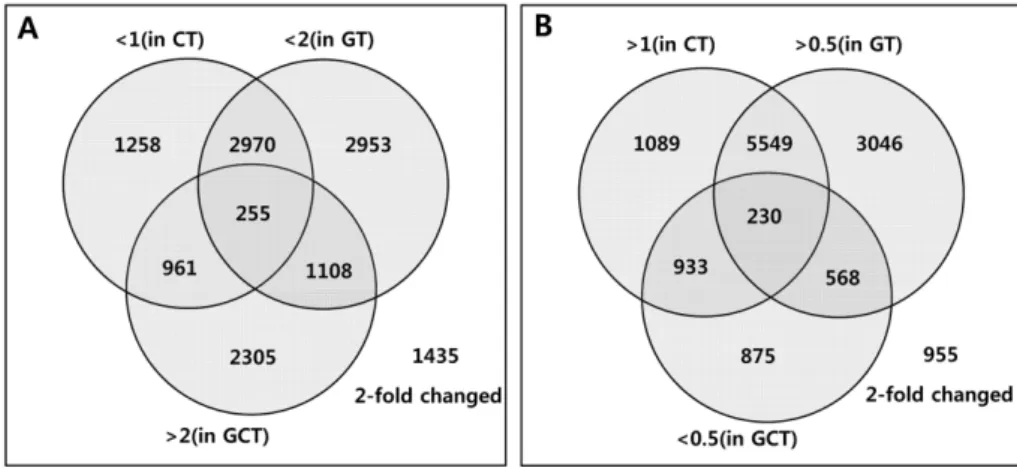
(4) 164. Young Mi Choi et al.. Figure 2. Dendrograms showing strategies for identifying specifically regulated genes in the process of gomisin A-induced recovery of rat liver tissues; 255 up-regulated (A) and 230 down-regulated (B) genes were identified. In A, <1 (in CT) and <2 (in GT) indicate the number of genes that did not showed significant up-regulation in CT and GT groups, respectively, and >2 (in GCT) indicates the number of genes that showed significant up-regulation in GCT group. In B, >1 (in CT) and >0.5 (in GT) indicate the number of genes that did not showed significant down-regulation in CT and GT treated groups, respectively, and >0.5 (in GCT) indicates the number of genes that showed significant down-regulation in GCT group.. can be attributed to well-known sources including biases linked to the different dyes used at the labeling step. Possible systemic bias in the data was removed by signal dependent LOWESS normalization of the MA-plot [24]. This normalized data were tested for significant gene expression fold changes between control and samples by a t-test.. Distribution of regulated genes We identified a number of differentially expressed genes in the GCT group. In total, the expression of 2,305 genes was up-regulated more than two-fold (>2), while the expression of 875 genes was down-regulated more than twofold (<0.5). To narrow down the number of genes that are possibly involved in gomisin A-induced recovery from CCl4induced injury, a selection strategy (Figure 2) was employed, and finally, 255 up-regulated and 230 down-regulated genes were selected. The up-regulated 255 genes were the genes that showed increased expression level (>2) after the treatments in the GCT group, but showd a decreased expression level in both the GT group (<2) and CT group (<1). The down-regulated 230 genes were the genes for which expression level were decreased (<0.5) in GCT group but were not significantly decreased in either the GT group (>0.5) or the CT group (>1) compared to the UT group (Figure 2). Hierarchical cluster analysis of 488 selected genes resulted in Clusters I and II, which comprise 255 and 230 genes that were up- or down-regulated, respectively, by the treatment of gomisin A on the rat liver damaged by CCl4. A closer relation was observed between the GT group and GCT group, indicating that many genes influenced by gomisin A treatment Lab Anim Res | June, 2011 | Vol. 27, No. 2. Figure 3. Hierarchical clustering of 488 genes selected as shown in Figure 1. Y-axis shows the list of genes and X-axis shows control and samples. Red fields show un-regulation of genes (absolute difference) and green fields show downregulation of genes. U, UT group; C, CT group; G, GT group; GC, GCT group..
(5) Transcriptome analysis of the effects of gomisin A. 165. Table 1. The list of genes identified by the analysis shown in Figure 2. Only the 26 genes that were high ranked in the fold change and/or assigned in the pathway based on KEGG are shown (Figure 4). The genes involved in the cell cycle pathway or TGF-β signaling pathway were indicated by C, or T, respectively Genbank. Description. Up-regulated genes histone deacetylase 2 XM_342149 C XM_222932 exonuclease 1 (predicted) NM_001024741 chromatin assembly factor 1, subunit B (p60) XM_218601 E2F transcription factor 8 NM_177931 C origin recognition complex, subunit 1-like (S. cerevisiae) minichromosome maintenance deficient 5, cell division cycle 46 (S. cerevisiae) C XM_226316 (predicted) similar to cell division cycle 45 homolog (S. cerevisiae)-like XM_213587 C cyclin D1 NM_171992 C NM_133571 C cell division cycle 25 homolog A (S. pombe) XM_216161 C MAD2 (mitotic arrest deficient, homolog)-like 1 (S. cerevisiae) (predicted) XM_230765 C E2F transcription factor 1 minichromosome maintenance deficient 6 (MIS5 homolog, S. pombe) XM_344135 C (S. cerevisiae) minichromosome maintenance deficient 2 mitotin (S. cerevisiae) (predicted) XM_232168 C Down regulated genes similar to small inducible cytokine B13 precursor (CXCL13) (B lymphocyte NM_001017496 chemoattractant) (CXC chemokine BLC) thrombospondin 4 XM_342172T AB002393 histidine ammonia lyase NM_001013228 T-complex associated-testis-expressed 1-like (Protein 91/23) NM_012533 carboxypeptidase B1 (tissue) NM_001012034 ADP-ribosyltransferase 3 XM_235330 collectin sub-family member 10 (C-type lectin) (predicted) XM_224757 similar to chondroitin beta1,4 N-acetylgalactosaminyltransferase (predicted) NM_001012187 kelch-like 7 (Drosophila) PREDICTED: Rattus norvegicus similar to MEGF11 protein (LOC363079), XM_343410 mRNA [XM_343410] XM_214778 T thrombospondin 2 XM_217409 T bone morphogenic protein receptor, type II (serine/threonine kinase) NM_019191 T MAD homolog 2 (Drosophila). on the normal liver may be associated with recovery from the liver damage induced by CCl4 (Figure 3). Among 488 up- or down-regulated genes, 26 genes that were high ranked in the fold change are listed in Table 1. A majority of up-regulated genes were related to cell cycle. These genes included histone deacetylase, which removes acetyl groups and leads to the compaction of chromatin and DNA silencing. Histone deacetylase has been shown to be recruited by the retinoblastoma protein (Rb) and related pocket proteins to the promoters of several cell cycle genes. Thus, the histone deacetylase gene has been implicated in controlling the transcription of core cell cycle regulators [25,26]. Upregulated genes involved chromatin assembly factor (CAF) as well. CAF is essential for normal cell cycle maintenance. CAF1 loss of function in mammalian cells leads to the activation of a DNA-damage signaling pathway that slows. Fold-change. t-test P-value. 38.720 10.110 7.69 7.12 6.95. 0.50 0.00 0.11 0.03 0.13. 6.81. 0.01. 6.15 2.76 2.18 2.19 3.59. 0.03 0.29 0.04 0.27 0.34. 4.62. 0.17. 2.53. 0.25. 0.05. 0.14. 0.17 0.20 0.22 0.23 0.23 0.24 0.25 0.26. 0.22 0.24 0.26 0.25 0.26 0.26 0.29 0.27. 0.26. 0.27. 0.41 0.44 0.46. 0.36 0.50 0.58. down the S-phase of cell division and arrests the cell cycle [27]. E2F is also involved in cell cycle maintenance [28]. Most of the down-regulated genes were related to focal adhesions and cell death. These genes included thrombospondin (TSP), which is a member of a group of extracellular matrix (ECM) proteins. When exposed to cells in its soluble form, thrombospondin has primarily anti-adhesive effects characterized by a reorganization of stress fibers and loss of focal adhesion plaques as ascertained by interference reflection microscopy [29-31]. Down-regulated genes also included ADP ribosyltransferase (ADPRT). ADPRT activity interferes with eukaryotic DNA synthesis and endocytosis and causes cytotoxicity and cell death of mammalian cells [32,33].. GO and KEGG biological pathway analysis Gene ontology and biological pathway analysis were Lab Anim Res | June, 2011 | Vol. 27, No. 2.
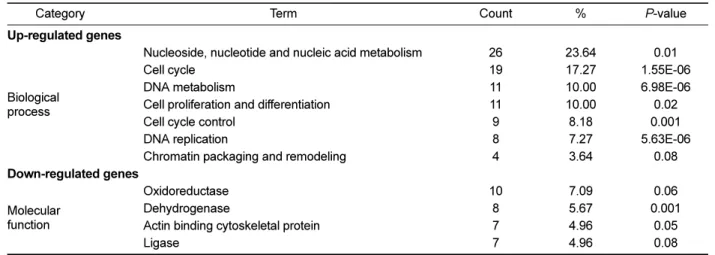
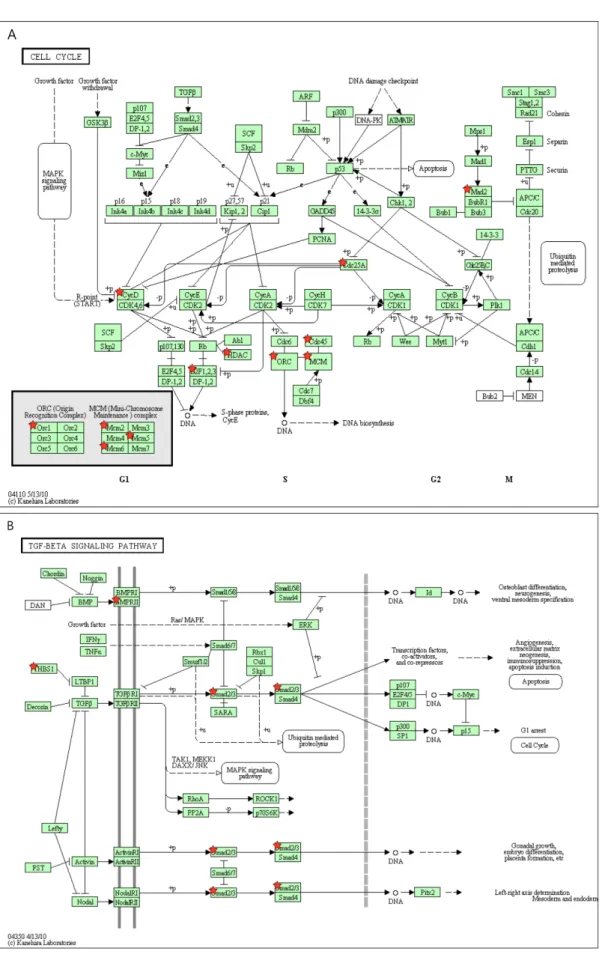
(6) Young Mi Choi et al.. 166. Table 2. Functional classification of 251 selected genes based on statistically significant represented GO terms Term. Count. %. P-value. Nucleoside, nucleotide and nucleic acid metabolism Cell cycle DNA metabolism Cell proliferation and differentiation Cell cycle control DNA replication Chromatin packaging and remodeling. 26 19 11 11 9 8 4. 23.64 17.27 10.00 10.00 8.18 7.27 3.64. 0.01 1.55E-06 6.98E-06 0.02 0.001 5.63E-06 0.08. Oxidoreductase Dehydrogenase Actin binding cytoskeletal protein Ligase. 10 8 7 7. 7.09 5.67 4.96 4.96. 0.06 0.001 0.05 0.08. Category Up-regulated genes. Biological process. Down-regulated genes Molecular function. Table 3. Pathway assignment of 251 selected genes based on KEGG Term Up-regulated genes Cell cycle DNA replication Pancreatic cancer Down-regulated genes Focal adhesion ECM-receptor interaction TGF-beta signaling pathway Valine, leucine, and isoleucine degradation Vascular smooth muscle contraction. performed with the genes selected as being specifically regulated in the process of gomisin A-induced recovery of rat liver tissues. Among 255 up-regulated and 230 downregulated genes, 110 and 141 genes with Entrez gene IDs were matched to genes in Rattus norvegicus, respectively. These genes were further analyzed for functional classification by GO term and pathway assignment by KEGG. The most statistically significantly represented GO terms are displayed in Table 2. “Nucleic acid metabolism and cell cycle” was identified as the most significantly related biological process to the up-regulated genes. For down-regulated genes, “oxidoreductase and dehydrogenase” were identified as the most significantly related molecular functions. Oxidoreductases belong to a family of genes that are involved in the regulation of programmed cell death. Oxidoreductase mediates cell death caused by the novel anti-cancer drug β-lapachone [34]. Also, dehydrogenase causes a programmed cell death in ERK kinase signaling events [35]. Biological pathway assignment based on KEGG was displayed in Table 3. “Cell cycle” (Figure 4A) was identified by up-regulated genes as the most statistically significant pathway, which was in accordance with the result of GO Lab Anim Res | June, 2011 | Vol. 27, No. 2. Count. %. P-value. 10 3 3. 9.09 2.72 2.72. 3.33E-07 0.0292932 0.0981716. 8 4 4 3 4. 5.67 2.83 2.83 2.12 2.83. 0.001 0.03 0.04 0.06 0.08. term analysis. While the majority of up-regulated genes were related to cell cycle in the distribution of regulated genes, focal adhesion, ECM-receptor interaction, and TGF-beta signaling pathway (Figure 4B) were identified as the most statistically significant in down-regulated genes. A single CCl4 administration can cause hepatic injury that is associated with ECM accumulation. During the remodeling process of the liver architecture from hepatic damage, including inflammation, fibrosis and regeneration, TGF-β1 plays a pivotal role in stimulating the liver [36]. Initiation of hepatic fibrosis starts with paracrine stimulation of injured hepatocytes and endothelial cells, as well as subtle changes in ECM composition [37]. They produce pro-fibrogenic cytokines such as TGFβ. TGF-β as a major fibrogenic cytokine is heavily involved in abnormal ECM accumulation by increasing the synthesis of ECM components [38]. ECM molecules bind to integrin cell surface receptors and activate downstream focal adhesion molecules involved in the regulation of anchorage-dependent cell growth, proliferation, survival, differentiation, morphology, migration, and death [39,40]. Especially, liver fibrosis is characterized by excessive deposition of ECM, which leads to a severe pathological disturbance in the liver. During liver.
(7) Transcriptome analysis of the effects of gomisin A. 167. Figure 4. Pathway assignment of the important genes based on KEGG. The genes of up-regulation in cell cycle pathway (A) and the genes of down-regulation in TGF-β signaling pathway (B) were determined by KEGG pathway. The genes found in our microarray analysis were labeled by star symbols. Lab Anim Res | June, 2011 | Vol. 27, No. 2.
(8) Young Mi Choi et al.. 168. fibrogenesis, an increase in TGF-beta activity has been reported [41]. TGF-beta is an important cytokine in regulating the production of ECM for liver fibrosis [42,43]. In conclusion, our histological observation showed that gomisin A treatment could repair the rat liver with CCL4induced damage. Further, our microarray experiment indicated that the liver repair mechanism induced by gomisin A was strongly associated with increased expression of genes related to cell cycle and suppression of the genes involved in cell death mediated by the TGF-β pathway.. Acknowledgment This work was supported for two years by a Pusan National University Research Grant.. References 1. Liu GT. Biochemical and pharmacologic effects of wuweizi [Schizandra chinensis (Turcz.) Baill.] and its chemical contents on animal livers. Sheng Li Ke Xue Jin Zhan 1988; 19(3): 197-203. 2. Suprunov NI, Vetlugina IV. Determination and study of lignan distribution in the fruits of Schisandra chinensis (Turcz.) Baill. Farmatsiia 1972; 21(3): 34-37. 3. Bao TT, Liu GT, Song ZY, Xu GF, Sun RH. A comparison of the pharmacologic actions of 7 constituents isolated from Fructus schizandrae. Chin Med J 1980; 93(1): 41-47. 4. Maeda S, Takeda S, Miyamoto Y, Aburada M, Harada M. Effects of gomisin A on liver functions in hepatotoxic chemicals-related rats. Jpn J Pharmacol 1985; 38(4): 347353. 5. Yamada S, Murawaki Y, Kawasaki H. Preventive effect of gomisin A, a lignan component of shizandra fruits, on acetaminophen-induced hepatotoxicity in rats. Biochem Pharmacol 1993; 46(6): 1081-1085. 6. Maeda S, Takeda S, Miyamoto Y, Aburada M, Harada M. Effects of Gomisin A on liver functions in hepatotoxic chemicals-treated rats. Jpn J Pharmacol 1985; 38(4): 347353. 7. Mizoguchi Y, Shin T, Kobayashi K, Morisawa S. Effect of gomisin A in an immunologically-induced acute hepatic failure model. Planta Med 1991; 57(1): 11-14 8. Kubo S, Ohkura Y, Mizoguchi Y, Matsui-Yuasa I, Otani S, Morisawa S, Kinoshita H, Takeda S, Aburada M, Hosoya E. Effect of Gomisin A (TJN-101) on liver regeneration. Planta Med 1992; 58(6): 489-492. 9. Yoshiji H, Kuriyama S, Noguchi R, Ikenaka Y, Yoshii J, Yanase K, Namisaki T, Kitade M, Yamazaki M, Asada K, Akahane T, Tsujimoto T, Uemura M, Fukui H. Amelioration of liver fibrogenesis by dual inhibition of PDGF and TGF-β with a combination of imatinib mesylate and ACE inhibitor in rats. Int J Mol Med 2006; 17(5): 899-904. 10. Liu SQ, Yu JP, Chen HL, Luo HS, Chen SM, Yu HG. Therapeutic effects and molecular mechanisms of Ginkgo biloba extract on liver fibrosis in rats. Am J Chin Med 2006; 34(1): 99-114. 11. Ding J, Yu J, Wang C, Hu W, Li D, Luo Y, Luo H, Yu H. Ginkgo biloba extract alleviates liver fibrosis induced by CCl4 in rats. Liver Int 2005; 25(6): 1224-1232. 12. Liu J, Tan H, Sun Y, Zhou S, Cao J, Wang F. The preventive effects of heparin-superoxide dismutase on carbon tetrachlorideLab Anim Res | June, 2011 | Vol. 27, No. 2. induced acute liver failure and hepatic fibrosis in mice. Mol Cell Biochem 2009; 327(1-2): 219-228. 13. Liang J, Zhang XL, Yang GY, Pang YS, Yuan HF, Liang JS, Huang RB. Observation of the promotion effect taurine on hepatic stellate cell’s apoptosis in rat hepatic fibrosis model. Sichuan Da Xue Xue Bao Yi Xue Ban 2005; 36(3): 365-367. 14. Lu B, Yu L, Li S, Si S, Zeng Y. Alleviation of CCl4-induced cirrhosis in rats by tetramethylpyrazine is associated with down regulation of leptin and TGF-β1 pathway. Drug Chem Toxicol 2010; 33(3): 310-315. 15. Shalon D, Smith SJ, Brown PO. A DNA microarray system for analyzing complex DNA samples using two-color fluorescent probe hybridization. Genome Res 1996; 6(7): 639-645. 16. Schena M, Shalon D, Heller R, Chai A, Brown PO, Davis RW. Parallel human genome analysis: Microarray-based expression monitoring of 1000 genes. Proc Natl Acad Sci USA 1996; 93(20): 10614-10619. 17. Khan J, Bittner ML, Saal LH, Teichmann U, Azorsa DO, Gooden GC, Pavan WJ, Trent JM, Meltzer PS. cDNA microarrays detect activation of a myogenic transcription program by the PAX3-FKHR fusion oncogene. Proc Natl Acad Sci USA 1999; 96(23): 13264-13269. 18. Duggan DJ, Bittner M, Chen Y, Meltzer P, Trent JM. Expression profiling using cDNA microarrays. Nat Genet 1999; 21(1): 10-14. 19. Brown PO, Botstein D. Exploring the new world of the genome with DNA microarrays. Nat Genet 1999; 21(1): 3337. 20. Jordan BR. Large-scale expression measurement by hybridization method: from high-density membranes to ‘DNA chips’. J Biochem 1998; 124(2): 251-258. 21. Avula B, Dentali S, Khan IA. Simultaneous identification and quantification by liquid chromatography of benzethonium chloride, methyl paraben and triclosan in commercial products labeled as grapefruit seed extract. Pharmazie 2007; 62(8): 593-596. 22. Panaro NJ, Yuen PK, Sakazume T, Fortina P, Kricka LJ, Wilding P. Evaluation of DNA fragment sizing and quantification by the agilent 2100 bioanalyzer. Clin Chem 2000; 46(11): 18511853. 23. Funes-Huacca M, Regitano LC, Mueller O, Carrilho E. Semiquantitative determination of Alicyclobacillus acidoterrestris in orange juice by reverse-transcriptase polymerase chain reaction and capillary electrophoresis-laser induced fluorescence using microchip technology. Electrophoresis 2004; 25(21-22): 3860-3864. 24. Yang HY, Dudoit S, Luu P, Lin DM, Peng V, Ngai J, Speed TP. Normalization for cDNA microarray data: a robust composite method addressing single and multiple slide systematic variation. Nucleic Acid Res 2002; 30(4): e15. 25. Goodsell DS. The molecular perspective: Histone deacetylase. Oncologist 2003; 8(4): 389-391. 26. Stadler JA, Shkumatava A, Norton WH, Rau MJ, Geisler R, Fischer S, Neumann CJ. Histone deacetylase 1 is required for cell cycle exit and differentiation in the Zebrafish retina. Dev Dyn 2005; 233(3): 883-889. 27. Haushalter KA, Kadonaga JT. Chromatin assembly by DNA translocating motors. Nat Rev Mol Cell Biol 2003; 4(8): 613620. 28. Stevens C, La Thangue NB. E2F and cell cycle control: a double-edged sword. Arch Biochem Biophys 2003; 412(2): 157-169. 29. Greenwood JA, Murphy-Ullrich JE. Signaling of de-adhesion in cellular regulation and motility. Microsc Res Tech 1998; 43(5): 420-432. 30. Murphy-Ullrich JE, Höök M. Thrombospondin modulates focal adhesions in endothelial cells. J Cell Biol 1989; 109(3): 1309-1319. 31. Murphy-Ullrich JE, Lane TF, Pallero MA, Sage EH. SPARC.
(9) Transcriptome analysis of the effects of gomisin A. mediates focal adhesion disassembly in endothelial cells through a follistatin-like region and the Ca2+-binding EFhand. J Cell Biochem 1995; 57(2): 341-350. 32. Barbieri AM, Sha Q, Bette-Bobillo P, Stahl PD, Vidal M. ADPribosylation of Rab5 by ExoS of Pseudomonas aeruginosa affects endocytosis. Infect Immun 2001; 69(9): 5329-5334. 33. Pederson KJ, Barbieri JT. Intracellular expression of the ADPribosyltransferase domain of Pseudomonas exoenzyme S is cytotoxic to eukaryotic cells. Mol Microbiol 1998; 30(4): 751-759. 34. Dong GZ, Youn H, Park MT, Oh ET, Park KH, Song CW, Choi EK, Park HJ. Heat shock increases expression of NAD(P)H:quinone oxidoreductase (NQO1), mediator of βlapachone cytotoxicity, by increasing NQO1 gene activity and via Hsp70-mediated stabilisation of NQO1 protein. Int J Hyperthermia 2009; 25(6): 477-487. 35. Fico A, Paglialunga F, Cigliano L, Abrescia P, Verde P, Martini G, Iaccarino I, Filosa S. Glucose-6-phosphate dehydrogenase plays a crucial role in protection from redox-stress-induced apoptosis. Cell Death Differ 2004; 11(8): 823-831. 36. Kim SJ, Park JH, Kim KH, Lee WR, Chang YC, Park KK, Lee KG, Han SM, Yeo JH, Pak SC. Bee venom inhibits hepatic fibrosis through suppression of pro-fibrogenic cytokine expression. Am J Chin Med 2010; 38(5): 921-935.. 169. 37. Gressner AM, Bachem MG. Molecular mechanisms of liver fibrogenesis--a homage to the role of activated fat-storing cells. Digestion 1995; 56(5): 335-346. 38. Tahashi Y, Matsuzaki K, Date M, Yoshida K, Furukawa F, Sugano Y, Matsushita M, Himeno Y, Inagaki Y, Inoue K. Differential regulation of TGF-β signal in hepatic stellate cells between acute and chronic rat liver injury. Hepatology 2002; 35: 49-61. 39. Howe A, Aplin AE, Alahari SK, Juliano RL. Integrin signaling and cell growth control. Curr Opin Cell Biol 1998; 10(2): 220-231. 40. Giancotti FG, Ruoslahti E. Integrin signaling. Science 1999; 285(5430): 1028-1032. 41. Bataller R, Gäbele E, Parsons CJ, Morris T, Yang L, Schoonhoven R, Brenner DA, Rippe RA. Systemic infusion of angiotensin II exacerbates liver fibrosis in bile duct-ligated rats. Hepatology 2005; 41(5): 1046-1055. 42. Friedman SL. Molecular regulation of hepatic fibrosis, an integrated cellular response to tissue injury. J Biol Chem 2000; 275(4): 2247-2250. 43. De Bleser PJ, Xu G, Rombouts K, Rogiers V, Geerts A. Glutathione levels discriminate between oxidative stress and transforming growth factor-β signaling in activated rat hepatic stellate cells. J Biol Chem 1999; 274(48): 33881-33887.. Lab Anim Res | June, 2011 | Vol. 27, No. 2.
(10)
수치
관련 문서
Relaxation effects of active tension by propofol on spontaneous activity(S.A) and oxytocin(OT) induced contractions of rat uterine myometrium..
The expression of reporter genes driven by the ZAT1 promoter was observed in the tissues undergoing maturation such as border cell of root cap, endodermis,
In this study, two experiments were conducted to understand the effects of additional charge on the detailed growth mechanism of Alq 3 and to determine the effect of
It considers the energy use of the different components that are involved in the distribution and viewing of video content: data centres and content delivery networks
After first field tests, we expect electric passenger drones or eVTOL aircraft (short for electric vertical take-off and landing) to start providing commercial mobility
1 John Owen, Justification by Faith Alone, in The Works of John Owen, ed. John Bolt, trans. Scott Clark, "Do This and Live: Christ's Active Obedience as the
Stimulation of cell surface-expressed ENO1 induced faster repopulation of FLS in the scratch test assay, and increased PDGF-induced transwell migration.. Cytoplasmic
To evaluate the Effect of mutant RANKL on mRNA expressions in related with osteoclastogenesis,we investigated the expression of several osteoclast- specific genes both
