Ankle is one of the most complex human joints and is vulnerable to injury (1, 2). Imaging numerous ligaments and tendons that run in various planes is sometimes challenging. To overcome this problems, three-dimensional (3D) acquisition magnetic resonance (MR) imaging techniques, that allows multi- planar reconstruction and reduces partial-volume
INTRODUCTION
�Received; March 15, 2013�Revised; April 17, 2013
�Accepted; May 3, 2013
This research was supported by Basic Science Research Program through the National Research Foundation of Korea (NRF) funded by the Ministry of Education, Science and Technology (2012R1A1A2007991).
Corresponding author : Sungjun Kim, M.D.
Department of Radiology, Gangnam Severance Hospital, Yonsei University College of Medicine, 211 Eonju-ro, Gangnam-gu, Seoul 135- 720, Korea.
Tel. 82-2-2019-3510, Fax. 82-2-3462-5472 E-mail : [email protected]
Quantitative Assessment and Ligament Traceability of Volume Isotropic Turbo Spin Echo Acquisition (VISTA) Ankle Magnetic Resonance Imaging: Fat Suppression versus without Fat Suppression
Kyung Eun Cho1, Choon-Sik Yoon1, Ho-Taek Song2, Young Han Lee2, Daekeon Lim2, Jin-Suck Suh2, Sungjun Kim1
1Department of Radiology, Gangnam Severance Hospital, Yonsei University, Seoul, Korea
2Department of Radiology, Severance Hospital, Yonsei University College of Medicine, Seoul, Korea
Purpose : To compare the image quality and ligament traceability in ankle images obtained using Volume Isotropic Turbo Spin Echo Acquisition (VISTA) MRI with and without fat suppression.
Materials and Methods: The signal-to-noise ratios (SNRs) in images from a phantom and from the ankle of a volunteer were compared. Ten ankles from 10 non-symptomatic volunteers were imaged for comparisons of contrast ratio (CR) and ligament traceability. All examinations were performed using VISTA sequences with and without fat suppression on a 3T MRI scanner. The SNRs were obtained from images with subjects and without subjects (noise-only). Contrast ratios from images of the 10 ankles were acquired between fluid and tendon (F-T), F-cartilage (C), F-ligament (L), fat (f)-T, f-C and f-L.
Two musculoskeletal radiologists independently scored the traceability of 7 ligaments, in sagittal, axial and coronal images respectively, based on a 4-point scale (1 as not traceable through 4 as clearly traceable). The Wilcoxon signed-rank test was used to compare the CR. Fisher’s exact test and Pearson’s chi-squared test were used to compare the ligament trace- ability.
Results: The SNRs did not differ significantly between the two sequences except in bone marrow. VISTA SPAIR showed the higher CR only in F-T (p = 0.04), whereas VISTA showed higher CR in f-T (p = 0.005), f-C (p = 0.005) and f-L (p = 0.005). The calcaneofibular ligament traceability with VISTA was superior to that obtained with VISTA SPAIR (p < 0.05) in all planes.
Conclusion: VISTA showed significant superiority to VISTA SPAIR in tracing CFL due to the superior CR between fat and ligament.
Index words : Magnetic resonance imaging (MRI)∙Ankle∙3D isotropic imaging∙Fat suppression∙Ligaments Original Article
artifact by thinner imaging slice thickness, have been tested for its feasibility in ankle joint imaging (3, 4).
Since the introduction of 3D fast spin-echo (FSE)/turbo spin-echo (TSE) isotropic imaging techniques to the musculoskeletal imaging (5), diagnostic performance or image quality comparison study between the 3D isotropic imaging sequences and the conventional two-dimensional (2D) sequences has been executed by many investigators to elucidate its possibility as a substitute tool for the 2D sequences in various joints (4-8). Many studies thoroughly evaluated the diagnostic performance of shoulder and knee joints using 3D spine-echo isotropic imaging (6, 7, 9-11). However, only a few studies have recently been published on the 3D spin-echo isotropic imaging of ankle joint (2, 4, 12).
It is well known that fat suppression (FS) allows conspicuous visualization of small anatomical details in fast spin-echo proton density or T2-weighted images (13), and the merit of FS in the visualization of small structures was verified in the several investiga- tions of the knee joint MR imaging (14, 15). But there is no published literature comparing the 3D isotropic spin-echo imaging sequences with and without fat suppression for ankle joint imaging. Hence, the purpose of our study was to compare image quality
between volume isotropic turbo spin echo acquisition (VISTA) with and without FS for ankle joint imaging.
Additionally, with respect to the diagnostic point of view, we evaluated which of the two sequences more clearly traces the ankle ligaments.
Subjects and MR examinations
Institutional review board approved this study in accordance with Health Insurance Portability and Accountability Act privacy guidelines. Informed consents were obtained from the volunteers. Signal-to- noise ratios (SNRs) were assessed from MR images of one volunteer without ankle sprain history (male; age, 28 year) and a phantom. Image contrast ratios (CRs) and the other imaging analyses were performed for MR images obtained from 10 right ankle of 10 non- symptomatic volunteers (3 men, 7 women; age, 28 ± 2.90 years). All volunteer and phantom images were obtained on a 3-T MR scanner (Gyroscan Intera Achieva; Philips Medical Systems, Best, The Netherlands) with a receive-only, eight-element phased-array dedicated ankle coil. A 3D TSE interme- diate-weighted sequence with refocusing control
MATERIALS AND METHODS
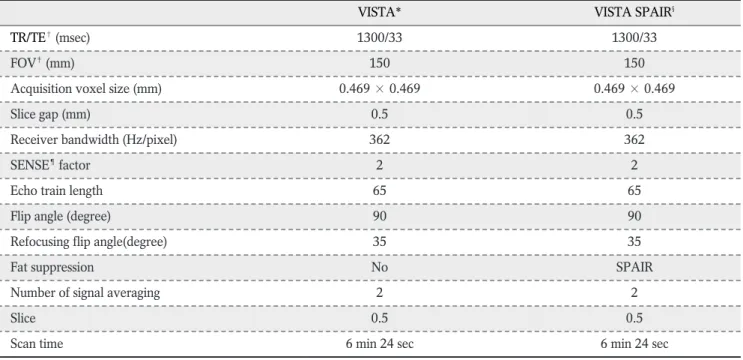
Table 1. Magnetic Resonance Imaging Sequence Parameters
VISTA* VISTA SPAIR§
TR/TE�(msec) 1300/33 1300/33
FOV�(mm) 150 150
Acquisition voxel size (mm) 0.469 × 0.469 0.469 × 0.469
Slice gap (mm) 0.5 0.5
Receiver bandwidth (Hz/pixel) 362 362
SENSE¶factor 2 2
Echo train length 65 65
Flip angle (degree) 90 90
Refocusing flip angle(degree) 35 35
Fat suppression No SPAIR
Number of signal averaging 2 2
Slice 0.5 0.5
Scan time 6 min 24 sec 6 min 24 sec
Note.─ VISTA*, volume isotropic turbo spin echo acquisition; SPAIR§, Spectral Attenuated Inversion Recovery; TR/TE�, repetition time/echo time; FOV�, field of view; SENSE¶, sensitivity encoding
VISTA with and without FS were performed for all subjects in sagittal plane. VISTA images were acquired utilizing a 3D TSE non-selective method, driven- equilibrium (DRIVE) radio frequency pulse, and an asymmetric TSE profile order (16). Spectral Attenuated Inversion Recovery (SPAIR) technique, which is a frequency-selective adiabatic inversion pulse utilizing the difference in resonance frequencies
of water and fat (2), was used for FS. The coronal and axial reformations were performed with a slice thickness of 1 mm in orthogonal plane. The reformat- ted images were made by a technologist on the work station immediately after the MR imaging. The details of the MR protocol are described in Table 1.
a c e
b d f
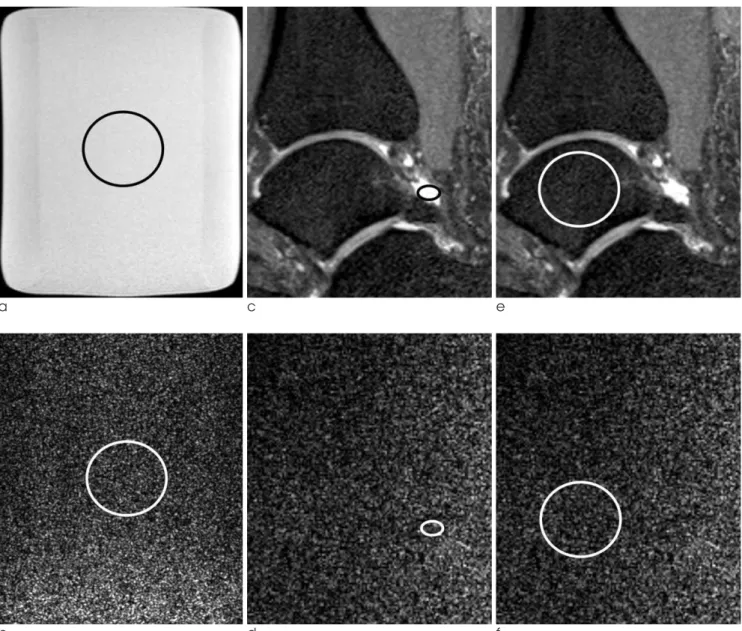
Fig. 1. Signal to noise ratio (SNR) analysis from images obtained from a phantom (a, b) and a non symptomatic volunteer (c-f) using Volume Isotropic Turbo Spin Echo Acquisition (VISTA) sequence.
(a, b) A bottle phantom containing white mineral oil (liquid petroleum at 20�C) 27 cm in height with a 2000 ml capacity was scanned (a). To calculate the SNR, 430.12 mm2sized region-of-interests (ROIs) were placed at the same position in the reconstructed object images (a) to measure mean signal intensities. The region-of-interest was duplicated in the noise-only reconstruction image (b) to measure noise on console.
(c-f) ROIs were placed in the respective tissues, including fluid (c, d), cartilage (not seen), bone marrow (e, f) and muscle with the area as large as possible avoiding the inclusion of confounding structures.
Quantitative assessment - SNR
For quantitative assessment, the signal-to-noise ratio (SNR) and contrast ratio (CR) were calculated. To assess the SNR at parallel imaging, we measured noise via noise-only data (17, 18) from a phantom and a volunteer. A bottle phantom containing 2000 ml white mineral oil (liquid petroleum at 20�C, FAC phantom assembly; Invivo Corp., Orlando, FL, USA) with 27 cm in height was scanned with VISTA and VISTA SPAIR sequences. The phantom was positioned at the center of the magnetic bore and scanned in the sagittal plane. Noise-only data was acquired for each VISTA
and VISTA SPAIR sequence with the radio frequency (RF) turned off. Both object and noise-only data were reconstructed offline to apply parallel imaging calibra- tion weights, homodyne partial Fourier phase correc- tion, and multichannel image combination to the noise-only data. To calculate the SNR of the phantom and one volunteer, 430.12 mm2sized region-of- interests (ROIs) at the same position were placed twice in the reconstructed object images to measure mean signal intensities (SIs) and duplicated in the noise-only reconstructions to measure noise (16) (Fig. 1).
In the same way, object and noise-only data were
a c e
b d f
Fig. 2. MR images of right ankle in a 31-year-old man which showed similar traceability between VISTA and VISTA SPAIR of anterior talofibular ligament (ATFL).
For both non-fat suppressed VISTA (a, c, e) and fat-suppressed (b, d, f) VISTA, both reader a and b gave high score traceability for ATFL (arrows) on sagittal (a, b), coronal (c, d) and axial (e, f) images.
obtained from a non-symptomatic volunteer and we placed ROIs in fluid, cartilage, muscle and bone marrow with the area as large as possible avoiding the inclusion of the adjacent structures (Fig. 1). We measured the SNR in VISTA and VISTA SPAIR with the following calculation:
SNR = mean of the object (Mobject)/standard deviation of the noise in the object (SDobject).
The power of the noise is often estimated from the standard deviation of the pixel signal intensity (SI) in an image region with no nuclear magnetic resonance
(NMR) signal, so the SDobjectwas evaluated in the noise only image at the same location as was at the object image. For a Rician distribution in the absence of the signal, the SDobject is calculated as the mean of the noise image/1.253 (16, 19). So the SNR is defined like follows in conclusion:
SNR=Mobject/SDobject= 1.253 × Mobject/Mnoise (Mnoise
= the mean of the noise image) (19, 20).
Quantitative assessment - CR
CRs of the tissues were calculated between the
a c e
b d f
Fig. 3. MR images of right ankle in a 31-year-old man which showed similar traceability between VISTA and VISTA SPAIR of calcaneofibular ligament (CFL).
For both non-fat suppressed VISTA (a, c, e) and fat-suppressed (b, d, f) VISTA, both reader a and b gave high score traceability for CFL (arrows) sagittal (a, b), coronal (c, d) and axial (e, f) images.
tissues and joint fluid and between the tissues and fat in VISTA and VISTA SPAIR sequences. The assessed tissues were cartilage, tendon, and ligament. SIs from joint fluid (F) at the anterior or posterior subtalar recess, fat (f) at the Kager’s fat pad, cartilage (C) at the tibial plafond, tendon (T) at the Achilles tendon and ligaments (anterior talofibular ligament, calcaneofibu- lar ligament) were measured in all 10 patients in ROIs.
ROIs were placed in the respective tissues, with the area as large as possible avoiding the inclusion of the
adjacent tissues. The smallest size of a region-of- interest (ROI) was 3 mm2in all tissues except in ligaments, where the smallest one was 2.0 mm2. CRs between the tissues and fluid and also between the tissues and fat were calculated by dividing the differ- ence between the SI of the reference tissue and the SI of the compared tissue by the sum of the SI of the reference tissue and the SI of the compared tissue as follows:
CR = (SIref- SIctiss)/ (SIref+SIctiss) (SIref, the SI of the
a c e
b d f
Fig. 4. MR images of right ankle in a 28-year-old man which showed significantly different traceability between VISTA and VISTA SPAIR of calcaneofibular ligament (CFL).
For non-fat suppressed VISTA (a, c, e), reader a and b gave high score traceability for CFL (arrows) on sagittal (a), coronal (d) and axial (e) images.
For fat suppressed VISTA (b, d, f), however, both readers gave score 1 or 2 for CFL (arrowheads) on sagittal (b), coronal (d), and axial images.
reference tissue; SIctiss, SI of the compared tissue) (21).
To ensure consistency, measurements were performed by one radiology resident (K.E.C, a third- year resident trainee). The CR of the cartilage to the synovial fluid, the CR of the tendon to the synovial fluid, the CR of the ligament to the synovial fluid were calculated for each sequence. In the same way, the CR of the cartilage to the fat, the CR of the tendon to the fat, the CR of the ligament to the fat were calculated for each sequence. SIs were measured twice for each tissue and the mean SI was used for CR calculation.
Ligament traceability
Two experienced musculoskeletal radiologists (Y.H.L. and S.K. with 7- and 11-year experience in musculoskeletal MR imaging, respectively) indepen- dently evaluated VISTA and VISTA SPAIR images using a picture archiving and communication system (Centricity Radiology RA 1000; General Electric Healthcare, Chicago, IL, USA) in random order. The time interval between the review session of VISTA and that of VISTA SPAIR was 2 months to avoid the recall bias. They were asked to score the traceability of anterior talofibular ligament (ATFL), posterior talofibular ligament (PTFL), calcaneofibular ligament (CFL), superficial deltoid ligament (sD), deep deltoid ligament (dD), anterior inferior tibiofibular ligament (AiTFL), and posterior inferior tibiofibular ligament
(PiTFL) in all planes including sagittal source, axial reformatted, and coronal reformatted images respec- tively, based on a 4-point scale (1, not traceable; 2,
Table 2. Signal-to-noise Ratio (SNR) Comparison
SI� Noise SNR
Phantom VISTA SPAIR� 1695.02 21.94 96.80
VISTA* 1679.85 21.65 97.23
Fluid VISTA SPAIR 2002.55 89.15 28.19
VISTA 1434.1 70.75 25.40
Cartilage VISTA SPAIR 1182.25 74.19 20.14
VISTA 915.81 55.20 20.75
Muscle VISTA SPAIR 937.74 71.75 16.40
VISTA 735.09 47.87 19.23
Bone Marrow VISTA SPAIR 398.81 65.35 7.65
VISTA 1337.92 45.75 36.64
Note.─ * VISTA: volume isotropic turbo spin echo acquisition.
�SPAIR: spectral attenuated inversion recovery.
�SI: signal intensity.
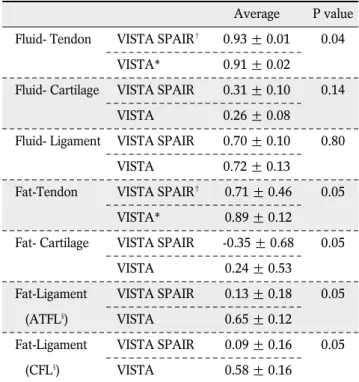
Table 3. Image Contrast Ratios (CRs) Comparison
Average P value Fluid- Tendon VISTA SPAIR� 0.93 ± 0.01 0.04
VISTA* 0.91 ± 0.02
Fluid- Cartilage VISTA SPAIR 0.31 ± 0.10 0.14
VISTA 0.26 ± 0.08
Fluid- Ligament VISTA SPAIR 0.70 ± 0.10 0.80
VISTA 0.72 ± 0.13
Fat-Tendon VISTA SPAIR� 0.71 ± 0.46 0.05
VISTA* 0.89 ± 0.12
Fat- Cartilage VISTA SPAIR -0.35 ± 0.68 0.05 VISTA 0.24 ± 0.53 Fat-Ligament VISTA SPAIR 0.13 ± 0.18 0.05
(ATFL§) VISTA 0.65 ± 0.12
Fat-Ligament VISTA SPAIR 0.09 ± 0.16 0.05
(CFL§) VISTA 0.58 ± 0.16
Note.─ Measured CRs are the mean ± SD. Significant difference at p < 0.05.
* VISTA: volume isotropic turbo spin echo acquisition
�SPAIR: spectral attenuated inversion recovery
§ATFL: anterior talofibular ligament CFL: calcaneofibular ligament
barely traceable; 3, adequately traceable; 4, excellently traceable).
Statistical analysis
For analysis of the differences in CRs between the VISTA and VISTA SPAIR images, the Wilcoxon signed- rank test was used. For analysis of differences in traceability between VISTA and VISTA SPAIR images, Fisher’s exact test and Pearson’s chi-squared test were used. A p value < 0.05 was considered statistically significant. Interobserver agreement in scoring of ligament traceability was assessed using kappa (κ) analysis in squared data, but percent agreement was used for the non-squared data. The κvalue was interpreted as poor (0.00), slight (0.0-0.20), fair (0.21- 0.40), moderate (0.41-0.60), substantial (0.61-0.80), and near perfect (0.81-1.00) agreement (22, 23).
The results of SNR analysis are presented in Table 2.
SNR of bone marrow was substantially lower and SNR of muscle was slightly lower in VISTA SPAIR sequence, whereas the SNRs of other tissues and phantom did not show significant difference between the sequences although the statistical comparison was not possible as just one volunteer’s ankle and one phantom were assessed. The results of CR analysis of other tissues with reference to the fluid and fat are presented in Table 3. The mean CR of tendon was superior in VISTA SPAIR than VISTA with reference to the fluid, which was statistically significant. In terms of CR between fat and other tissues, VISTA was statis- tically superior in all tissues than VISTA SPAIR.
RESULTS
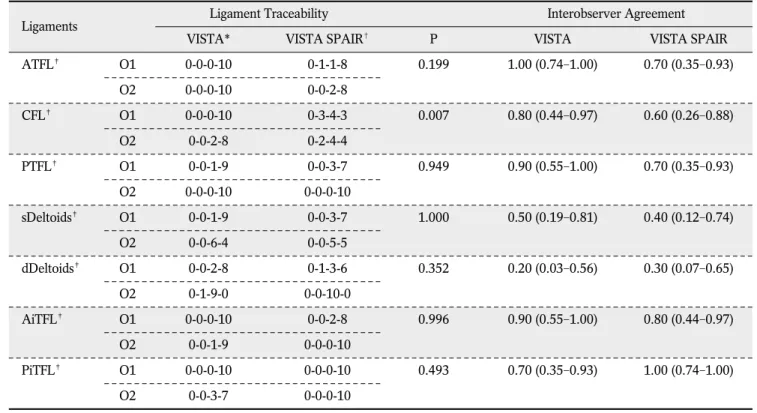
Table 4. Comparison of Ligament Traceability and Interobserver Agreement in Sagittal Plane
Ligaments Ligament Traceability Interobserver Agreement
VISTA* VISTA SPAIR� P VISTA VISTA SPAIR
ATFL� O1 0-0-0-10 0-1-1-8 0.199 1.00 (0.74-1.00) 0.70 (0.35-0.93)
O2 0-0-0-10 0-0-2-8
CFL� O1 0-0-0-10 0-3-4-3 0.007 0.80 (0.44-0.97) 0.60 (0.26-0.88)
O2 0-0-2-8 0-2-4-4
PTFL� O1 0-0-1-9 0-0-3-7 0.949 0.90 (0.55-1.00) 0.70 (0.35-0.93)
O2 0-0-0-10 0-0-0-10
sDeltoids� O1 0-0-1-9 0-0-3-7 1.000 0.50 (0.19-0.81) 0.40 (0.12-0.74)
O2 0-0-6-4 0-0-5-5
dDeltoids� O1 0-0-2-8 0-1-3-6 0.352 0.20 (0.03-0.56) 0.30 (0.07-0.65)
O2 0-1-9-0 0-0-10-0
AiTFL� O1 0-0-0-10 0-0-2-8 0.996 0.90 (0.55-1.00) 0.80 (0.44-0.97)
O2 0-0-1-9 0-0-0-10
PiTFL� O1 0-0-0-10 0-0-0-10 0.493 0.70 (0.35-0.93) 1.00 (0.74-1.00)
O2 0-0-3-7 0-0-0-10
Note.─ * VISTA: volume isotropic turbo spin echo acquisition
�SPAIR: spectral attenuated inversion recovery
�ATFL: anterior talofibular ligament CFL: calcaneofibular ligament PTFL: posterior talofibular ligament sDeltoid: superficial deltoid ligament dDeltoid: deep deltoid ligament
AiTFL: anterior inferior tibiofibular ligament PiTFL: posterior inferior tibiofibular ligament
For ligaments traceability, CFL showed statistically significant superior score in VISTA than VISTA SPAIR (p < 0.05) (Fig. 4, Tables 4, 5, 6). VISTA showed superior traceability in the rest of six ligaments, but it was not statistically significant when the scores were being compared. The interobserver agreements of ligament traceability in VISTA and VISTA SPAIR are presented in (Tables 4, 5, 6). Most of them showed more than moderate (0.41-0.60) agreement except, sD in VISTA SPAIR, dD in VISTA and VISTA SPAIR of sagittal images, and sD and dD in both of VISTA and VISTA SPAIR of axial images.
3D isotropic spin echo sequences have overcome
problems such as long acquisition and post-processing time by parallel imaging in both phase-encoding directions (24) and by partial Fourier acquisition (25).
However, 3D isotropic imaging still takes quite a long time so that we need to choose the one between fat- suppressed and non-fat-suppressed sequences.
Fortunately, the SNR of VISTA and VISTA SPAIR did not show notable difference in phantom and also in majority of tissues of a volunteer except for bone marrow, which contain fat component and was remarkably lower in VISTA SPAIR than in VISTA (7.65 vs. 36.64). The SNR of cartilage and fluid was almost equal in both sequences, which seems to be natural considering lack of fat in the tissues. SNR of the muscle is slightly lower in VISTA SPAIR than VISTA (16.40 vs. 19.23) presumably because muscle may contain small amount of fat.
DISCUSSION
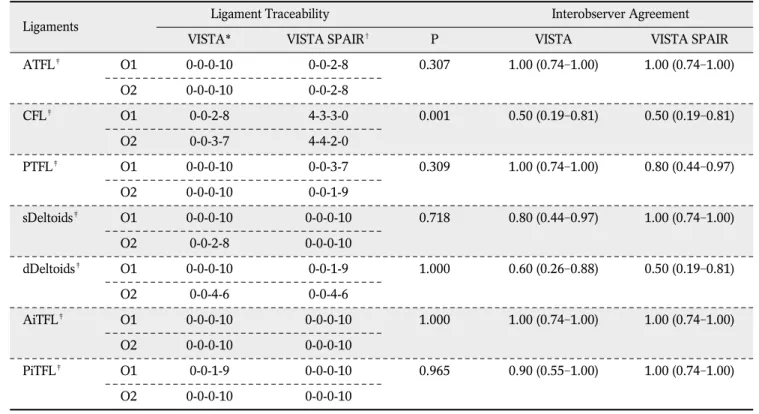
Table 5. Comparison of Ligament Traceability and Interobserver Agreement in Coronal Plane
Ligaments Ligament Traceability Interobserver Agreement
VISTA* VISTA SPAIR� P VISTA VISTA SPAIR
ATFL� O1 0-0-0-10 0-0-2-8 0.307 1.00 (0.74-1.00) 1.00 (0.74-1.00)
O2 0-0-0-10 0-0-2-8
CFL� O1 0-0-2-8 4-3-3-0 0.001 0.50 (0.19-0.81) 0.50 (0.19-0.81)
O2 0-0-3-7 4-4-2-0
PTFL� O1 0-0-0-10 0-0-3-7 0.309 1.00 (0.74-1.00) 0.80 (0.44-0.97)
O2 0-0-0-10 0-0-1-9
sDeltoids� O1 0-0-0-10 0-0-0-10 0.718 0.80 (0.44-0.97) 1.00 (0.74-1.00)
O2 0-0-2-8 0-0-0-10
dDeltoids� O1 0-0-0-10 0-0-1-9 1.000 0.60 (0.26-0.88) 0.50 (0.19-0.81)
O2 0-0-4-6 0-0-4-6
AiTFL� O1 0-0-0-10 0-0-0-10 1.000 1.00 (0.74-1.00) 1.00 (0.74-1.00)
O2 0-0-0-10 0-0-0-10
PiTFL� O1 0-0-1-9 0-0-0-10 0.965 0.90 (0.55-1.00) 1.00 (0.74-1.00)
O2 0-0-0-10 0-0-0-10
Note.─ * VISTA: volume isotropic turbo spin echo acquisition
�SPAIR: spectral attenuated inversion recovery
�ATFL: anterior talofibular ligament CFL: calcaneofibular ligament PTFL: posterior talofibular ligament sDeltoid: superficial deltoid ligament dDeltoid: deep deltoid ligament
AiTFL: anterior inferior tibiofibular ligament PiTFL: posterior inferior tibiofibular ligament
Our study has shown that VISTA demonstrated superior or the same ligament traceability as compared with fat-suppressed VISTA. It is a notable result because fat suppression has been reported, by many investigators, as a way to improve performance of musculoskeletal MR imaging in tracing normal structure and in depicting pathologies by enhancing soft tissue contrast (13, 14, 26). Among the ankle ligaments in our study, CFL showed superior traceabil- ity in non-fat-suppressed VISTA than in fat-suppressed VISTA with statistical significance, whereas the other ligaments showed no statistically significant difference in ligament traceability. CFL is commonly injured ankle ligament, second only to ATFL. Hence, CFL is one of the most important structure to look at on the ankle MR images, and its poor traceability is expected to affect diagnostic performance of MR imaging. It is
not clear why the CFL showed less traceability, but we speculate the causes are like follows. We obtained images from the volunteers who had no history of ankle sprain. However, obtaining absolutely healthy volunteer is hardly possible because many individuals, who have no memory of ankle sprain ever, might have minor/major sprain history. So we presumed that unexpected recurrent chronic sprains of CFL might be present in our study population with showing changes such as scar-tissue formation and fat deposition (27, 28). The CFL extends proximally from the fibular tip, deep to the peroneal tendons, distally to the postero- lateral calcaneus, which show long course through the fat tissue (29). The CR was expectedly superior in VISTA than in VISTA SPAIR between fat and CFL, which is attributable to the “undisclosive” effect due to signal loss of CFL by suppression of intraligamen- Table 6. Comparison of Ligament Traceability and Interobserver Agreement in Axial Plane
Ligaments Ligament Traceability Interobserver Agreement
VISTA* VISTA SPAIR� P VISTA VISTA SPAIR
ATFL� O1 0-0-0-10 0-0-3-7 0.177 1.00 (0.74-1.00) 0.90 (0.55-1.00)
O2 0-0-0-10 0-0-2-8
CFL� O1 0-0-1-9 3-5-1-1 0.001 0.60 (0.26-0.88) 0.60 (0.26-0.88)
O2 0-0-3-7 4-4-2-0
PTFL� O1 0-0-1-9 0-0-1-9 1.000 0.90 (0.55-1.00) 0.90 (0.55-1.00)
O2 0-0-0-10 0-0-0-10
sDeltoids� O1 0-0-0-10 0-0-0-10 0.950 0.60 (0.26-0.88) 0.30 (0.07-0.65)
O2 0-0-4-6 0-0-7-3
dDeltoids� O1 0-0-0-10 0-0-1-9 0.745 0.50 (0.19-0.81) 0.20 (0.03-0.56)
O2 0-0-5-5 0-0-9-1
AiTFL� O1 0-0-0-10 0-0-1-9 0.965 1.00 (0.74-1.00) 0.90 (0.55-1.00)
O2 0-0-0-10 0-0-0-10
PiTFL� O1 0-0-0-10 0-0-1-9 1.000 1.00 (0.74-1.00) 0.90 (0.55-1.00)
O2 0-0-0-10 0-0-0-10
Note.─ * VISTA: volume isotropic turbo spin echo acquisition
�SPAIR: spectral attenuated inversion recovery
�ATFL: anterior talofibular ligament CFL: calcaneofibular ligament PTFL: posterior talofibular ligament sDeltoid: superficial deltoid ligament dDeltoid: deep deltoid ligament
AiTFL: anterior inferior tibiofibular ligament PiTFL: posterior inferior tibiofibular ligament
tous fat. Additionally, CFL has the most variable features of size, shape, orientation, and capsular formation among the lateral ankle ligaments in cadaveric study (30). Dimmick et al. reported 19% of CFL of the patients without recognized ankle sprain history showed heterogenous signal on MR images with showing a separate lateral hypointense band a medial isointense medial band (31). Poor traceability of CFL might also be due to the signal intensity of healed/inherently heterogeneous-natured CFL which is similar to the adjacent suppressed fat.
Poor traceability of CFL in fat suppressed sequence in our study can be translated into the imaging interpretation of chronic ligament injury. Application of fat suppression for ligament MR imaging was advocated by the fact that fat suppression would be beneficial in acute cases because there may be accompanying high signal intensity due to hemorrhage or fluid collection within the joint or adjacent soft tissue (32). As the time goes by, ligaments typically heal through filling of the defect with a fibrous scar, which begins to form via fibroblastic proliferation as early as 7 days after the injury (28). And further remodeling of the fibrous scar goes on as the resolving hematoma and disorganizing matrix with the areas containing fat cells, vascular structure and clusters of mononuclear cells (27, 33). Although at a certain point of this time course, fat-suppressed MR image would be helpful in the evaluation of ankle ligament tear, but when there is no hemorrhage or fluid collec- tion in chronic status, the validity of fat suppression is doubtful and the role of MRI in evaluation chronic injury might become depicting ligament irregularity or thickening, heterogeneity of ligament signal and ligament visibility (34, 35). Resultantly, in the assess- ment of chronic ankle injury, whether the ligament is traceable would be more important. Park et al.
reported that fat suppressed MR imaging does not show perfect sensitivity for the evaluation of chronic lateral ankle ligament injury (36).
This study had several limitations. The first limitation was that only healthy volunteers were included and the number was relatively small. An additional study will be necessary to compare the diagnostic perfor- mance of VISTA and VISTA SPAIR in detection of various internal derangement of the ankle with a correlation to arthroscopic findings. Second, there is a
possibility that healthy volunteers are not genuine healthy because ankle joint is the most common and vulnerable one that volunteers could have history of inversion injury without awareness. Third, there might be a bias during evaluating images because the radiol- ogists could be aware of which MR sequences are they reviewing, although all the other information on the images and subjects were blinded to the reviewers.
Nevertheless, our study has a merit because there has been no report that comparing between the ankle MR imaging with and without fat suppression in 3D isotropic imaging, even in 2D conventional MR imaging.
In conclusion, ligament traceability of VISTA without fat suppression demonstrated superior traceability compared to VISTA SPAIR with statistical significance, especially in CFL, which fact is expected to be translated into MR imaging assessment of chronic ligament injury. No significant difference of SNR was observed between the sequences except for bone marrow and muscle in tissue based analysis.
References
1. Fong DT, Hong Y, Chan L, Yung PS, Chan K. A systematic review on ankle injury and ankle sprain in sports. Sports Medicine 2007;37:73-94
2. Kim HS, Yoon YC, Kwon JW, Choe B. Qualitative and quanti- tative assessment of isotropic ankle magnetic resonance imaging: three-dimensional isotropic intermediate-weighted turbo spin echo versus three-dimensional isotropic fast field echo sequences. Korean J Radiol 2012;13:443-449
3. Gold GE, Chen CA, Koo S, Hargreaves BA, Bangerter NK.
Recent advances in MRI of articular cartilage. AJR Am J Roentgenol 2009;193:628-638
4. Stevens KJ, Busse RF, Han E, et al. Ankle: isotropic MR imaging with 3D-FSE-cube--initial experience in healthy volunteers.
Radiology 2008;249:1026-1033
5. Yao L, Pitts JT, Thomasson D. Isotropic 3D fast spin-echo with proton-density-like contrast: a comprehensive approach to musculoskeletal MRI. AJR Am J Roentgenol 2007;188:W199- 201
6. Gold GE, Busse RF, Beehler C, et al. Isotropic MRI of the knee with 3D fast spin-echo extended echo-train acquisition (XETA):
initial experience. AJR Am J Roentgenol 2007;188:1287-1293 7. Jung JY, Yoon YC, Kwon JW, Ahn JH, Choe BK. Diagnosis of
internal derangement of the knee at 3.0-T MR imaging: 3D isotropic intermediate-weighted versus 2D sequences. Radiology 2009;253:780-787
8. Ristow O, Stehling C, Krug R, et al. Isotropic 3-dimensional fast spin echo imaging versus standard 2-dimensional imaging at 3.0 T of the knee: artificial cartilage and meniscal lesions in a porcine model. J Comput Assist Tomogr 2010;34:260-269
9. Notohamiprodjo M, Horng A, Pietschmann MF, et al. MRI of the knee at 3T: first clinical results with an isotropic PDfs- weighted 3D-TSE-sequence. Invest Radiol 2009;44:585-597 10. Jung JY, Yoon YC, Choi S, Kwon JW, Yoo J, Choe B. Three-
dimensional isotropic shoulder MR arthrography: comparison with two-dimensional MR arthrography for the diagnosis of labral lesions at 3.0 T. Radiology 2009;250:498-505
11. Choo HJ, Lee SJ, Kim O, Seo SS, Kim JH. Comparison of three- dimensional isotropic T1-weighted fast spin-echo MR arthrogra- phy with two-dimensional MR arthrography of the shoulder.
Radiology 2012;262:921-931
12. Notohamiprodjo M, Kuschel B, Horng A, et al. 3D-MRI of the ankle with optimized 3D-SPACE. Invest Radiol 2012;47:231- 239
13. Delfaut EM, Beltran J, Johnson G, Rousseau J, Marchandise X, Cotten A. Fat suppression in MR imaging: techniques and pitfalls. Radiographics 1999;19:373-382
14. Lee S, Jee W, Kim SK, Kim J. Proton density-weighted MR imaging of the knee: fat suppression versus without fat suppres- sion. Skeletal Radiology 2011;40:189-195
15. Scha¨fer FK, Schfer PJ, Brossmann J, et al. Value of fat-suppressed proton-density-weighted turbo spin-echo sequences in detecting meniscal lesions: comparison with arthroscopy. Acta Radiol 2006;47:385-390
16. Seo JM, Yoon YC, Kwon JW. 3D isotropic turbo spin-echo intermediate-weighted sequence with refocusing control in knee imaging: comparison study with 3D isotropic fast-field echo sequence. Acta Radiol 2011;52:1119-1124
17. Dietrich O, Raya JG, Reeder SB, Reiser MF, Schoenberg SO.
Measurement of signal-to-noise ratios in MR images: influence of multichannel coils, parallel imaging, and reconstruction filters. J Magn Reson Imaging 2007;26:375-385
18. Viera AJ, Garrett JM. Understanding interobserver agreement:
the kappa statistic. Fam Med 2005;37:360-363
19. Gudbjartsson H, Patz S. The Rician distribution of noisy MRI data. Magn Reson Med 1995;34:910-914
20. Nelles M, Konig RS, Gieseke J, et al. Dual-source parallel RF transmission for clinical MR imaging of the spine at 3.0 T:
intraindividual comparison with conventional single-source transmission. Radiology 2010;257:743-753
21. Turetschek K, Wunderbaldinger P, Bankier AA, et al. Double inversion recovery imaging of the brain: initial experience and comparison with fluid attenuated inversion recovery imaging.
Magn Reson Imaging 1998;16:127-135
22. Crewson PE. Reader agreement studies. AJR Am J Roentgenol
2005;184:1391-1397
23. Kundel HL, Polansky M. Measurement of observer agreement.
Radiology 2003;228:303-308
24. Wang Z, Fernndez-Seara MA. 2D partially parallel imaging with k-space surrounding neighbors-based data reconstruction. Magn Reson Med 2006;56:1389-1396
25. Noll DC, Nishimura DG, Macovski A. Homodyne detection in magnetic resonance imaging. IEEE Transactions on Medical Imaging 1991;10:154-163
26. Singson RD, Hoang T, Dan S, Friedman M. MR evaluation of rotator cuff pathology using T2-weighted fast spin-echo technique with and without fat suppression. AJR Am J Roentgenol 1996;166:1061-1065
27. Chimich D, Frank C, Shrive N, Dougall H, Bray R. The effects of initial end contact on medial collateral ligament healing: a morphological and biomechanical study in a rabbit model. J Orthop Res 1991;9:37-47
28. Brostrm L, Sundelin P. Sprained ankles. IV. Histologic changes in recent and “chronic” ligament ruptures. Acta Chir Scand 1966;132:248-253
29. Datir A, Connell D. Imaging of impingement lesions in the ankle. Top Magn Reson Imaging 2010;21:15-23
30. Kitsoulis P, Marini A, Pseftinakou A, Iliou K, Galani V, Paraskevas G. Morphological study of the calcaneofibular ligament in cadavers. Folia Morphol 2011;70:180-184
31. Dimmick S, Kennedy D, Daunt N. Evaluation of thickness and appearance of anterior talofibular and calcaneofibular ligaments in normal versus abnormal ankles with MRI. J Med Imaging Radiat Oncol 2008;52:559-563
32. Mirowitz SA, Shu HH. MR imaging evaluation of knee collat- eral ligaments and related injuries: comparison of T1-weighted, T2-weighted, and fat-saturated T2-weighted sequences--correla- tion with clinical findings. J Magn Reson Imaging 1994;4:725- 732
33. Schneck CD, Mesgarzadeh M, Bonakdarpour A. MR imaging of the most commonly injured ankle ligaments. Part II. Ligament injuries. Radiology 1992;184:507-512
34. Cass JR, Morrey BF. Ankle instability: current concepts, diagno- sis, and treatment. Mayo Clinic proceedings 1984;59:165-170 35. Kumar V. Deficiencies of MRI in the diagnosis of chronic
symptomatic lateral ankle ligament injuries. Foot and ankle surgery 2007;13:171-176
36. Park HJ, Cha SD, Kim SS, et al. Accuracy of MRI findings in chronic lateral ankle ligament injury: comparison with surgical findings. Clin Radiol 2012;67:313-318
통신저자 : 김성준, (135-720) 서울시 강남구 언주로 211, 연세대학교 강남세브란스병원 영상의학과 Tel. (02) 2019-3510 Fax. (02) 3462-5472 E-mail: [email protected]
발목관절 VISTA 자기공명영상에서 정량평가와 인대의 Traceability:
지방억제 대비 지방억제기법
1연세대학교 강남세브란스병원 영상의학과
2연세대학교 세브란스병원 영상의학과
조경은1∙윤춘식1∙송호택2∙이영한2∙임대건2∙서진석2∙김성준1
목적: 발목관절 VISTA 자기공명영상을 이용하여 지방억제를 한 것과 하지 않은 VISTA 사이에서 정량평가를 하며, 발목 인대의 traceability 차이를 알아보고자 하였다.
대상과 방법: SNR의 비교를 위해 팬텀과 한명의 자원자에서 자기공명영상을 촬영하였다. CR (contrast ratio)과 인대 traceability 비교를 위해 발목 관절의 외상 과거력이 없는 10명의 자원자에서 자기공명영상을 촬영하였다. 모 든 자기공명영상은 VISTA를 이용하였고 3T에서 촬영하였다. 지방억제는 SPAIR (Spectral Attenuated Inversion Recovery) 기법을 이용하였다. SNR은 피검자가 있을 때와 피검자 없이 촬영한 것으로 구하였다. CR은 열개의 오른쪽 발목관절의 관절액-힘줄, 관절액-연골, 관절액-인대, 지방-힘줄, 지방-연골, 지방-인대의 신호강도를 얻어 구하였다. 두 명의 근골격계 영상의학과 의사가 지방억제를 한 것과 하지 않은 영상을 calcaneofibular ligament (CFL)을 포함한 7개의 발목관절 인대에 대해서 점수를 매겼다 (1, not traceable; 2, barely traceable; 3, adequately traceable; 4, excellently traceable). VISTA 와 VISTA SPAIR 사이에 CR을 비교 하는 데는 Wilcoxon signed-rank test를 이용하였다. VISTA 와 VISTA SPAIR사이에 인대 traceability를 비교 하는 데에는 Fisher’s exact test와 Pearson’s chi-squared test를 이용하였다.
결과: 정량평가의 SNR을 보면 지방억제를 하지 않은 영상에 비해 지방억제를 한 자원자의 골수에서 더 낮은 수치를 나타내었다. (7.65 versus [vs.] 36.64). 관절액, 연골, 근육에서는 두 연쇄간에 SNR의 차이가 없었다. 지방억제 VISTA는 관절액-인대 사이 CR만 더 나은 결과를 보여주었지만 (p=0.04) VISTA는 지방-힘줄, 지방-연골, 지방-인 대 간에서 모두 더 나은 CR값을 나타내었다(P=0.005). CFL 인대만 통계학적으로 의미 있는 값을 보였는데 지방 억제를 하지 않은 VISTA 영상에서 traceability의 값이 더 우세 하였다(p <0.05).
결론: 지방 억제를 한 VISTA와 하지 않은 VISTA에서 유의한 SNR 차이는 골수를 제외하고 없었다. 지방억제를 하 지 않은 VISTA에서 CFL을 trace하는데 있어서 더 유리하였다.
대한자기공명의과학회지 17:110-122(2013)