J. Korean For. Soc. Vol. 103, No. 3, pp. 462~472 (2014) http://dx.doi.org/10.14578/jkfs.2014.103.3.462
462
JOURNAL OF KOREAN FOREST SOCIETY ISSN 0445-4650(Print), ISSN 2289-0904(Online) http://e-journal.kfs21.or.kr
수급모형을 이용한 목제품 시장 전망
이상민*·김경덕·송성환·박지은
한국농촌경제연구원 산림정책연구부
Outlook of Wood Products Markets with Supply and Demand Model
Sang-Min Lee*, Kyeong-Duk Kim, Seong-Hwan Song and Ji-Eun Bark Department of Forest Policy Research, Korea Rural Economic Institute, Seoul 130-710, Korea 요 약: 이 연구는 목제품의 수급모형을 개발하고, 제품별로 중장기적인 수요와 공급을 전망하는 데 목적이 있다. 목 제품 시장 수급모형은 주요 제품인 제재목, 합판, 파티클보드, 섬유판, 펄프 등으로 한정하였다. 각각의 제품에 대해 공급함수, 수입수요함수, 수요함수 등을 추정하여 부분균형 모형을 구축하였다. 주어진 외생변수를 이용하여 2050년 까지 전망한 결과 제재목, 합판, 섬유판 등의 국내공급 및 수입은 감소할 것으로 예상된다. 이는 환경보호와 자원의 무기화 등으로 인해 국내외 원목가격이 인상될 것이라고 예상하였기 때문이다. 반면 폐재를 재활용하는 파티클보드 와 목재칩을 원료로 이용하는 펄프의 경우 전체적인 공급은 늘어날 것으로 전망된다.
Abstract: This study is aimed at developing a supply-demand model of wood products, and outlook for mid- term and long-term supply and demand for each products. The main wood products include sawnwood, plywood, particle board, fiberboard (MDF), and pulp. The partial equilibrium model is composed of supply function, import demand function, demand function, price relation function. With given parameters the outlook for year 2050 says that sawnwood, plywood, and fiberboard for domestic productions and imports are decreased. This may result from the increase of log prices from the inside and outside of the country because of the propensity for environment protection and the resource nationalism. On the other hand the supply of particle board and pulp will increase because they are made from wasted wood and chips.
Key words: partial equilibrium spply-demand model, outlook, sawnwood, plywood, parameter
서 론
산림에서 생산되는 목재는 합판, 제재목, 파티클보드 등 제품을 만들기 위한 원료로 투입된다. 그러나 우리나라의 산림에서 생산되는 국내재의 경우 목제품의 원료로 이용 되기 보다는 펄프, 칩, 톱밥 등과 같이 파쇄하거나 섬유질 을 이용하는 제품을 만드는 데 주로 투입된다. 그 결과 우 리나라는 목제품 가공을 위하여 원목수입에 크게 의존할 수밖에 없는 실정이다. 그러나 전 세계적으로 기후변화에 대응한 산림의 역할이 강조되고 있고, 산림자원 부국들의 자연자원 무기화로 인해 원목 수입은 시간이 흐름에 따라
더욱 어려워질 전망이다. 또한 무역자유화 등에 따른 국 내시장의 개방으로 인해 목제품 수입은 더욱 확대될 것으 로 보인다. 중장기적으로 산림과 임업을 둘러싼 대내외적 인 많은 변화가 예상되는 시점에서 다양한 내외부환경의 변화가 우리나라 임업에 미치는 영향을 계량적으로 분석 하여 예측하는 것은 변화에 적응하기 위해 반드시 필요한 과정이다.
초기 목제품 수요나 공급에 관한 국내연구는 단일방정 식을 추정하는 방법이 대표적이었다고 말할 수 있다. 이 러한 방법은 외부환경 변화에 따라 공급과 수요가 상호 작용하여 미래를 예측하는 것이 아니라 일방적인 변화만 을 고려하는 것이기 때문에 전망이 과대평가될 위험을 배 제할 수 없는 단점이 있다(Kim et al., 1980; Yum, 1993;
Youn et al., 1992; Jang et al., 1993). 1990년대 말부터 수요와 공급 방정식, 가격관계식, 항등식 등을 통합하여 이 연구는 한국농촌경제연구원의 기본과제인「임산물 수급
모형 구축 및 전망」의 일부를 논문으로 재작성한 것임.
*Corresponding author E-mail: [email protected]
만든 수급모델이 개발되었다(Joo et al., 1998; Lee et al., 2008). 국외연구의 경우 Timber Assessment Market Model(TAMM)을 이용하여 북미지역에 초점을 맞춘 Adams and Haynes(1980; 1989)의 연구, 목제품의 생산, 소비, 가격, 무역 등에 관한 내용을 포함한 CINTRAFOR Golbal Trade Model(CGTM)을 이용한 Perez-Garcia(1994) 의 연구, 부분균형모형을 이용하여 북미자유무역협정 체 결에 따른 임업부문 영향을 분석한 Prestemon(1996)의 연 구, 임산물에 대한 비관세장벽 영향을 분석한 New Zealand Forest Research Institute Ltd.(1999)의 연산일반 균형모형인 GTAP(Global Trade Assessment Project), 그리 고 Global Forest Product Model (GFPM) (Buongiorno et al., 2003) 등이 임업부문 대표적인 연구로 알려져 있다.
이 연구는 주요 목제품의 수요와 공급을 분석하는 부분 균형모형을 만들어 중장기적인 목제품 시장을 전망하는 데 목적이 있다. 본 연구는 4개 절로 이루어졌다. 제 2절 에서는 목제품 시장의 개요에 대한 설명과 제재목, 합판, 파티클보드, 섬유판, 화학펄프 등 우리나라 주요 목제품 시장의 수급을 계량경제모형으로 분석하였다. 제 3절에서 는 앞에서 분석된 주요 목제품시장의 수급분석을 통해 향 후 목제품 시장의 수급을 전망하였다. 이를 위해서 먼저 모형의 안정성을 평가하고, 모형에 사용된 외생변수의 변 화를 가정하였다. 마지막 절에서는 본고의 요약과 결론을
제시하였다.
목제품 시장
목제품 시장모형의 흐름도는 Figure 1과 같이 나타낼 수 있다. 목제품시장은 원목을 이용하여 생산한 제품(제재목, 합판, 파티클보드, 섬유판, 펄프 등)과 기타 제품의 수급관 계를 나타내는 것이다. 생산된 제품과 수입제품을 합하여 시장의 공급을 나타내며, 수요와 일치하는 점에서 균형가 격이 형성된다. 수출은 극히 미미한 수준이므로 분석에서 제외하였다. 방정식 추정과 모형분석을 위하여 EViews 3.0
Figure 1. Supply-demand structure of wood products.
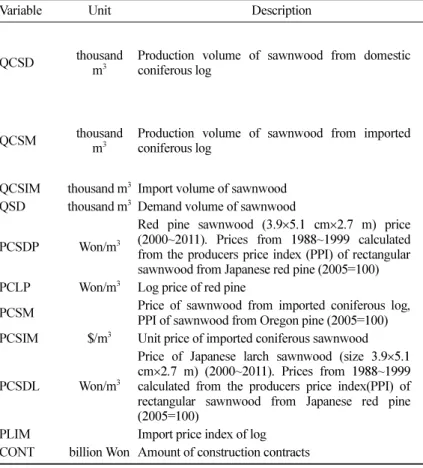
Table 1. Variables for sawnwood supply and demand functions.
Variable Unit Description Source
QCSD thousand
m3
Production volume of sawnwood from domestic coniferous log
1988~1995:Statistical yearbook of forestry
1996~2001:Calculated from Korea Forestry Research Institute
2002~2010:Timber supply and demand(Korea Forest Service)
QCSM thousand
m3
Production volume of sawnwood from imported coniferous log
1998~1995:Statistical yearbook of forestry
1996~2001:Calculated from Korea Forestry Research Institute
2002~2010:Timber supply and demand (Korea Forest Service)
QCSIM thousand m3 Import volume of sawnwood Korea International Trade Association
QSD thousand m3 Demand volume of sawnwood QCSD+QCSM+QCSIM
PCSDP Won/m3
Red pine sawnwood (3.9×5.1 cm×2.7 m) price (2000~2011). Prices from 1988~1999 calculated from the producers price index (PPI) of rectangular sawnwood from Japanese red pine (2005=100)
Statistical yearbook of forestry (SYF)
PCLP Won/m3 Log price of red pine Statistical yearbook of forestry PCSM Price of sawnwood from imported coniferous log,
PPI of sawnwood from Oregon pine (2005=100) The Bank of Korea
PCSIM $/m3 Unit price of imported coniferous sawnwood Korea International Trade Association
PCSDL Won/m3
Price of Japanese larch sawnwood (size 3.9×5.1 cm×2.7 m) (2000~2011). Prices from 1988~1999 calculated from the producers price index(PPI) of rectangular sawnwood from Japanese red pine (2005=100)
Statistical yearbook of forestry
PLIM Import price index of log The Bank of Korea
CONT billion Won Amount of construction contracts Construction Association of Korea
464 韓國林學會誌 제103권 제3호 (2014)
을 이용하였다.
제재목 수급분석을 위하여 1988~2010년의 자료를 이용 하였는데, 각 방정식에 쓰인 변수는 다음과 같이 정리할 수 있다.
국내재를 이용한 침엽수 제재목 공급함수는 국내가격, 국내원목 가격, 수입재를 이용한 침엽수 제재목 가격으로 구성하였다. 국내가격은 소나무 제재목 가격을 이용하였
는데, 자료가 제공되지 않는 1988~1999년까지 가격은 육 송원목 생산자물가지수를 이용하여 계산한 값을 적용하 였다. 추정결과 상수항을 제외한 모든 변수가 통계적 유 의성을 가지는 것으로 나타났다. 국내재를 이용한 제재목 가격은 2% 수준에서 통계적 유의성을 가지는 것으로 분 석되었으며, 그 외의 각 변수들은 10% 수준에서 통계적 유의성을 가진다. 수입재를 이용하는 제재목 공급함수는 Table 2. Model for sawnwood.
Supply function – domestic log
ln(QCSD) = 7.682 + 1.363**ln(PCSDP) − 1.215*ln(PCLP) − 1.114*ln(PCSM) (1.110) (2.902) (-2.080) (-1.944)
R2 = 0.560 ρ1 = 0.319 Inverted AR Root = 0.32
Supply function – imported log
ln(QCSM) = 8.816** + 0.205ln(PCSM) − 0.336*ln(PLIM(-1)) − 0.844**DUM98 (11.887) (1.708) (-1.811) (-13.810)
R2 = 0.956 ρ1 = 0.195 Inverted AR Root = 0.20
Import demand function
ln(QCSIM) = -12.790 − 0.506log(PCSIM) + 1.843**ln(CONT) + 0.835ln(PCSM) (-2.25) (-1.427) (6.335) (1.596)
R2 = 0.797 ρ1 = 0.056 Inverted AR Root = 0.06
Demand function
ln(QSD) = 9.011** − 0.321ln(PCSDL) + 0.294*ln(CONT) − 0.553**DUM98 (2.383) (-1.577) (1.756) (-5.322)
R2 = 0.844 ρ1 = 0.485 Inverted AR Root = 0.49
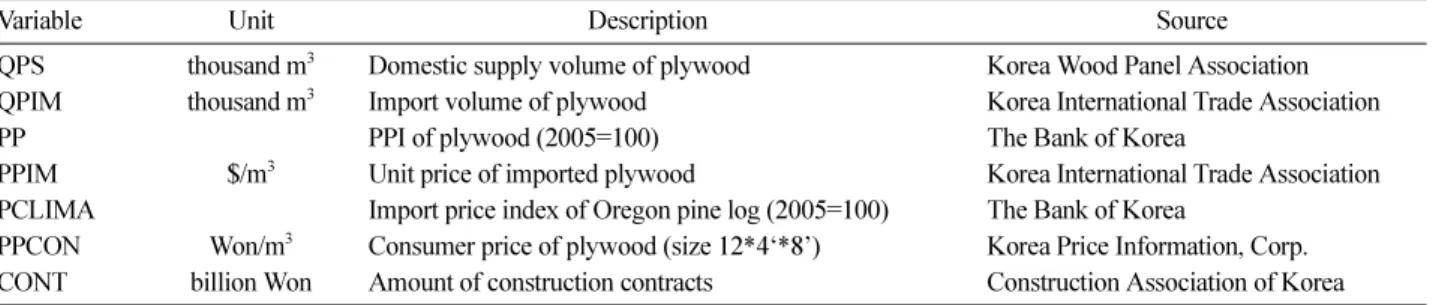
Table 3. Variables for plywood supply and demand functions.
Variable Unit Description Source
QPS thousand m3 Domestic supply volume of plywood Korea Wood Panel Association QPIM thousand m3 Import volume of plywood Korea International Trade Association
PP PPI of plywood (2005=100) The Bank of Korea
PPIM $/m3 Unit price of imported plywood Korea International Trade Association
PCLIMA Import price index of Oregon pine log (2005=100) The Bank of Korea
PPCON Won/m3 Consumer price of plywood (size 12*4‘*8’) Korea Price Information, Corp.
CONT billion Won Amount of construction contracts Construction Association of Korea
Table 4. Model for plywood.
Supply function
ln(QPS) = 8.414** + 0.451*(PP) − 0.866**ln(PCLIMA) (6.806) (1.598) (-4.126)
R2 = 0.718 ρ1 = 0.442 Inverted AR Roots = 0.44
Import demand function
ln(QPIM) = 12.93** − 1.333**ln(PPIM) + 0.883**ln(PP) + 0.624**ln(CONT) − 0.383**DUM98 (3.869) (-4.182) (2.642) (3.685) (-4.264)
R2 = 0.907 ρ1 = 0.779 Inverted AR Roots = 0.78
Demand function
ln(QPS+QPIM) = 4.290 – 0.592*ln(PPCON) + 0.967**ln(CONT) (1.194) (-2.051) (6.068)
R2 = 0.799 ρ1 = 0.577 Inverted AR Roots = 0.58
Table 5. Variables for particle board (PB) supply and demand functions.
Variable Unit Description Source
QBP thousand m3 Production volume of PB Statistical yearbook of forestry
QBPIM thousand m3 Import volume of PB Korea International Trade Association
QW thousand /m3 Supply volume of waste wood Statistical yearbook of forestry
PB Won/m3 PPI of PB (2005=100) The Bank of Korea
PBIM $/m3 Unit price of imported PB Korea International Trade Association
PBC20 Won/m3 Consumer price of PB Korea Price Information, Corp.
CONT billion Won Amount of construction contracts Construction Association of Korea
GDP billion Won Gross Domestic Product The Bank of Korea
Table 6. Model for particle board.
Supply function
ln(QBP) = -1.759 + 0.574ln(PB) + 0.755**ln(QW) + 0.101DUM97 (0.683) (0.151) (4.932) (1.287)
R2 = 0.948 ρ1 = 0.436 Inverted AR Roots = 0.44
Import demand function
ln(QBIM) = 8.192–1.494**ln(PBIM) + 1.544*ln(PB) + 0.794**ln(CONT) − 0.561**DUM98 (0.959) (-3.500) (1.968) (2.503) (-2.288)
R2 = 0.815 D-W = 2.175
Demand function
ln(QBP+QBIM) = -0.444**ln(PBC20) + 0.943**ln(GDP) − 0.448**DUM98 (-3.553) (8.098) (-3.073)
R2 = 0.858
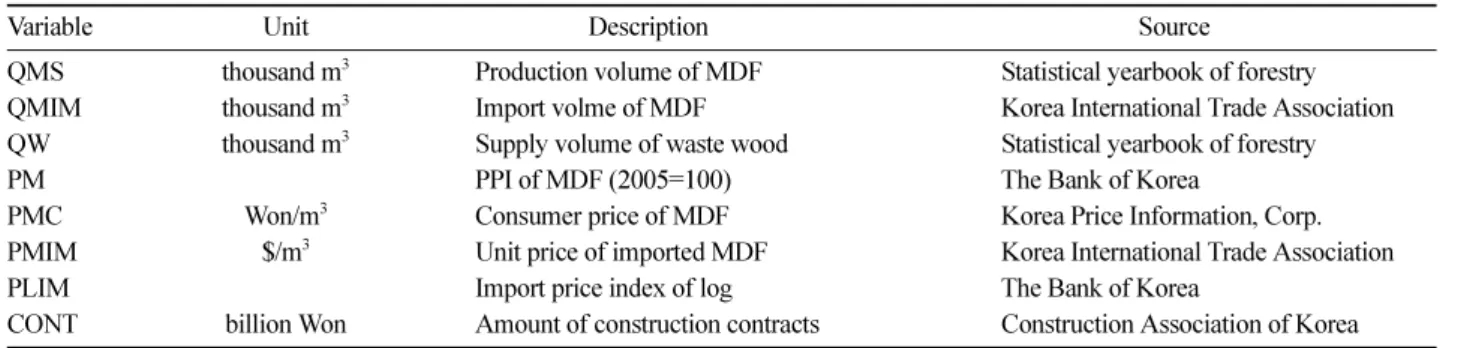
Table 7. Variables for medium density fiberboard (MDF) supply and demand functions.
Variable Unit Description Source
QMS thousand m3 Production volume of MDF Statistical yearbook of forestry
QMIM thousand m3 Import volme of MDF Korea International Trade Association
QW thousand m3 Supply volume of waste wood Statistical yearbook of forestry
PM PPI of MDF (2005=100) The Bank of Korea
PMC Won/m3 Consumer price of MDF Korea Price Information, Corp.
PMIM $/m3 Unit price of imported MDF Korea International Trade Association
PLIM Import price index of log The Bank of Korea
CONT billion Won Amount of construction contracts Construction Association of Korea
Table 8. Model for medium density fiberboard.
Supply function
ln(QMS) = -9.665 + 0.711ln(PM) − 0.380**ln(PLIM) + 1.710**ln(QW) + 0.227DUM98 + 0.310*ln(QMS(-1)) (-3.078) (1.676) (-2.739) (5.339) (1.332) (2.576)
R2 = 0.983 D-h = -1.3535
Import demand function
ln(QMIM) = 7.542 − 2.434**ln(PMIM) + 2.769**ln(PM) + 1.263*ln(CONT) + 0.355**ln(QMIM(-1)) (0.628) (-6.132) (2.218) (2.049) (2.585)
R2 = 0.856 D-h = 1.371
Demand function
ln(QMS+QMIM) = -1.414**ln(PMC) + 1.870**ln(GDP) − 0.523**DUM98 (-18.57) (25.415) (-3.020)
R2 = 0.966
466 韓國林學會誌 제103권 제3호 (2014)
가격, 전기 원목 수입가격, 그리고 더미변수로 구성하였다.
자체 가격은 미송 소할재 생산자물가지수를 활용하였으 며, 수입원목 가격은 수입가격지수를 이용하였다. 추정결 과 수입재를 이용한 제재목 가격은 약 15% 수준에서 통 계적으로 유의하며, 전기 원목의 수입가격은 10%에서 유 의한 것으로 나타났다. 1998년을 더미를 적용하였는데, 1997년 외환위기 이후 경기침체에 따른 생산량 감소를 반 영하기 위한 것이다. 제재목의 수입수요함수 추정을 위하 여 제재목 수입가격, 건설경기지표, 그리고 수입재를 이용 한 제재목 가격 등을 독립변수로는 이용하였다. 수입가격 은 단가를 적용하였으며, 건설경기지표로 건설공사계약액 을 이용하였다. 대체수요를 고려하기 위하여 국내에서 생 산되는 제재목을 대표할 수 있는 수입재를 이용하여 생산 한 제재목의 가격을 이용하였는데, 국내재를 이용한 제재 목보다 최근 10년간 생산량이 20배 이상 많기 때문이다.
추정결과 수입단가는 17%, 수입재 제재목 가격은 13% 수 준에서 통계적으로 유의성을 가지는 것으로 나타났다. 제 재목에 대한 수요함수 추정을 위하여 총수요량에 대해 국 내재(낙엽송)를 이용한 제재목 가격을 적용하였다.
여기서 ln은 자연로그를 나타내며, 괄호 안의 숫자는 t- value를, 1은 1계 자기회귀모형의 자기상관계수를 나타낸 다. 즉 계열상관(Serial correlation)이 수정되지 않은 상태 에서 현기 오차항과 전기 오차항과의 상관계수를 나타내
는 것이다. 추정한 방정식이 정상성 조건(Stationary condition)을 만족하기 위해서는 위의 표에서와 같이 Eviews에서 제공하는 Inverted AR Roots가 1보다 작은 값 을 가져야 한다. **와 *은 5% 및 10% 수준에서 계수가 통계적으로 유의하다는 것을 나타낸다.
합판의 수급분석을 위해 사용한 변수는 다음과 같이 정 리된다.
합판의 공급함수는 가격과 수입원목 가격을 이용하여 추정하였다. 합판의 경우 국내에서 생산되는 원목을 거의 사용하지 않고 수입원목에 의존하여 생산하기 때문이다.
수입원목 가격으로 미송원목 수입가격지수를 이용하였다.
추정 결과 자체가격의 경우 약 15% 수준에서 통계적 유 의한 것으로 나타났다. 합판의 수입수요함수의 독립변수 는 수입액을 수입량으로 나눠서 도출한 수입단가(PPIM), 합판의 국내가격(PP), 그리고 건설경기를 나타내는 건설 공사계약액으로 구성하였다. 국내산 합판가격은 대체재 가격으로 포함되었으며, 건축용으로 많이 이용되는 현상 을 반영하기 위해 건설수주액을 이용하였다. 모든 변수에 대해 5% 이상 통계적으로 유의한 것으로 나타났으며, 수 입단가에 대해 탄력적인 것으로 분석되었다. 합판의 수요 함수는 보통합판 소비자가격과 건설공사계약액으로 구성 하였다. 상수항을 제외한 계수들이 10% 이상 수준에서 통 계적으로 유의한 것으로 나타났다.
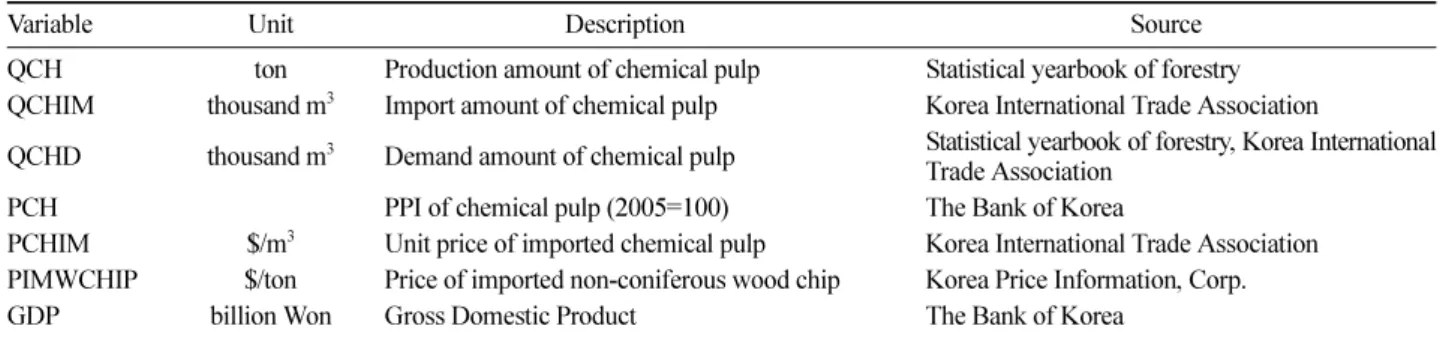
Table 9. Variables for chemical pulp supply and demand functions.
Variable Unit Description Source
QCH ton Production amount of chemical pulp Statistical yearbook of forestry QCHIM thousand m3 Import amount of chemical pulp Korea International Trade Association
QCHD thousand m3 Demand amount of chemical pulp Statistical yearbook of forestry, Korea International Trade Association
PCH PPI of chemical pulp (2005=100) The Bank of Korea
PCHIM $/m3 Unit price of imported chemical pulp Korea International Trade Association PIMWCHIP $/ton Price of imported non-coniferous wood chip Korea Price Information, Corp.
GDP billion Won Gross Domestic Product The Bank of Korea
Table 10. Model for chemical pulp.
Supply function
ln(QCH) = 17.68** + 0.219ln(PCH(-1)) − 0.505**ln(PIMWCHIP) + 0.127DUM97 (13.753) (1.678) (-5.257) (1.141)
R2 = 0.620 ρ1 = -0.562 Inverted AR Roots = -0.56
Import demand function
ln(QCHIM) = 15.045** − 0.151ln(PCHIM) + 0.550**ln(GDP) (7.766) (-1.654) (3.818)
R2 = 0.932 ρ1 = 0.573, ρ2 = 0.017 Inverted AR Roots = 0.60, -0.03 Demand function
ln(QCHD) = 14.970** − 0.136LOG(PCH) + 0.533**ln(GDP) (7.816) (-1.611) (3.751)
R2 = 0.931 ρ1 = 0.564, ρ2 = 0.018 Inverted AR Roots = 0.59, -0.03
파티클보드 공급과 수입수요, 수요함수에 포함된 변수 는 다음과 같이 정리된다.
파티클보드의 경우 특성상 폐재를 사용하여 생산한다 는 점에 착안하여 공급함수 추정에 있어 국내가격(PB)과 폐재사용량을 이용하였다. 가격의 경우 약 15% 수준에서 통계적으로 유의한 것으로 나타났으나, 폐재사용량은 1%
수준에서 유의한 것으로 분석되었다. 수입수요함수는 독 립변수로 수입단가, 국내산 파티클보드 가격, 건설공사계 약액, 그리고 98년 더미변수를 이용하여 추정하였다. 상 수항을 제외한 모든 변수가 10% 이상의 수준에서 통계적 으로 유의하다는 결과를 보인다. 수입단가와 국내산 파티 클보드의 수입단가에 대해 탄력적인 것으로 나타났다. 파 티클보드의 수요함수는 소비자가격과 국내총생산액, 98 년 더미변수로 구성하였다. 모든 계수가 5% 이상 수준에 서 통계적으로 유의하다는 결과가 나타났다.
섬유판 생산과 수입수요, 수요함수를 위해 이용된 변수 는 다음과 같다.
섬유판의 공급함수는 생산자물가지수, 원목 수입물가지 수, 폐재이용량, 98년 더미변수, 그리고 전기 섬유판 공급 량 등을 변수로 구성하였다. 생산자물가지수의 경우 계수 가 12% 수준에서 통계적으로 유의한 것으로 나타났다. 원 목 수입물가지수와 폐재이용량에 대해서는 5% 이상 수준 에서 유의한 것으로 분석되었다. 수입수요함수를 위해 수 입단가, 국내 생산자가격, 건설공사계약액, 전기 섬유판 수입량 등으로 독립변수를 구성하였다. 상수항 계수를 제 외한 모든 계수가 10% 이상 수준에서 통계적으로 유의하 게 나타났다. 섬유판 수입량은 수입단가, 대체재 가격인 국내산 가격 및 건설경기에 매우 탄력적인 것으로 분석되
었다. 수요함수는 소비자가격, 국내총생산액, 그리고 98년 을 나타내는 더미변수를 이용하여 추정하였다. 모든 계수 가 통계적으로 5% 이상 수준에서 유의한 것으로 나타났 으며, 가격과 국내총생산액에 상당히 탄력적인 것을 알 수 있다.
화학펄프 생산과 수입수요, 수요함수를 구성하는 변수 는 다음과 같다.
화학펄프의 공급은 전기 가격과 수입 활엽수 칩가격, 97 년 더미변수에 영향을 받는 것으로 가정하였다. 전기가격 추정계수의 경우 12% 수준에서 통계적으로 유의한 것으 로 나타났다. 수입수요의 경우 수입단가와 국내총생산액 을 독립변수로 설정하고, 2계 자기회귀모형을 적용하였다.
수입가격 계수는 약 12% 수준에서 통계적으로 유의한 것 으로 나타났다. 수요함수의 경우에도 수입수요함수와 마 찬가지로 자체가격과 국내총생산액을 독립변수로 도입하 였고, 2계 자기회귀모형을 적용하였다. 가격에 대해서는 약 13% 수준에서 통계적으로 유의한 것으로 나타났다.
결 과
1. 모형의 안정성 및 적합성 검토
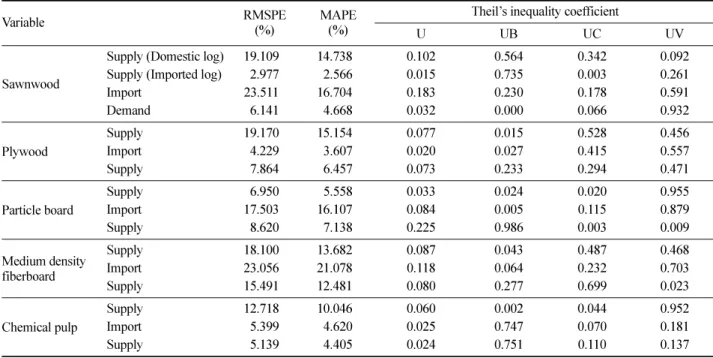
전망에 앞서 본 연구에서는 모형을 구성하는 방정식의 안정성과 모형의 적합성을 검정하기 위해 실측값(Yt)과 계측값(Yts)을 이용하는 평균자승근퍼센트오차(Root Mean Square Percent Error: RMSPE)와 절대백분율오차의평균 (Mean Absolute Percentage Error: MAPE), Theil의 불균 등계수(Theil’s inequlity coefficient) U 등의 검사를 실시 하였다. 여기서 Theil의 불균등계수는 편의비율(UB), 분산
Table 11. Stability test for the models.
Variable RMSPE
(%)
MAPE (%)
Theil’s inequality coefficient
U UB UC UV
Sawnwood
Supply (Domestic log) 19.109 14.738 0.102 0.564 0.342 0.092
Supply (Imported log) 2.977 2.566 0.015 0.735 0.003 0.261
Import 23.511 16.704 0.183 0.230 0.178 0.591
Demand 6.141 4.668 0.032 0.000 0.066 0.932
Plywood
Supply 19.170 15.154 0.077 0.015 0.528 0.456
Import 4.229 3.607 0.020 0.027 0.415 0.557
Supply 7.864 6.457 0.073 0.233 0.294 0.471
Particle board
Supply 6.950 5.558 0.033 0.024 0.020 0.955
Import 17.503 16.107 0.084 0.005 0.115 0.879
Supply 8.620 7.138 0.225 0.986 0.003 0.009
Medium density fiberboard
Supply 18.100 13.682 0.087 0.043 0.487 0.468
Import 23.056 21.078 0.118 0.064 0.232 0.703
Supply 15.491 12.481 0.080 0.277 0.699 0.023
Chemical pulp
Supply 12.718 10.046 0.060 0.002 0.044 0.952
Import 5.399 4.620 0.025 0.747 0.070 0.181
Supply 5.139 4.405 0.024 0.751 0.110 0.137
수급모형을 이용한 목제품 시장 전망 468
Table 12. Parameters for outlook. VariableDexcriptionValueMethod PCLPLog price of red pine (Won/m3)Annual increasing rate of 6.7%Average of annual increasing rate over recent 10 years PCSIMUnit price of imported coniferous sawnwood ($/m3)Annual increasing rate of 3.1%Average of annual increasing rate over recent 5 years PCLIMAImport price index of Oregon pine logAnnual increasing rate of 4.9%Average of annual increasing rate over recent 10 years CONTAmount of construction contracts (billion Won)Annual increasing rate of 1.4%Average of annual increasing rate over recent 5 years QNSDProduction volume of sawnwood from domestic non-coniferous log (thousand m3)14 thousand Average production volume over last 5 years QNSMProduction volume of sawnwood from imported non-coniferous log (thousand m3)210 thousand Average production volume over last 10 years QBSIMImport volume of non-coniferous sawnwood (thousand )286 thousand Average import volume over last 5 years PPIMUnit price of imported plywood ($/m3)Annual increasing rate of 2.6%Average of annual increasing rate over recent 5 years QWSupply volume of waste wood (thousand m3)Annual increasing rate of 0.4%Average of annual increasing rate over recent 5 years PBIMUnit price of imported PB ($/m3)Annual increasing rate of 2.0%Average of annual increasing rate recent 10 years PLIMImport price index of logAnnual increasing rate of 5.75%Average of annual increasing rate recent 10 years PMIMUnit price of imported MDF ($/m3)Annual increasing rate of 5.57%Average of annual increasing rate recent 10 years PCHIMUnit price of imported chemical pulp ($/kg)Annual increasing rate of 3.89%Average of annual increasing rate recent 10 years PIMWCHIPPrice of imported non-coniferous wood chip ($/ton)Annual increasing rate of 1.87%Average of annual increasing rate over recent 5 years QCHEXExport amount of chemical pulp (ton)15,662.9Average export amount over last 10 years QMEProduction amount of mechanical pulp (ton)106,353Average production weight over last 10 years QMEIMImport amount if mechanical pulp(ton)1,500Average import weight over last 5 years RGDPReal GDP (2005)2.92%Real increasing rate of GDP over recent 5 years GDPDFGDP deflator-Apply equation under this table GDPGDP (nominal)-Calculated with RGDP and GDPDF EXCHWon-dollar exchange rate (Won/$)1,126.88Average exchange rate in 2012 Equation: log(GDPDF) = -3.2532+0.57log(CPI) + 0.0403log(EXCH) + 0.3104log(RGDP)
비율(UC), 공분산비율(UV)의 편불균등계수(Partial inequality coefficient)등으로 분해하여 향후 추가적 정보 도입을 통 하여 오차를 줄일 수 있을지에 대해 판단하였다.1)
,
각 변수의 안정성 검사 결과는 Table 11과 같다. 국내재 를 이용한 제재목 공급, 제재목의 수입 등과 같은 변수의 RMSPE 값이 10%를 초과하는 것으로 나타나 모형의 안 전성이 다소 떨어지는 것으로 나타났다. 그러나 수입재를 이용한 제재목 공급을 비롯한 제재목 수요, 합판 수입, 합 판 수요 등의 변수는 RMSPE 값이 10% 미만으로 나타나 안정적인 것으로 판단할 수 있다. Theil의 불균등계수의 경우 통상적인 판단기준 0.1을 적용했을 때 제재목의 수 입이나 파티클보드 수요, 섬유판 수입 변수가 안정적이지 못한 결과로 도출되었다. 파티클보드 수요의 경우 편의비 율이 높게 나타나므로 실제치와 추정치의 평균이 차이나 는 것을 알 수 있다. 나머지 두 개의 변수는 공분산비율 (UC)이 각각 59%, 70%로 추가적인 정보에 의해서도 모형 개선이 쉽지 않을 것으로 판단된다. 그러나 이 두 개의 변 수를 제외한 나머지 변수들은 U 값이 0.1 이내로 도출되 어 안정적인 것으로 나타났다.
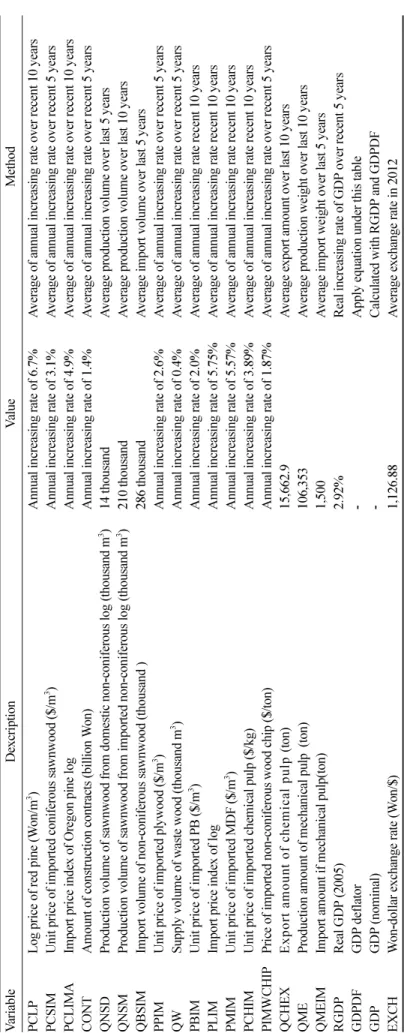
2. 외생변수 분석
모형을 이용하여 미래의 목제품 시장을 전망하기 위해 외생변수를 설정해야 한다. 베이스라인(Base line) 전망을 위해 다음의 Table 12와 같이 외생변수를 주어진 것으로 간주하였다. 최근 5년간 또는 10년간 연평균 증감률을 계 산하여 적절하다고 판단되는 수준의 값을 선택하였다. 원 목 또는 목제품 가격의 경우 지구 환경보호와 이산화탄소 문제로 인해 지속적으로 상승할 것으로 가정하였다. 계산 한 증감률이 현실적이지 않다고 판단되는 경우에는 최근 5년간 또는 10년간의 생산량 또는 수입량의 평균을 적용 하였다. GDP 디플레이트를 계산하기 위해서 표 아래에 설명된 추정식을 사용하였다. 소비자물가지수(CPI)에 대 해서는 연간 상승률 3%를 적용하였으며, 실질국내총생산
액(RGDP)의 경우 국내총생산 실질성장률의 최근 5년간 평균값을 적용하여 계산하였다. 대미환율은 1,126.88원/
$(2012년 평균)의 고정된 값을 적용하였다.
3. 주요 목제품 수급전망 1) 제재목 및 합판 수급 전망
국내재를 이용하거나 수입재를 이용하거나 제재목 공 급은 모두 감소하는 것으로 나타났다. 수입 또한 감소하 여 총 공급량은 연간 1.6% 감소하는 것으로 나타났다. 그 결과 2010년 5,210천 m3 이던 공급량이 2050년에는 2,712천 m3로 감소할 것으로 전망된다. 수입재에 의존하 던 합판의 경우에도 국내 공급과 수입이 모두 감소하면서 연간 1.1% 정도 공급이 감소하는 것으로 나타났다.
2) 파티클보드, 섬유판, 화학펄프 수급전망
폐재를 이용하는 파티클보드의 경우 공급과 수입이 모 두 증가하면서 연간 1.8%의 증가율을 나타내는 것으로 분 석되었고, 섬유판의 경우 수입원목의 가격과 수입가격이 연간 5% 이상 상승하면서 국내 공급과 수입이 모두 감소 하는 것으로 나타났다. 화학펄프의 경우 국내 공급과 수 입이 모두 늘어나면서 총 공급이 연간 1.4%의 증가율을 나타냈다.
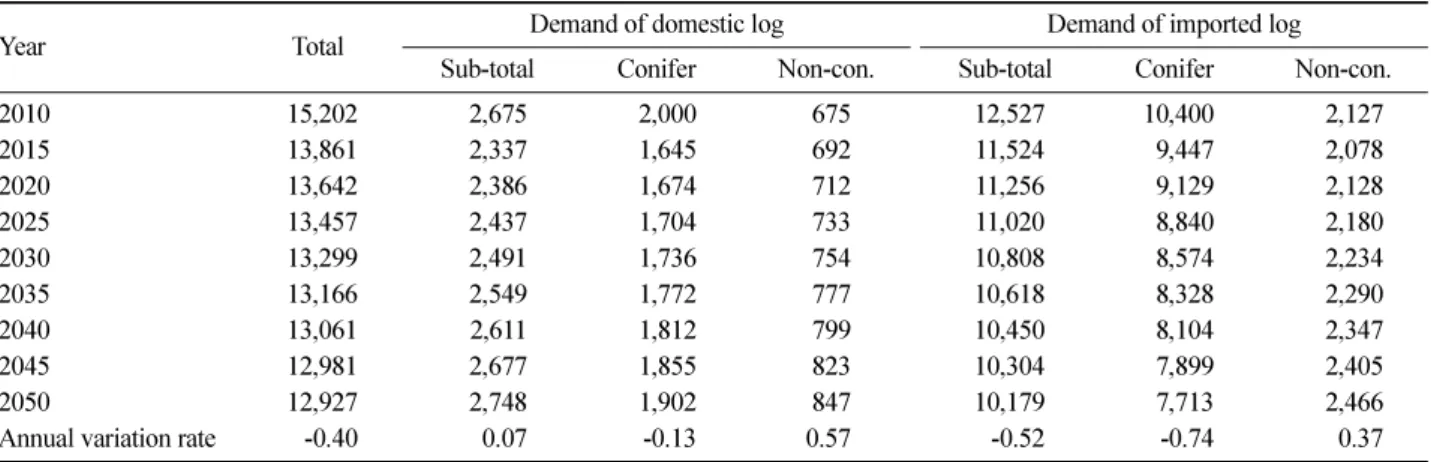
4. 원목 수요전망
목제품시장의 변화에 따른 원목 수요량을 계산하였는 데, 목제품을 원목으로 환산하기 위하여 글로벌팀벌2)에서 제공하는 원목환산계수(Roundwood equivalent volume:
RWE volume)를 이용하였다. 펄프의 경우 1톤당 필요한 원목의 부피(m3)를 나타내고, 나머지는 제품 부피(m3)당 필요한 원목의 부피(m3)를 나타낸다.
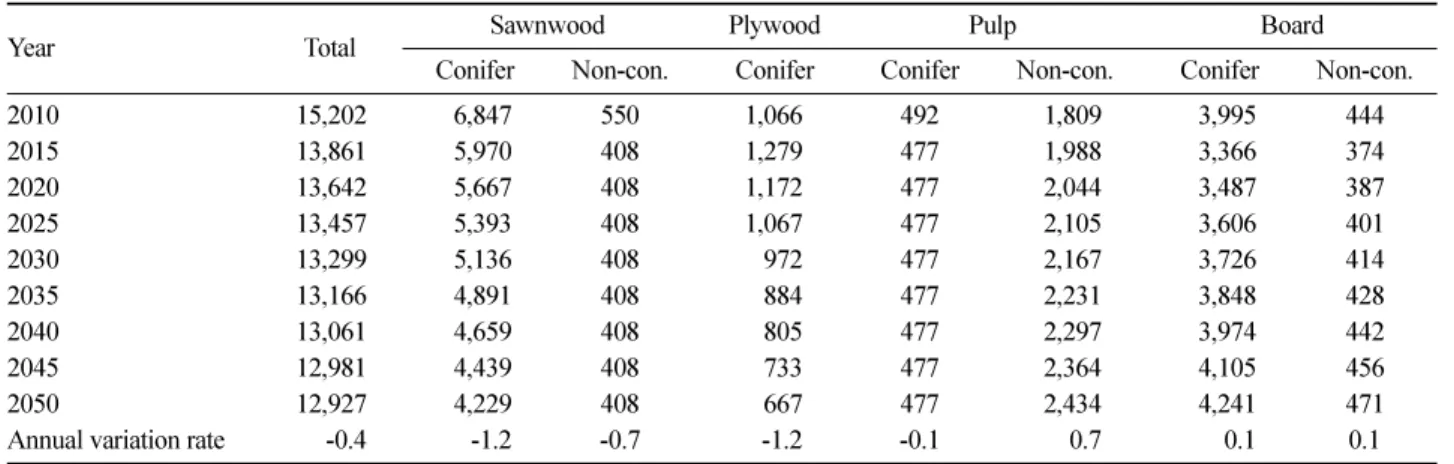
수요량 계산을 위한 기본 가정은 다음과 같다. 파티클 보드와 섬유판 생산을 위해 투입된 침엽수의 비율을 90%
로 가정하였고, 파티클보드와 섬유판 생산을 위해 투입된 국내재의 비율은 40%로 가정하였다.3) 기계펄프 생산을 위 한 국내재 투입비율은 26%로 가정 하였다.4) 수입 합판의 침엽수 비중은 86%로 가정, 수입 파티클보드의 침엽수 비 중은 19%로 가정, 수입 섬유판의 침엽수 비중은 85%로 가정, 수입 제재목의 침엽수 비중은 72%로 가정하였다.
계수와 가정을 적용하여 국내에서 생산되었거나 생산 될 목제품을 원목으로 환산하면, 향후 40년 동안 국내산 원목의 수요량은 연간 0.07% 증가하는 것으로 예상된다.
UB
Yts–Yta
⎝ ⎠
⎛ ⎞2
1
n--- (Yts–Yta)2
t 1=
∑n
--- U, V (sts–sta)2 1
n--- (Yts–Yta)2
t 1–
∑n
---
= =
UC 2 1( –ρsa)ss×sa 1
n--- (Yts–Yta)2
t 1=
∑n
---
=
1)Lee et al. (2012).
2)http://www.globaltimber.org.uk.
3)2001~2011년까지 용도별 목재 및 목제품 국내비중을 적용하여 도출한 비율.
4)한국무역협회 통계. 2006~2010년 평균값을 적용하였는데, HSK 코드로 침·활엽수 구분이 불가능하므로 국가별로 구분한다.
즉, 동남아시아, 아프리카, 중남미 등지에서 수입될 경우 활엽수로, 나머지 국가에서 수입될 경우 침엽수로 가정한다.
470 韓國林學會誌 제103권 제3호 (2014)
Table 13. Outlook results of sawnwood and plywood. Unit: thousand m3, %
Year Sawnwood
total
Sawnwood production (Domestic log))
Sawnwood production (Imported log))
Sawnwood import
Plywood total
Plywood supply
Plywood import
2010 5,210 164 3,936 1110 1,715 463 1,252
2015 4,044 105 3,470 469 1,618 556 1,061
2020 3,801 93 3,300 408 1,534 509 1,025
2025 3,588 82 3,147 358 1,451 464 987
2030 3,390 73 3,002 314 1,371 422 948
2035 3,204 65 2,864 275 1,296 384 911
2040 3,030 59 2,731 240 1,224 350 874
2045 2,866 53 2,605 208 1,158 319 839
2050 2,712 49 2,484 179 1,095 290 805
Annual variation rate -1.62 -3.00 -1.14 -4.46 -1.12 -1.16 -1.10
Table 14. Outlook results of PB, MDF, chemical pulp. Unit: thousand m3, thousand ton, % Year PB total PB production PB import MDF total MDF production MDF import CP total CP production CP import
2010 1,725 919 806 1,918 1,751 167 2,919 402 2,517
2015 1,871 982 889 1,505 1,314 191 3,258 442 2,817
2020 2,047 1,044 1,002 1,470 1,340 130 3,479 454 3,025
2025 2,239 1,111 1,128 1,450 1,362 87 3,709 468 3,242
2030 2,450 1,181 1,269 1,441 1,381 60 3,956 482 3,474
2035 2,683 1,256 1,428 1,440 1,399 42 4,219 496 3,723
2040 2,940 1,334 1,605 1,445 1,415 30 4,501 510 3,991
2045 3,222 1,418 1,804 1,454 1,431 23 4,803 525 4,277
2050 3,533 1,506 2,028 1,465 1,447 18 5,125 541 4,585
Annual variation rate 1.81 1.24 2.33 -0.67 -0.48 -5.36 1.42 0.74 1.51
Table 15. Roundwood equivalent volume of wood products.
Unit: m3/m3, m3/ton
Product RWE Product RWE
Coniferous sawnwood 1.67 PB 1.4
Non-coniferous sawnwood 1.82 MDF 1.8
Import plywood 2.3 Pulp 4.5
Source: http:://www.globaltimber.or.uk.
Table 16. Outlook of log volume demand for wood products by origins and species. Unit: thousand m3, %
Year Total Demand of domestic log Demand of imported log
Sub-total Conifer Non-con. Sub-total Conifer Non-con.
2010 15,202 2,675 2,000 675 12,527 10,400 2,127
2015 13,861 2,337 1,645 692 11,524 9,447 2,078
2020 13,642 2,386 1,674 712 11,256 9,129 2,128
2025 13,457 2,437 1,704 733 11,020 8,840 2,180
2030 13,299 2,491 1,736 754 10,808 8,574 2,234
2035 13,166 2,549 1,772 777 10,618 8,328 2,290
2040 13,061 2,611 1,812 799 10,450 8,104 2,347
2045 12,981 2,677 1,855 823 10,304 7,899 2,405
2050 12,927 2,748 1,902 847 10,179 7,713 2,466
Annual variation rate -0.40 0.07 -0.13 0.57 -0.52 -0.74 0.37
Table 17. Roundwood equivalent volume of imported wood products. Unit: thousand m3, %
Year Total Confer Non-conifer
2010 17,854 4,801 13,052
2015 18,015 3,419 14,596
2020 18,813 3,180 15,633
2025 19,721 2,992 16,729
2030 20,752 2,,837 17,915
2035 21,911 2,712 19,199
2040 23,199 2,610 20,589
2045 24,619 2,528 22,091
2050 26,179 2,465 23,715
Annual variation rate 0.96 -1.65 1.50