DOI:10.5229/JKES.2010.13.4.240
− 240 −
Comparison of Catalytic Activity for Methanol Electrooxidation Between Pt/PPy/CNT and Pt/C
C.-G. Lee*, J.-S. Baek, D.-J. Seo
†, J.-H. Park
††, and K.-Y. Chun
†††Dept. of Chemical Engineering, Hanbat National University, San 16-1, Dukmyung-dong, Yuseong-gu, Daejeon 305-719, Korea
†
R&D Center, LS Cable, 555 Hogye-dong, Dongan-gu, Anyang 431-080, Korea
††
Advanced Technology R&D Center, 911, Jeongja-1 dong, Jangan-gu, Suwon 440-301, Korea
†††
School of Mechanical Engineering, Sungkyunkwan University, Suwon 440-746, Korea
(Received June 24, 2010 : Accepted July 17, 2010)
Abstract : This work explored the catalytic effect of Pt in multi-wall carbon nanotube and poly-pyrrole conductive polymer electrocatalysts (Pt/PPy/MWCNT). A home-made Pt/PPy/MWCNT catalyst was first evaluated by comparing its electrochemical active surface area (ESA) with E-Tek commercial catalysts by cyclic voltammetry in H
2SO
4solution. Then, the methanol oxidation currents of Pt/PPy/MWCNT and the hydrogen peaks in H
2SO
4solution were serially measured with microporous electrode. This provided the current density of methanol oxidation based on the ESA, allowing a quantitative comparison of catalytic activity. The current densities were also measured for Pt/C catalysts of E-Tek and Tanaka Precious Metal Co. The current densities for the different catalysts were similar, implying that catalytic activity depended directly on the ESA rather than charge transfer or electronic conductivity.
Keywords : Catalytic activity, Poly pyrrole, Carbon nanotube, Methanol electrooxidation, Electro- chemical active surface area
1. Introduction
Alcohol is a hydrocarbon which is liquid under normal conditions with a high energy density. It exists in a number of forms, with different numbers of C-H bonds depending on the carbon numbers, and this complexity in molecular structure brings about difficulties in the direct electrochemical oxidation to CO
2. For the electro-oxidation of alcohols, Pt has generally the highest catalytic activity [1]. Depending on alcohol species, various Pt alloy materials have been employed .
2)Methanol, having the simplest molecular structure, shows the highest reactivity among the various alcohols. During methanol oxidation, CO is adsorbed on the Pt surface and this obstructs further oxidation of CO. It has been suggested that this
poisoning effect can be reduced with Pt-Ru alloy metal through the well known bi-functional mechanism .
3)The strong OH adsorptivity of Ru supplies oxygen species to the CO-covered Pt, then CO is oxidized to CO
2.
Recently, carbon nanotubes (CNTs) were reported to be superior supporting materials compared to carbon black for methanol electro-oxidation .
4-9)It was also suggested that the conducting polymer enhances the charge transfer rate at the electrode and electrolyte interface .
10)Carbon and conducting polymer composite materials provide three-dimensional distributions of Pt particles, leading to enhancement in catalytic activity from the increased electrochemical active surface area (ESA), enhanced charge transfer rate and electronic conductivity .
11-16)In particular, pyrroles dope metal anions to compensate for electrical neutralization during its polymerization.
11)So,
*E-mail: [email protected]
Pt can be doped in the poly-pyrrole (PPy) to provide sufficient stability in air, high electrical conductivity, and commercial availability. Combining the multi-wall CNT and PPy as a conducting polymer has been reported to increase the methanol oxidation activity of Pt and Pt- Ru.
12,13,16)However, the carbon-supported Pt and Pt alloy catalysts are deposited on porous shaped carbon supports with large active surface areas. To evaluate the catalytic performance, the porous catalyst is generally mixed with Nafion monomer binder and the mixture is printed onto a plain electrode surface. Therefore, the activity of the porous catalysts is affected by binder dispersion. In this work, we employed a non-binding evaluation method for the porous catalyst.
The porous catalyst (Pt/PPy/MWCNT) was prepared by Pt dispersion in a poly-pyrrole film on multi-wall CNTs.
Then, the catalytic activity in methanol electro-oxidation was measured based on the ESA and compared with home-made Pt/PPy/MWCNT and Pt/C of E-Tek and Tanaka Precious Metal Co.
2. Experimental
The activity of home-made porous Pt/PPy/MWCNT electro-catalysts was compared with that of commercial Pt/C catalysts. As-received Pt/C from Tanaka precious metal and E-Tek were employed. The Pt/PPy/MWCNT material was prepared as follows: 1 g of multi-wall CNT, supplied by Iljin Nanotech, Korea, was dispersed in 300 mL and 0.02 M TritonX-100 surfactants, and then 100 mL of 0.25 M Pyrrole (Aldrich Co.) was added to the CNT solution. After full agitation, 100 mL of 0.1 M H
2PtCl
6and 10 mL of 0.5 M ammonium-persulfate (APS, [NH
4]
2S
2O
8) as an oxidant was added to the solution.
During these processes, the temperature of the solution was maintained around 5
oC. Then Pt nanoparticles were obtained by the reduction of Pt containing solutions with 0.5 M NaBH
4and then washed by ethanol solution.
ESA of the Pt/PPy/MWCNT material per Pt unit mass was measured. At first, the Pt/PPy/MWCNT materials of 9.2 mg and 4.6 mg were dispersed in a 3.3 ml of 40 vol.%
ethanol solutions, respectively. Then, a small amount, ca.
0.02 mL, of the solutions was dripped onto gold flag electrodes which were disk shape with 5 mm diameter and 0.1 mm thickness. The gold electrodes were dried at 50
oC for 4 hrs. Finally they were coated by Pt/PPy/MWCNT and Pt loadings on the gold were 33.5 µ g and 16.7 µ g, respectively. ESA was measured in 0.5 M H
2SO
4solution from the size of the charge in hydrogen peaks obtained by cyclic voltammetry.
The activity of the porous catalyst was evaluated with a microporous electrode.
17)It formed a cavity of ca. 50 micron diameter and ca. 10 micron depth. The electrocatalysts were then filled in the cavity, which served as a working electrode. Cyclic voltammetry (CV) was employed in this work. The solution was 1 M MeOH (Methanol) with 0.5 M H
2SO
4. The counter electrode was a Pt mesh and the reference electrode was Ag/AgCl. A three-compartment glass cell was employed. The cell was a gas-tight structure and the cell temperature was controlled in the range 25
oC to 80
oC. To evaluate the catalytic activity versus ESA, we measured ESA of the microporous electrode by CV in H
2SO
4solution after the MeOH oxidation experiment.
3. Results and Discussion
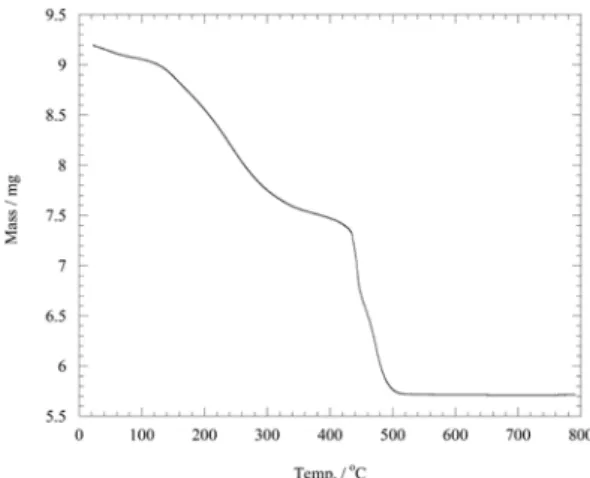
Fig. 1 shows a thermo-gravimetric result for 60 wt.%
Pt/PPy/MWCNT. The analysis was carried out with a TGA
Fig. 1. Thermogravimetric analysis of Pt/PPy/MWCNT
(Pt 60 wt.%) at 10
oC/min in air condition.
(TA Instruments, Model 2960 SDT) and the temperature increase was 10
oC · min
−1up to 800
oC in air. The organic materials PPy and CNT were completely decomposed over 500
oC and 60 wt% of Pt loading was obtained. Varying the ratio of CNT to H
2PtCl
6led to 27.5, 60.0, 85.3 wt.% Pt samples.
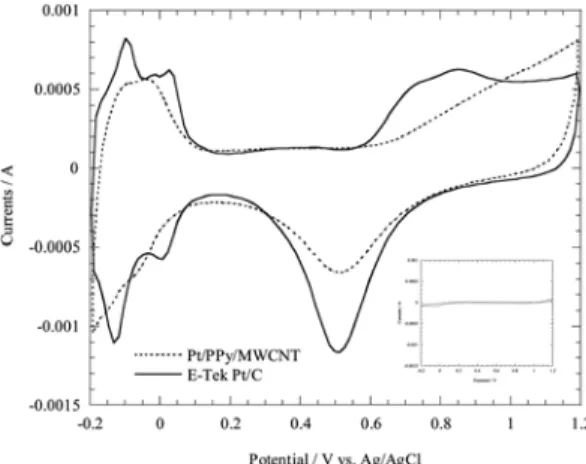
Fig. 2 shows cyclic voltammograms of E-Tek Pt/C electrocatalysts (Pt 60 wt.%) and Pt/PPy/MWCNT (Pt 60 wt%) with the same amount of Pt, i.e. 16.7 µ g at room temperature. The insert of Fig. 2 is a cyclic voltammogram of the gold flag electrode in a H
2SO
4solution. It indicates that gold does not have hydrogen adsorption/desorption peaks and shows very small amounts of charging currents on the electrode surface. E-Tek Pt/C electrocatalyst shows typical hydrogen peaks of Pt crystal surfaces around 0 V vs. Ag/AgCl with a charge of 1,310 µ C. Since the charge density of monolayer H adsorption on Pt is 210 µ C/cm
218)
, the E-Tek Pt/C electrocatalyst has about 6.2 cm
2of ESA. The relatively large currents around 0.2 V vs. Ag/
AgCl compared with a gold electrode are due to charging currents on the carbon and Pt surfaces. Fig. 2 also contains a CV result for Pt/PPy/MWCNT. Hydrogen peaks at the electrode are not clear because the Pt crystal surfaces may be covered by PPy. The unclean Pt surfaces also brought about an insignificant oxidation current around 0.8 V vs. Ag/AgCl and subsequently small reductions in
current around 0.5 V vs. Ag/AgCl were obtained. The charge corresponding to the hydrogen peaks is about 880 µ C, thus its ESA is about 4.2 cm
2. The relatively large charging currents of Pt/PPy/MWCNT at 0.2 V vs.
Ag/AgCl indicates a larger conductive surface area of the electrode compared with the E-Tek electrocatalyst.
Fig. 3 compares ESAs of E-Tek Pt/C and home-made Pt/PPy/MWCNT obtained from the hydrogen peak charges at the same Pt loadings of 16.7 and 33.5 mg on the gold flag electrode. The home-made Pt/PPy/MWCNT catalyst had less ESA than the E-Tek Pt/C catalysts as shown in the figure. This result is inconsistent with a previous work
11)because Pt in PPy is generally dispersed three dimensionally, thus providing a large active surface area. Agglomeration of Pt seems to be a major reason for the small active surface area of the Pt/PPy/MWCNT.
Fig. 4 shows a high-resolution transmission electron microscopy (HR-TEM) image of Pt/PPy/MWCNT. The diameter of MWCNTs are about 5 nm, which exist in the state of entanglement. Because MWCNTs are not bundle due to their weak Van der Waals force between nanotubes, it was found that the PPy wrapped the many sidewalls of MWCNTs simultaneously, as shown in the figure. The nano-Pt particles with a size of 1~3 nm are adsorbed on the sidewalls of functionalized MWCNTs by PPy.
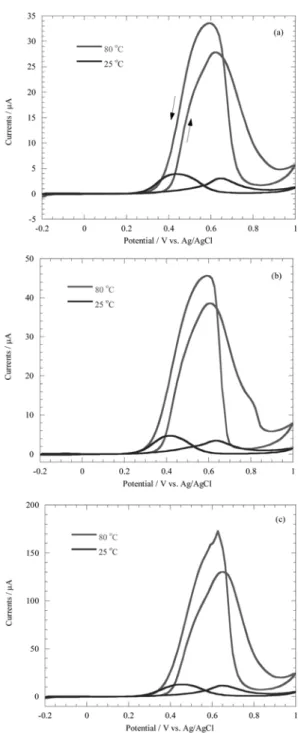
Fig. 5 shows cyclic voltammograms of methanol
Fig. 2. Cyclic voltammograms of E-Tek Pt/C (Pt 60 wt%) (line) and Pt/PPy/MWCNT (Pt 60 wt%) (dot line) at 25
oC, scan rate = 0.1 V/s in 0.5 M H
2SO
4.
Fig. 3. Comparisons of electrochemical active surface area
of E-Tek and home-made Pt/PPy/MWCNT by H
2peak of
Fig. 2.
oxidation with: (a) E-Tek Pt 60.0 wt%; (b) Tanaka Co. Pt 45.9 wt%; and (c) home-made Pt/PPy/MWCNT 60.0 wt%
and microporous electrode. Since the E-tek and Tanaka Pt/C electrocatalysts dispersed Pt on the carbon powder and home-made Pt/PPy/MWCNT also did on the PPy coated CNT, these catalysts in the microporous electrode behaves as a porous catalyst. As a characteristic feature of methanol oxidation, only oxidation currents are observed in positive and negative voltage scans. During the positive voltage scan, methanol is oxidized to CO and CO
2, and the surface is gradually covered by hydroxide from adsorptive dissociation of water over the potential 0.6 V vs. Ag/AgCl. Around 0.9 V vs. Ag/AgCl, the surface is fully covered by hydroxide from water decomposition.
The negative voltage scan reduces the hydroxide covering the surface, then the adsorbed methanol and reaction intermediates are re-oxidized again. The methanol oxidation processes prevail over the entire temperature range, thus oxidation and re-oxidation peaks are observed.
Much higher oxidation currents are obtained at 80
oC, indicating that methanol oxidation is activated by increases in temperature. In addition, the facilitated reactions at higher temperature make the peak potentials for oxidation and re-oxidation occur closer together.
Another point to be noted is that a larger re-oxidation
peak shows that Pt is readily poisoned by reaction intermediates.
Fig. 5. Cyclic voltammograms of methanol oxidation with (a) E-Tek Pt/C (Pt 60 wt%), (b) Tanaka Pt/C (Pt 45.9 wt%), (c) home-made Pt/PPy/MWCNT (Pt 60 wt%) and microporous electrode at 25
oC and 80
oC, scan rate = 0.1 V/s in 1 M MeOH + 0.5 M H
2SO
4solution.
Fig. 4. TEM image of Pt/PPy/MWCNT (Pt 60 wt%).
Differences in the values of the current reflect the catalytic activity of the electrocatalysts. The catalytic activity was evaluated from the oxidation current densities based on active surface area. The active surface area of the electrocatalysts in the microporous electrode was measured by CV methods in H
2SO
4solution after oxidation in methanol solution.
Fig. 6 shows the CV results normalized by ESA at room temperature in H
2SO
4solution. The electrocatalysts show their own hydrogen peaks according to their crystal surfaces during the CV measurements. Except for the hydrogen peaks, the electrocatalysts show very similar voltammograms. In particular, home-made Pt/PPy/MWCNT in a microporous electrode shows a very clean voltam- mogram unlike Fig. 2. The microporous electrode used about
1/1000 the amount of Pt catalyst compared with that used for Fig. 2. It appears that clean crystal surfaces of Pt can be obtained with very small amounts of Pt/PPy/MWCNT.
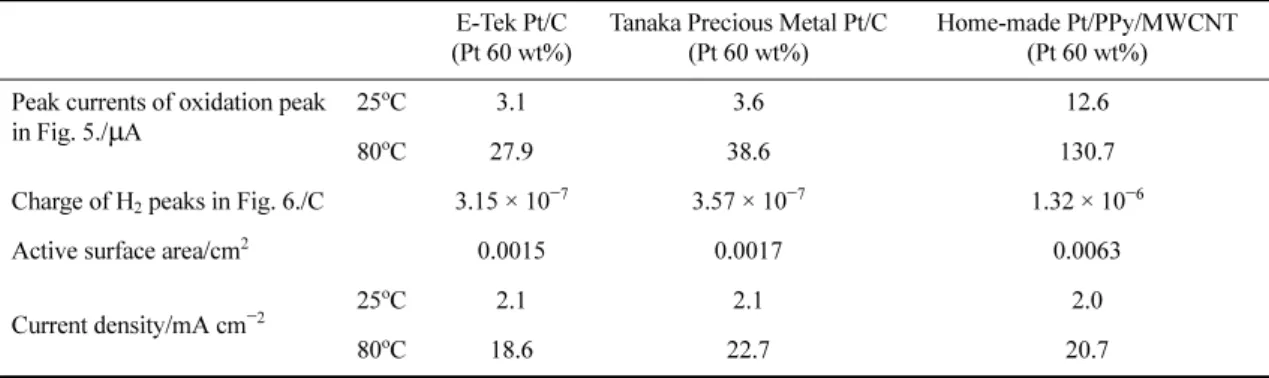
Table 1 summarizes the active surface areas and peak current densities of methanol oxidation obtained during positive voltage scans. The current densities represent normalized activity of the electrocatalysts in methanol oxidation, indicating that there are insignificant differences in activity based on ESA among the electrocatalysts. This implies that most of the catalytic activity enhancement obtained with poly-pyrrole in a methanol oxidation results from the enlarged ESA rather than from charge transfer or electronic conductivity enhancement.
4. Conclusion
The electrocatalytic effects of poly-pyrrole (PPy) and multi-wall carbon nanotube (MWCNT) on Pt supporting material have been investigated in the electro-oxidation of methanol. This was done by comparing the current densities of microporous electrodes with home-made Pt/PPy/MWCNT (Pt 60 wt%), E-Tek Pt/C (Pt 60 wt%), and Tanaka Precious Metal Pt/C (Pt 45.9 wt%). The current density was obtained from the active surface area of Pt measured from the H
2peaks in cyclic voltammogram in H
2SO
4solution after methanol oxidation. The current density of Pt/PPy/MWCNT was very similar to other commercial material, indicating that the catalytic effects of PPy and MWCNT are mostly due to the enlarged active surface area rather than charge transfer or electronic conductivity enhancements.
Fig. 6. Cyclic voltammograms of microporous electrodes with E-Tek Pt/C (Pt 60 wt%), Tanaka Pt/C (Pt 45.9 wt%), and Pt/PPy/MWCNT (Pt 60 wt%) after Fig. 5 at 25
oC, scan rate = 0.1 V/s in 0.5 M H
2SO
4solution.
Table 1. Comparisons of current densities of oxidation peaks of MeOH oxidation in Figs. 5 with active surface area of electrodes from Figs. 6.
E-Tek Pt/C (Pt 60 wt%)
Tanaka Precious Metal Pt/C (Pt 60 wt%)
Home-made Pt/PPy/MWCNT (Pt 60 wt%) Peak currents of oxidation peak
in Fig. 5./ µ A 25
o