Microstructural Study of Creep-Fatigue Crack Propagation for Sn-3.0Ag-0.5Cu Lead-Free Solder
Tae Wuk Woo
1,†, Masao Sakane
2, Kaoru Kobayashi
3, Hyun Chul Park
1and Kwang Soo Kim
11
Department of Mechanical Engineering, Pohang University of Science and Technology, San 31, Hyoja-dong, Nam-gu, Pohang, Kyungbuk 790-784, Korea
2
Department of Mechanical Engineering, Faculty of Science and Engineering, Ritsumeikan University, 1-1-1 Nojihigashi, Kusatsu-shi, Shiga 525-8577, Japan
3
Advanced Packaging Laboratory, Kyocera SLC Technologies Corporation, 656 Ichimiyake, Yasu-shi, Shiga 520-2362, Japan (Received August 27, 2010: Accepted September 14, 2010)
Abstract: Crack propagation mechanisms of Sn-3.0Ag-0.5Cu solder were studied in strain controlled push-pull creep- fatigue conditions using the fast-fast (pp) and the slow-fast (cp) strain waveforms at 313 K. Transgranular cracking was found in the pp strain waveform which led to the cycle-dominant crack propagation and intergranular cracking in the cp strain waveform that led to the time-dominant crack propagation. The time-dominant crack propagation rate was faster than the cycle-dominant crack propagation rate when compared with J-integral range which resulted from the creep damage at the crack tip in the cp strain waveform. Clear recrystallization around the crack was found in the pp and the cp strain waveforms, but the recrystallized grain size in the cp strain waveform was smaller than that in the pp strain waveform.
The cycle-dominant crack propagated in the normal direction to the specimen axis macroscopically, but the time-dominant crack propagated in the shear direction which was discussed in relation with shear micro cracks formed at the crack tip.
Keywords: Crack propagation, Fracture mechanism, Micro crack, Recrystallization, Lead-free solder
1. Introduction
Solders have been widely used as joining materials in electronic packaging for their low melting temperature, good mechanical properties and good wettability. Solder joints undergo low cycle fatigue damage caused by the cyclic temperature variation attributed to the mismatch of the coefficients of thermal expansion of joining materials. Solders also undergo creep damage when solder joints are exposed at constant temperatures, because of their high homologous temperatures. Therefore, creep-fatigue damage occurs in solder joints and creep-fatigue damage mechanisms should be studied for the quality assurance of solder joints.
1-2)Since the use of lead solders has been strictly restricted by the RoHS and WEEE legislation in recent years, a large number of studies have been performed for seeking the most suitable lead-free solders for electronic packaging.
3-9)Sn-Ag-Cu solders appear to be the most potential solders as a replacement for lead solders.
Low cycle fatigue life of solders is dominated by crack propagation period
10-11), so studying the crack propagation mechanism that directly relates to the fatigue lifetime of solder joints is essential. Most studies of low cycle fatigue
of solders, however, focused on the low cycle fatigue life prediction model, the effects of strain rate, strain range, stress ratio, temperature, etc.
4, 12-14)In addition to this, studies of the creep of solders have been focused on the creep rupture lifetime and the microstructural observation of the fracture surface.
15-18)Only a limited number of studies have been reported the crack propagation mechanisms of lead-free solders and especially, little study discusses the crack propagation mechanism in Sn-3.0Ag-0.5Cu solder that has been the most frequently used lead-free solder.
In this study, the microstructural mechanisms that relate to the crack propagation of Sn-3.0Ag-0.5Cu solder are investigated under creep-fatigue conditions. Strain controlled push-pull crack propagation tests were performed using the fast-fast (pp) and the slow-fast (cp) strain waveforms at 313 K.
The relationship between the crack propagation behavior, the cracking direction and the microstructure change observed by a scanning electron microscopy (SEM) and an electron back- scatter pattern (EBSP) technique is discussed.
2. Experimental Procedure
The material used in this study was Sn-3.0Ag-0.5Cu lead-
†
Corresponding author
E-mail: [email protected]
free solder. The chemical composition of the solder is tabulated in Table 1. The solder was cast to solid round bars with 50 mm in diameter and 200 mm in length at 600 K using a stainless steel mold. 19) The round bars were machined to center-cracked-plate specimens whose shape and dimensions are illustrated in Fig. 1. The specimen was annealed at 0.87T m
(428 K) for 1 hour to stabilize the microstructure of the solder before testing, where T m is the absolute melting temperature of the solder. 19)
An electric-servo hydraulic machine with a 50 kN load capacity was used to perform strain controlled creep-fatigue crack propagation tests at 313 K. The specimen was heated by two band heaters wrapped around the lower and upper pull rods. The variation of temperature during the test was within ± 0.5 K. Crack length was measured by a charge- coupled device (CCD) camera with a resolution of 5 µ m.
The crack length (2a) is defined as the length including the initial notch length as shown in Fig. 2.
Figure 3 shows the two types of strain waveforms used in creep-fatigue crack propagation tests. They were the fast- fast (pp) and the slow-fast (cp) strain waveforms. In the pp
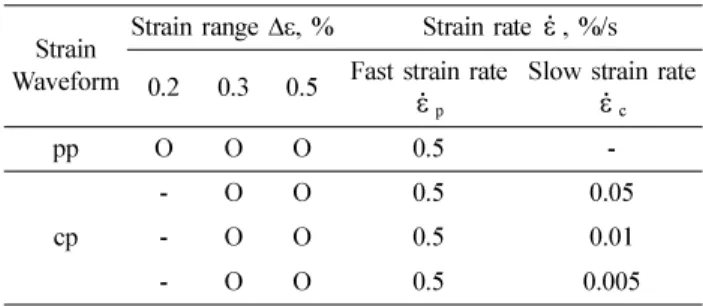
strain waveform tests, the strain rate was set to 0.5%/s for the fast straining (p-part ( p )). In the cp tests, the strain rate in the p-part was the same as the p-part in the pp tests, but three slow strain rates (c-part strain rate ( c )) were used as 0.05%/s, 0.01%/s and 0.005%/s to see the strain rate effect on the crack propagation behavior. The details of test conditions are listed in Table 2 with circles.
Before observing the microstructure, the specimen surface was polished using alumina powders down to 0.05 µ m and etched with FeCl 3 (10 g)-HCl (2 ml)-distilled water (100 ml).
The cracking path, fracture surface and cross section of cracking part were observed after tests by using an optical microscope, a scanning electron microscopy (SEM) and an electron back-scatter pattern (EBSP) technique.
Surface roughness of the specimen was measured to discuss the deformation behavior of the solder following ASME standard. 20) The mean roughness denoted with R z
and defined by the following equation was used to express the roughness of the specimen surface.
(1) where R pi and R vi are the highest and lowest points for the i th sampling length, respectively. The roughness profile of the specimen surface was measured by a laser stylus with a
ε·
ε·
R
Z1
5 --- ( R
pi– R
vi)
i 1=
∑
5= Fig. 1. Geometry of the specimen (unit: mm).
Fig. 2. Definition of crack length.
Fig. 3. Strain waveforms used in crack propagation test.
Table 2. Crack propagation test conditions Strain
Waveform
Strain range ∆ε , % Strain rate , %/s 0.2 0.3 0.5 Fast strain rate
p
Slow strain rate
c
pp O O O 0.5 -
cp
- O O 0.5 0.05
- O O 0.5 0.01
- O O 0.5 0.005
ε·
ε· ε·
resolution of 0.1 µ m and R
zwas calculated from the roughness profile.
3. Results and Discussion
3.1 Crack propagation Rates
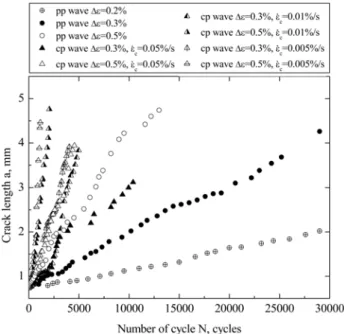
Crack propagation curves against the number of cycles are shown in Fig. 4 for all the test conditions. Crack propagation rates are faster at higher strain range in the same strain waveform. At a given strain range, the crack propagation rate in the cp strain waveform is faster than that in the pp strain waveform and the faster crack propagation rate is found at slower
cin the cp strain waveform. These results indicate that more creep damage occurred ahead of crack occurs at the slower strain rate, which leads to the faster crack propagation in the cp strain waveform.
The fatigue J-integral range is commonly used to correlate cycle-dependent crack propagation rates and the creep J-integral range to correlate time-dependent crack propagation rates. They are expressed by the following equations
21-22):
(2) (3) where S
p, S
c1and S
c2are the dashed areas in the load- displacement hysteresis loop as shown in Fig. 5 and B and W are the thickness and the width of the plate, respectively.
E is the Young’s modulus (20 GPa), and α is the creep
exponent in the power creep law. The value of α at 313K was set to 10.46.
21-22)Figure 6 correlates the crack propagation rates with the fatigue J-integral range and the creep J-integral range in the pp and the cp strain waveforms, respectively. The correlations are classified into two groups depending on the strain waveform. One is for the crack propagation rates in the pp strain waveform correlated with the fatigue J-integral range that is the cycle-dominant crack propagation. The other is for the crack propagation rates in the cp strain waveform correlated with the creep J-integral range that is the time- dominant crack propagation. The results imply that the mechanism of the crack propagation is different between the pp and the cp strain waveforms that will be discussed from the observations of cracking behavior.
ε·
∆J
f( ∆K )
2--- E 2S
pB W 2a ( – ) --- +
=
∆J
cα 1 – α 1 +
--- ( S
c1– S
c2) B W 2a ( – ) ---
×
=
Fig. 4. Variation of the crack length with the number of cycles.
Fig. 5. Areas in the hysteresis loop for calculating J-integral ranges.
Fig. 6. Correlation of crack propagation rates for the cycle-
dominant and the time-dominant strain waveforms with
fatigue and creep J-integral ranges.
3.2 Crack propagation mechanisms 3.2.1 Crack paths
Figure 7 shows the macroscopic cracking direction on the specimen surface in the pp strain waveform (Fig. 7(a)) and in the cp strain waveform (Figs. 7(b)-(d)), where the slow strain rate was changed in the latter three cp strain waveforms. The crack in the pp strain waveform propagated in the direction perpendicular to the specimen axis making a zigzag shape, meaning that the crack tip extended in the shear mode macroscopically forming the normal crack (Fig.
7(a)). The crack propagated perpendicular to the specimen axis for about 1 mm in the cp strain waveform as shown in Fig. 7(b), but it branched and propagated in the direction of about 45 degrees to the specimen axis. There is no such normal cracking part in the cp strain waveform in Fig. 7(c) and (d), where the cracks in these testing conditions propagated in the shear direction from the initial stage. The cracking modes in the cp strain waveform indicate that the crack tends to propagate in the shear direction as the slow strain rate decreases.
Fig. 7. Micrographs of crack paths for the specimen tested (a) in the pp strain waveform at ∆ε =0.2%, (b) in the cp strain waveform at
∆ε =0.5% and
c=0.05%/s, (c) in the cp strain waveform at ∆ε =0.3% and
c=0.001%/s and (d) in the cp strain waveform at
∆ε =0.5% and
cε· ε· =0.005%/s. ε·
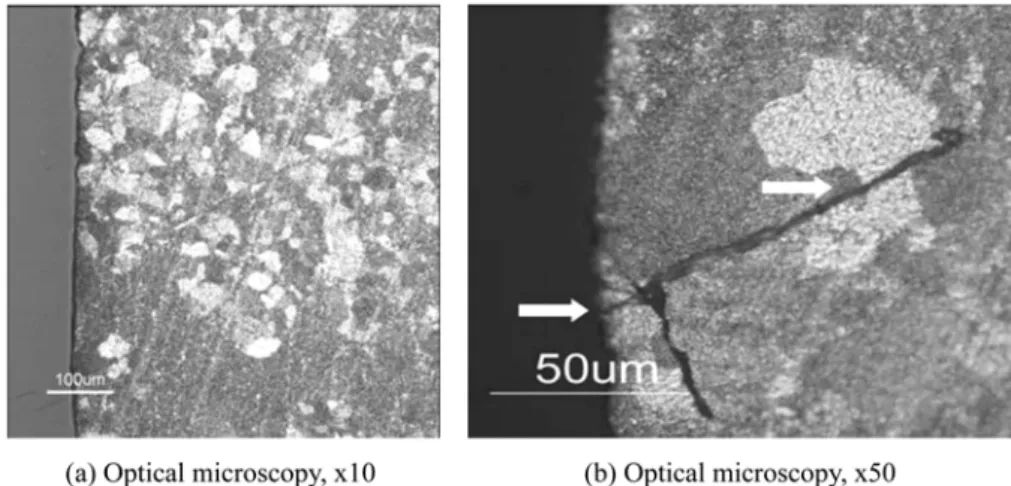
Fig. 8. Micrographs of the longitudinal cross section in the pp strain waveform at ∆ε =0.3%; (a) × 10 and (b) × 50.
3.2.2 Crack surface observations
Figures 8 and 9 show photographs of the longitudinal cross section taken by an optical microscope in the pp strain waveform at ∆ε = 0.3% and in the cp strain waveform at
∆ε =0.3% and
c=0.05%/s after tests. The surface of the specimen in the pp strain waveform is smooth and no significant extrusion and intrusion of grains are found.
Small cracks initiated at the specimen surface propagated transgranually into the specimen that are indicated by the arrows in Fig. 8(b). The specimen surface is roughened in the cp strain waveform that results from the extrusion and intrusion of grains, Fig. 9(a). Intergranular cracking indicated by the arrows is found in the cp strain waveform as shown in Fig. 9(b).
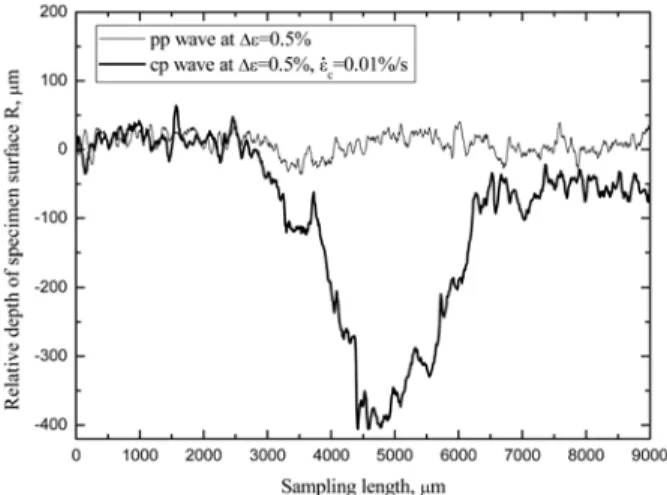
Figure 10 shows profiles of the surface roughness in the pp strain waveform at De=0.5% and in the cp strain waveform at ∆ε =0.5% and
c=0.01%/s. The value of R
zin the pp strain waveform was 72.7 µ m and that in the cp strain waveform 462.6 µ m. The specimen surface in the cp
strain waveform was much rougher than that in the pp strain waveform. The cause of the rougher surface results from the extrusion and intrusion of grains as discussed in the results of Figs. 8 and 9.
ε·
ε·
Fig. 9. Micrographs of the longitudinal cross section in the cp strain waveform at ∆ε =0.3% and ε·
c=0.05%/s; (a) × 10 and (b) × 50.
Fig. 10. Profiles of the surface roughness in the pp strain waveform at ∆ε =0.5% and in the cp strain waveform at ∆ε =0.5% and
c
=0.01%/s.
ε·
Fig. 11. Fractographs of the specimen tested in the pp strain waveform at ∆ε =0.3%.
Fig. 12. Fractographs of the specimen tested in the cp strain
waveform at ∆ε =0.3% and ε·
c=0.01%/s.
transgranular cracking in the pp strain waveform leads to the cycle-dominant crack propagation and the intergranular cracking in the cp strain waveform leads to the time- dominant crack propagation.
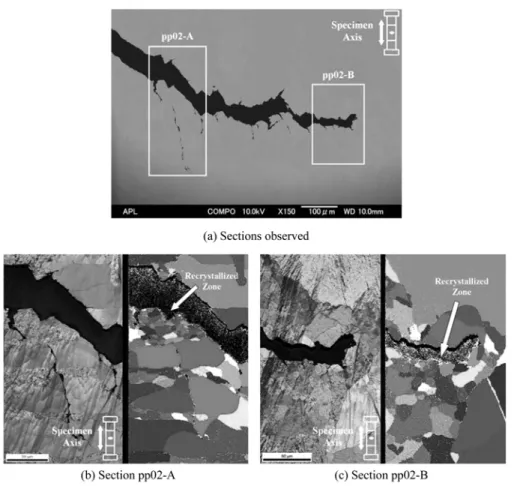
3.2.3 Recrystallization and micro cracks
Recrystallization has often been observed in tin-lead solders during fatigue and creep crack propagations.
23-24)Figures 13 and 14 show SEM and EBSP photographs of the longitudinal cross section of the specimen in the pp strain waveform at ∆ε =0.2% and in the cp strain waveform at
∆ε =0.5% with
c=0.005%/s, respectively. In these figures,
deformation at the crack tip passing that zone, but the influence of the recrystallization on the crack propagation is unclear now. The possibility is that the material with a smaller grain size has a stronger deformation resistance so that the recrystallization would be a resistance to the transgranular crack propagation in the pp strain waveform.
However, the percentage of grain boundaries increases by the grain refinement so that it would accelerate the intergranular crack propagation in the cp strain waveform.
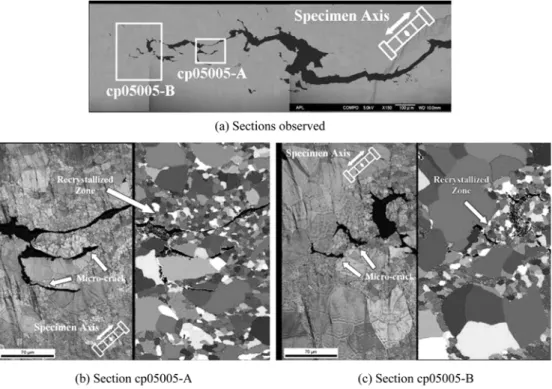
Figure 15 shows SEM photographs of the longitudinal cross section of the specimen in the pp strain waveform at De=0.3% and in the cp strain waveform at ∆ε =0.3% with
ε·
Fig. 13. SEM and EBSP photographs of the longitudinal cross section of the specimen in the pp strain waveform at ∆ε =0.2%; (a) sections
observed, (b) section pp02-A and (c) section pp02-B.
c
=0.05%/s. The micro cracks, which formed in the direction of about 45 degrees to the specimen axis at the grain boundaries, were observed ahead of the crack tip
indicated by the arrows in Figs. 14(b)-(c) and 15(b)-(c) in the cp strain waveform and some of the micro cracks linked up to form the main crack in Figs. 15(b)-(c). On the other
ε·
Fig. 14. SEM and EBSP photographs of the longitudinal cross section of the specimen in the cp strain waveform at ∆ε =0.5% and
c