J Environ Health Sci, 2011: 37(4): 258-266
식품군별 섭취중량 변화에 따른 납의 경구섭취 추정량의 경년변화
문찬석†
부산가톨릭대학교 산업보건학과
Time Trends in Estimated Dietary Lead Intake from the Variation of Intake Weight Per Food Group
Chan-Seok Moon†
Department of Industrial Health, Catholic University of Pusan, Busan, Korea
ABSTRACT
Objectives: The aim of this study is to examine the possible changes over the past ten years in the estimated daily dietary lead intake (Pb-D) stemming from the variation of daily intake amounts for each food group. The following factors were considered; 1. time trends in Pb-D as the estimated values, 2. the time trend in Pb-D by food groups 3. the most influential food groups for dietary Pb intake.
Methods: Estimated Pb-D was drawn from food consumption according to food groups reported in the Korean National Health and Nutrition Survey and the lead contents of each food group as reported in 23 prior publications.
Results: The estimated Pb-D in a 2009 survey was 40.8 µ g/day, of which 22.5 µ g/day (55.1%) was of plant origin and 18.3 µ g/day (44.9%) was of animal origin. Meats and poultry, fish and shellfish among foods of animal origin and beverages of plant origin had the largest contribution in Pb-D among the food groups.
Conclusion: Over past ten years, daily lead intakes have slightly increased among men. Otherwise, no clear variation is apparent among women.
Key words: Lead, Estimation, Time trend, Dietary intake, Food group
I. 서 론
납의비직업적노출원은음용수를포함한음식물과 대기의호흡이다
.
1-4)이중금속은직업적노출과노출 경로에서도 많이연구되었으며,
비직업적노출의측 면에서도가장이슈가되어온유해중금속이다.
5-8)제조업작업장에서납은페인팅의재료로서흔히사용 되며
,
축전지,
납제련,
연주조,
프린팅,
납땜,
납유리 작업 등 사용도가 광범위하다.
9) 미국 산업위생사협의회
(ACGIH)
의발암성물질분류에서A3
카테고리(
실험동물에 있어 고농도 폭로시 발암원성물질)
에속하는물질로분류되어있고신경계의독성과햄합 성을 억제시키는 물질로보고하고있다
.
납을취급 하는공장근로자들의노출기준으로서ACGIH(2010)
의 작업환경내 화학물질의 폭로한계치
(Threshold Limit Values)
의TWA
는0.05 mg/m
3이다.
10,11)음식물을통한납섭취량을구하는방법으로는회 상법
,
마켓베스킷법그리고 음식물복제법이 있다.
12)회상법의경우대상자들이그날섭취한 음식물들을 기억에의해산정해내는방법으로서간편하고가장 흔히사용되는방법이기는하나추정치로서의의미 가강하며
,
마켓베스킷법은미국및유럽국가에서섭†
Corresponding author: Department of Industrial Health, Catholic University of Pusan, Busan 609-757, Korea, Tel: +82-51-510-0633, Fax: +82-303-0941-0777, E-mail: [email protected]
Received: 1 June 2011, Revised: 3 August 2011, Accepted: 20 August 2011
[ 원 저 ]
취량연구에흔히 사용되는방법으로일정기간분의 개인음식물을 연구자가 동일하게 구입하여 실험에 의하여그섭취량을산정하는방법이나손실분의오 차에대한보정이어렵다는단점이있다
.
음식물복 제법은일정기간개인이섭취한음식물을동량복제 하는방법으로서중금속의섭취량을산정하는데가 장정확도가높은방법이나많은시간과비용및다 수의인력을필요로한다.
금속류대부분의인체노출이음식물섭취를통해 일어나는것에 비해
,
납은 음식물 섭취와대기호흡 양자의노출에의해영향이결정되는특성을가지고있다
.
12)1970
년대와80
년대에유연휘발유의사용이문제시 된이후 무연휘발유 사용에 따른영향이나
,
공장매연 및고정배출원
(Stationary source)
의배출 억제,
13)환경보건법을통한환경유해물노출에대한 국가적인관리,
그리고산업단지및폐광산주변의거 주민에 대한 환경영향평가를통한 유해물 노출 관리14,15)가시행되고 있는 현재의 시점에서음식물을
통한 납 섭취량의 시간적인변화를 관찰하는것은
납노출경로연구에큰의의를가진다
. 1990
년대와2000
년을 전후하여 납 섭취량에 대한소수의 보고가있었으나
,
환경오염상황이변화된현재시점에서 납의경구섭취에 관한 보고는 거의 없는실정이다.
그러므로본연구에서는납섭취량에관한경년변화 를관찰하기위한일환으로서 음식물을통한납섭 취 추정량을산출해내고
,
납 섭취량의경년변화에영향을주는 식품군을밝히고자한다
.
II. 연구내용 및 방법
식품군별 섭취중량은 국민건강영양조사16) 자료에 서
1998, 2001, 2005, 2007
및2009
년도의 남성과 여성및남녀총계의음식물평균섭취중량을인용하 였다.
식품군은식물성식품군과동물성식품군으로 구분하였다.
식물성식품군은13
개소집단으로분류 하였다.
이들13
개소집단은곡류,
감자 및 전분류,
당류
,
두류,
종실류,
채소류,
버섯류,
과실류,
해조류,
음료및 주류
,
조미료류,
유지류(
식물성),
기타(
식물 성)
로구성되었다.
동물성식품군은6
개소집단으로분류되었으며
,
육류,
난류,
어패류,
유류,
유지류(
동 물성),
기타(
동물성)
로구성되었다(Table 1).
각식품군별음식물에대한 납의함량은기존 보
고서17-38)의개별식품군의납산출농도 대표치들을
나열하여그 대표치들의 중위수
(median)
와 범위(
최 소치-
최대치)
를산출하였다.
이들보고서는한국인이 섭취하고있는 음식물이며,
전국 조사의 형태를띄 는연구규모이고,
식품항목별납의분석은적절한 국내외정도관리또는이에준하는관리가이루어지 는기관에서산출된결과치를사용하였다(Table 2).
납의
1
일섭취추정량의계산은국민건강영양조사에서산출되었던 각식품군별섭취중량에식품군별 납함량의중위수와최소치및최대치를곱하여산 출하였다
(Table 3).
III. 결 과
1. 식품군별 1일 섭취중량보건복지부의
2009
국민건강통계에나타난10
년간5
회(1998
년, 2001
년, 2005
년, 2007
년, 2009
년)
조사 결과치(
식품항목별1
일 섭취중량)
를남자와 여자및총계로구분하여
Table 1
에나타내었다.
섭취중량은
2009
년 조사에서는 남녀전체1343.9 g/day
을나타내었으며
,
남자가1517.9 g/day
이며,
여자가1166.7 g/day
로서 남자의 섭취중량이 여자에 비해351.2 g
높았다. 10
년간섭취중량의변화에서는남녀총계에서는현저한증감의변화를 나타내지않았으 나
,
남자의경우 과거에서 최근으로올수록 점진적 인섭취중량의상승을나타내었고(1998
년1394.7 g/
day, 2001
년1406.8 g/day, 2005
년1416.5 g/day, 2007
년1457.2 g/day, 2009
년1517.9 g/day),
여자 의 경우는 뚜렷한 증감의 변화를 나타내지 않았다(1998
년1167.3 g/day, 2001
년1211.7 g/day, 2005
년1131.6 g/day, 2007
년1127.5 g/day, 2009
년1166.7 g/day).
식품군별가장높은 섭취중량은 곡류
,
채소류,
과실류
,
음료및주류로서식물성식품군이었다.
한국인 의 주 에너지원으로서 곡류는292.5 g/day(2009
년 조사)
이며,
그다음이채소류로286.7 g/day(2009
년 조사)
이며,
음료및주류가190.4 g/day(2009
년조사),
과실류가
169.1 g/day(2009
년조사)
의섭취중량을나 타내고있다.
2. 식품군별 납 함량
식품군 별 납의 함량을 나열한 후 가장 낮은값
문찬 석
nv iro
n H ea lth Sc i 20 11 :3 7(4 ): 25 8-2 66
http:/
/ww w.ks eh.o
Table 1. Daily intake in each food group by Korean population (g/day)
Food group Man
16)Women
16)Total
16)1998 2001 2005 2007 2009 1998 2001 2005 2007 2009 1998 2001 2005 2007 2009 Food of plant origin
Grains and cereals 372.3 316.7 342.2 321.2 326.0 303.9 265.3 286.2 255.9 258.0 337.2 289.4 314.4 288.9 292.5 Potatoes and starch 32.6 25.7 20.8 32.0 35.6 38.1 27.6 19.7 36.6 38.0 35.5 26.7 20.2 34.3 36.8 Sugars and sweet 8.2 12.1 8.1 10.2 9.1 6.5 10.5 6.4 6.1 6.5 7.3 11.2 7.3 8.2 7.8 Pulses 35.4 37.0 42.5 43.5 40.0 26.8 27.3 34.9 31.7 30.3 31.0 31.8 38.7 37.5 35.2
Nuts and seeds 2.9 2.6 4.7 2.5 3.0 3.0 2.8 3.7 2.4 2.4 3.0 2.7 4.2 2.4 2.7
Vegetables 319.4 330.8 360.4 319.8 326.9 257.6 269.6 292.5 236.9 246.3 287.5 297.9 326.4 278.2 286.7
Mushrooms 4.1 5.0 4.4 3.4 4.0 4.0 4.7 4.2 3.5 4.5 4.0 4.8 4.3 3.5 4.2
Fruits 176.0 176.9 77.8 157.8 151.2 218.3 235.3 97.9 197.0 187.5 197.1 208.1 187.6 176.9 169.1
Seaweed 8.3 9.1 8.0 6.7 5.1 7.4 9.2 9.0 5.9 4.4 7.8 9.1 8.5 6.3 4.7
Beverages 131.8 147.9 198.0 216.6 256.4 59.5 88.9 86.2 103.3 123.5 94.2 116.2 142.4 160.3 190.4 Seasonings 30.0 35.8 41.6 39.3 43.3 22.1 28.3 33.3 25.9 29.3 26.0 31.8 37.4 32.6 36.4
Oils 6.0 11.4 8.3 8.7 9.2 4.9 8.9 6.7 5.7 5.8 5.4 10.0 7.5 7.2 7.5
Others (plant origin) 2.9 4.6 0.0 0.6 0.4 3.2 5.2 0.0 0.3 0.5 3.0 5.0 0.0 0.5 0.4 Subtotal 1129.8 1115.6 1116.8 1162.3 1210.3 955.3 983.6 880.7 911.2 937.0 1038.9 1044.9 998.9 1036.7 1074.6 Food of animal origin
Fish and shellfish 75.0 75.6 78.1 64.4 60.9 58.4 56.3 57.6 41.0 39.1 66.5 65.1 67.8 52.8 50.1
Meats and poultry 82.6 112.1 104.5 112.8 109.3 53.7 74.8 74.5 64.1 64.9 67.8 92.4 89.8 88.8 87.4
Eggs 25.1 24.5 28.4 25.9 30.1 18.6 18.3 23.2 18.6 21.1 21.7 21.2 25.8 22.2 25.7
Milks and dairy products 79.6 78.7 86.3 91.6 107.1 79.5 78.3 94.2 92.5 104.3 79.7 78.7 90.2 92.2 105.8
Fats(animal origin) 2.4 0.1 2.0 0.2 0.2 1.9 0.1 1.2 0.2 0.2 2.1 0.1 1.6 0.2 0.2
Others (animal origin) 0.1 0.2 0.4 0.0 0.1 0.1 0.2 0.1 0.0 0.0 0.1 0.2 0.3 0.0 0.0
Subtotal 264.8 291.3 299.7 294.8 307.6 212.2 228.1 250.9 216.4 229.7 238.0 257.7 275.5 256.2 269.3
Total 1394.7 1406.8 1416.5 1457.2 1517.9 1167.3 1211.7 1131.6 1127.5 1166.7 1276.9 1302.6 1274.3 1292.9 1343.9
과가장높은값을최소치와최대치로하여 범위로 나타내고대표치로서 중위수
(median)
를사용하였다(Table 2).
식품군별납의함량은기존 자료를참고로하였다
.
엄선된국내23
개의보고서를면밀히검 토한후범위에적용하였으며이들범위에서사용된 데이터를기준으로하여 중위수를산출하였다.
높은납함량을나타내는식품군은식물성식품군 의 두류
(
중위수0.120
µg/g,
범위0.010-0.380
µg/g)
및동물성식품군의어패류
(
중위수0.107
µg/g,
범위0.006-4.350
µg/g)
와육류및가금류(
중위수0.100
µg/
g)
로나타내었다.
식품의납함량은관심이높은 동 물성 식품군의 어패류에서 가장 많은 보고 자료가 있었으며,
곡류,
감자및전분류,
두류,
채소류,
해조 류및음료및주류에서는필요한자료를확보할수 있었으나,
종실류,
버섯류,
유지류(
식물성),
기타(
식물 성)
의 식물성 식품군들과 난류,
유지류(
동물성),
기타
(
동물성)
의동물성식품군의비교적섭취중량이나납의함량이높지않은식품군에서는유효한자료가 없어농도를제시하지못하였다
.
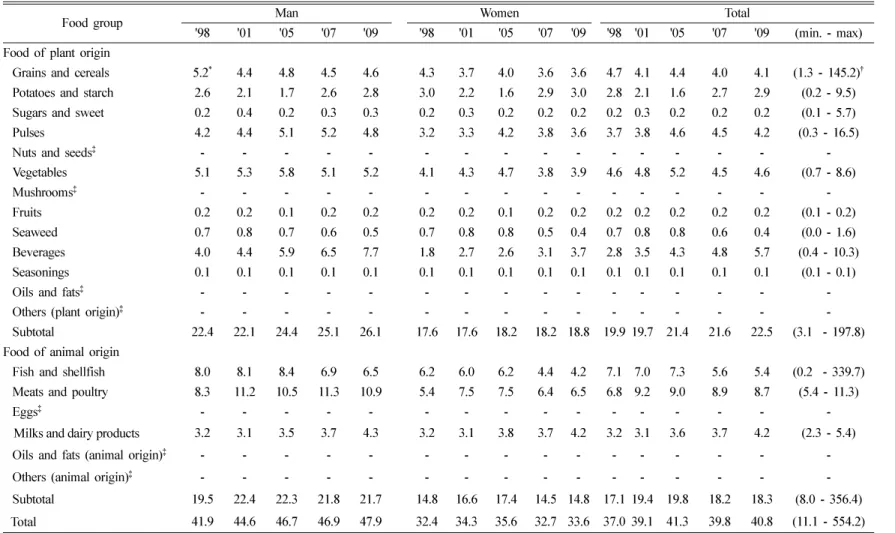
3. 납 섭취 추정량
섭취 추정량에서볼 때
,
음식물섭취량에의한 납 섭취의10
년간의 경년변화로서남자는약간 증가하였으며
,
여자는명확한증감의변화를나타내지않았다
(Table 3).
남자의경우는1
일섭취량이41.9
µg/day
에서
47.9
µg/day
의 섭취량을 나타내었으며 여자의경우는
32.4
µg/day
에서35.6
µg/day
의섭취량을나 타내었다.
식품군별10
년간의 경년변화를 보았을 때,
남자의경우는전체납섭취량이약간증가하였 으며,
식품군별로보았을때는식물성식품군의주 류및음료류식품군에서섭취량의뚜렷한증가를보 였다.
여자의경우는전체 식물성식품군의납섭취 량이소폭 증가함을보였으나,
동물성식품군에서는10
년간의변화에서 명확한 증감의변화를나타내지않았다
.
그러므로여자의전체납섭취량은남자와는달리
10
년간의확연한증감변화가나타나지않았다.
1
일납섭취량을식물성식품군과동물성식품군으로구분하여 납 섭취량을 계산하였을때
, 2009
년의경우식물성식품군전체에서
22.5
µg/day,
동물성식품군은
18.3
µg/day
로서 식물성 식품군이 전체 중55.1%
를차지하고있고동물성식품군은44.9%
로서납섭취의경우 한국인을대상으로 한비직업적 노 출자들의음식물을 통한 섭취노출의경우는 식물성 식품군을 통한 노출이 약간 높은 것으로나타났다
.
식품군별납섭취량에서는
2009
년 조사를기준으로하여 볼때
,
육류 및 가금류가8.7
µg/day
로서 가장높은기여도를나타내는식품군이었으며
,
그다음으로음료및주류가
5.7
µg/day
로높은기여도를나타내었고
,
어패류(5.4
µg/day)
가세번째납의섭취기여도를나타내었다
.
식품섭취중량에서가장높은값을 나타내는곡류,
채소류,
과실류,
음료및주류의경우 는각각4.1, 4.6, 0.2, 5.7
µg/day
로서 높은섭취중량 에비례하는납섭취량을나타내지는않았다.
IV. 고 찰
1. 납 섭취량의 추정치와 실측치
,
혈중농도 노출경로를음식물에의한노출과대기호흡에의Table 2. Median and range of Pb levels in each food
group
Food group Median
(µg Pb/g) Range (µg Pb/g) Food of plant origin
Grains and cereals
21,37,39)0.007 0.005 - 0.390 Potatoes and starch
21,37)0.080 0.010 - 0.250 Sugars and sweet
25)0.030 0.010 - 0.470 Pulses
21,32)0.120 0.010 - 0.380
Nuts and seeds - -
Vegetables
23,24,34,37)0.016 0.003 - 0.024
Mushrooms - -
Fruits
37)0.001 0.001 - 0.001
Seaweed
33)0.089 0.010 - 0.178
Beverages
23,27,29,37)0.030 0.007 - 0.040 Seasonings
30)0.003 0.003 - 0.003
Oils - -
Others (plant origin) - -
Food of animal origin
Fish and shellfish
17,18)0.107 0.006 - 4.350 Meats and poultry
30)0.100 0.100 - 0.100
Eggs - -
Milks and dairy products
19)0.040 0.030 - 0.050
Fats - -
Others (animal origin) - -
Values in median and range were rounded off at the fourth place below the decimal point.
-: No data were available.
문찬 석
nv iro
n H ea lth Sc i 20 11 :3 7(4 ): 25 8-2 66
http:/
/ww w.ks eh.o
Table 3. Time trend of estimated dietary Pb intake (µg Pb/day)
Food group Man Women Total
'98 '01 '05 '07 '09 '98 '01 '05 '07 '09 '98 '01 '05 '07 '09 (min. - max) Food of plant origin
Grains and cereals 5.2
*4.4 4.8 4.5 4.6 4.3 3.7 4.0 3.6 3.6 4.7 4.1 4.4 4.0 4.1 (1.3 - 145.2)
†Potatoes and starch 2.6 2.1 1.7 2.6 2.8 3.0 2.2 1.6 2.9 3.0 2.8 2.1 1.6 2.7 2.9 (0.2 - 9.5) Sugars and sweet 0.2 0.4 0.2 0.3 0.3 0.2 0.3 0.2 0.2 0.2 0.2 0.3 0.2 0.2 0.2 (0.1 - 5.7) Pulses 4.2 4.4 5.1 5.2 4.8 3.2 3.3 4.2 3.8 3.6 3.7 3.8 4.6 4.5 4.2 (0.3 - 16.5)
Nuts and seeds
‡- - - - - - - - - - - - - - - -
Vegetables 5.1 5.3 5.8 5.1 5.2 4.1 4.3 4.7 3.8 3.9 4.6 4.8 5.2 4.5 4.6 (0.7 - 8.6)
Mushrooms
‡- - - - - - - - - - - - - - - -
Fruits 0.2 0.2 0.1 0.2 0.2 0.2 0.2 0.1 0.2 0.2 0.2 0.2 0.2 0.2 0.2 (0.1 - 0.2) Seaweed 0.7 0.8 0.7 0.6 0.5 0.7 0.8 0.8 0.5 0.4 0.7 0.8 0.8 0.6 0.4 (0.0 - 1.6) Beverages 4.0 4.4 5.9 6.5 7.7 1.8 2.7 2.6 3.1 3.7 2.8 3.5 4.3 4.8 5.7 (0.4 - 10.3) Seasonings 0.1 0.1 0.1 0.1 0.1 0.1 0.1 0.1 0.1 0.1 0.1 0.1 0.1 0.1 0.1 (0.1 - 0.1)
Oils and fats
‡- - - - - - - - - - - - - - - -
Others (plant origin)
‡- - - - - - - - - - - - - - - -
Subtotal 22.4 22.1 24.4 25.1 26.1 17.6 17.6 18.2 18.2 18.8 19.9 19.7 21.4 21.6 22.5 (3.1 - 197.8) Food of animal origin
Fish and shellfish 8.0 8.1 8.4 6.9 6.5 6.2 6.0 6.2 4.4 4.2 7.1 7.0 7.3 5.6 5.4 (0.2 - 339.7) Meats and poultry 8.3 11.2 10.5 11.3 10.9 5.4 7.5 7.5 6.4 6.5 6.8 9.2 9.0 8.9 8.7 (5.4 - 11.3)
Eggs
‡- - - - - - - - - - - - - - - -
Milks and dairy products 3.2 3.1 3.5 3.7 4.3 3.2 3.1 3.8 3.7 4.2 3.2 3.1 3.6 3.7 4.2 (2.3 - 5.4)
Oils and fats (animal origin)
‡- - - - - - - - - - - - - - - -
Others (animal origin)
‡- - - - - - - - - - - - - - - -
Subtotal 19.5 22.4 22.3 21.8 21.7 14.8 16.6 17.4 14.5 14.8 17.1 19.4 19.8 18.2 18.3 (8.0 - 356.4) Total 41.9 44.6 46.7 46.9 47.9 32.4 34.3 35.6 32.7 33.6 37.0 39.1 41.3 39.8 40.8 (11.1 - 554.2) Values in the table are calculated from daily food intake in each year (Table 1) multiplied by median (minimum–maximum) Pb contents in each food group (Table 2).
*
Median,
†The range of the minimum and the maximum,
‡No data are available on Pb contents.
한노출로나누어볼때
,
납의경우는거의절반정도가음식물을통한노출이며농촌지역에서대도시 로갈수록대기 호흡에의한노출량이높아지는경
향을 나타낸다
.
12)1995
년에 수행된 이 조사연구는1987
년부터 사용되기 시작한 무연휘발유의 사용이점차확대되고
, 1993
년에이르러유연휘발유가전면생산중단된 시기와부합되고 있고
,
자동차의집중현상이시골지역에 비해대도시에집중적으로나타 났으며
,
부가적인요인으로서대도시의경우지하철 공사로도로가 파헤쳐지거나도로에 설치된임시운 행용 도로철판이 차량의 잦은 통행으로 인해 심한 분진을일으킴으로서대기오염을일으키는요인으로 작용하고있던시기로볼 수있다.
음식물을 통한 납 섭취량
,
대기중 납의 농도 및 한국인의혈중납농도의 대표치들을모아Table 4
에 연도별로농도수준을비교하였다
.
혈중납에있어서는
, 1986
년조사를 기점으로하여현재에이르기 까지확연한 감소가 확인되었다
.
즉,
여성대상자만을 비교할 때
1986
년에51.5
µg/
l의 농도수준에서
2008
년 조사에서17.7
µg/
l로 약3
배의 점진적인감소가 나타났다
.
대기 중 납의농도는2010
환경통계연감의 자료 중
12
개 대도시(41
개 측정지 역)
연간자료의전체평균치를재계산하여국내총 평균치로나타내었다. 10
년간주요도시의연간총평 균치를나열해 보았을때, 2000
년에0.093 µg/m
3에서
2009
년의 평균치는0.050 µg/m
3으로1.9
배감소를 보였으며
,
이는 대기 중 납 농도가10
년 전인2000
년에비해2009
년에약절반농도로감소하였다고볼수 있다
.
체내흡수량을산정하기위하여음식물을통한납 섭취추정량과대기중납농도의평균치를 기준으로
,
음식물의경우는장관흡수를
7.5%
로산정하고,
대기의경우는
1
일성인호흡량15 m
3의용적에50%
의흡수를가정하여계산치를산출한후
,
44)이두요인 중 음식물을 통한납의 흡수율
[Food/(air+Food)
(%)]
을나타내었다.
여성대상자를기준으로하여보Table 4. Time trend in dietary Pb intake, Pb concentration in ambient air and blood Pb concentration
Year of
survey Pb-D
(µg/day) Pb-A
‡,43)(µg/m
3) Pb-B
§(µg/
l) Dietary absorption
(µg/day) Air absorption
¶(µg/day) Food / (air+Food) 1986 33.1 (women)
†,40)51.5(women)
40)2.48 (%)
1994 20.5 (women)
†,12)44.3(women)
12)1.53 1998 41.9 (men)
*32.4 (women)
*3.14(men)
2.43(women) 2000 18.4(women)
†,41)0.093 37.3(women)
41)1.38 2001 44.6 (men)
*34.3 (women)
*, 24.37
†,42)0.077 3.35(men) 2.57(women) 1.83
0.58 85.24(men) 81.59(women) 75.93
2002 0.073 0.55
2003 0.071 0.53
2004 0.075 0.56
2005 46.7 (men)
*35.6 (women)
*0.057 30.6(man)
43)23.1(women)
43)3.50(men)
2.67(women) 0.43 89.06(men) 86.13(women)
2006 0.063 0.47
2007 46.9 (men)
*32.7 (women)
*0.063 23.2(man)
43)14.7(women)
43)3.52(men)
2.45(women) 0.47 88.22(men) 83.90(women)
2008 0.062 25.5(man)
43)17.7(women)
4)0.47
2009 47.9 (men)
*33.6 (women)
*0.050 3.59(men)
2.52(women) 0.38 90.43(men) 86.90(women)
*Estimated dietary Pb intake (the present study), †instrumental dietary Pb intake, ‡Pb concentration in ambient air, §blood Pb concentration, Dietary absorption per capita per a day was assumed as 7.5%12,44), ¶Ambient air absorption per capita per a day was calculated from 15 m3/day for respiration of ambient air and 50% for their uptake12,44)
았을때
, 2001
년조사에서는음식물을통한납의흡수율이
81.59%
를 차지하였으며, 2005
년 조사에서86.13%, 2007
년조사에서83.90%, 2009
년조사에서는
86.90%
로서,
납섭취추정량을기준으로하여흡수율을산정하였을때는약
5.3%
가증가되었음을나 타내었다.
남성대상자의경우에서도2001
년, 2005
년
, 2007
년, 2009
년조사에서각각85.24%, 89.06%,
88.22%, 90.43%
를나타내어약5.2%
가증가하여여성대상자와비슷한양상을나타내었다
.
이는대기를 통한납흡수량의실질적인감소에의하여상대적으 로 음식물을 통한 납의 흡수율이 증가되는 양상을 보였다.
그러므로한국인의혈중 납농도의 감소에 의미를가지는영향요인으로서대기 중납의농도 의감소를들수있다.
대기호흡을통한납의노출 에서 대기중의 납 농도가 지속적으로 낮아진다고 본다면음식물을통한경구섭취가납의주노출경 로로변화하고있음을추정할 수있다.
음식물의 경우에서는
,
식품군별 섭취량의 변화에 의해 남자는 납 섭취량이10
년간 약간 증가하였으며
,
여자의 경우는명확한 증감변화를 나타내지않았다
.
본연구에서주로다루고자하는내용이식품군별납의함량
(Table 2)
을한시점상의농도로서고정시키고
,
식품군별 섭취중량의 경년변화에 의해서 납섭취량에변화가나타나는지를확인하고자하였 으므로,
납경구섭취증감의시간적인변화연구를하 는데 있어섭취중량의 변화는 가장 먼저 고려해야 하는 부분이다.
따라서 본 연구의 결과에서 볼때,
혈중납농도의감소요인으로서음식물의납섭취량 은식품군의섭취중량적인측면에서는밀접한인과 관계를 가지지않았다
.
그러나 식품군별납의 함량(Table 2)
은대기농도의점진적인감소에의하여지속적인 감소가 나타날 수 있는 부분이므로 대기의 영향에의한식품자체의납함량의변화에대한연 구는필요하며
,
현재 시점에서음식물 섭취를통한 명확한섭취량을산정하는섭취총량연구가이루어 져야할것으로생각한다.
2.식품군별납 섭취 기여도
남녀전체납섭취량에서볼때
, 2009
년조사에서는육류및가금류가식품군별납섭취량에가장높 은기여도를나타내었고
,
주류및음료류가그다음 높은기여도를나타내었으며,
어패류가3
번째높은납의 섭취 기여도를나타내었다
.
식품군별납 섭취특성을본다면
,
식물성식품군의경우는9
군에서전체섭취량의
55.1%
를나타내므로일반한국인에있어음식물섭취습성은여전히채식성임을알수있 었다
.
그리고 각식품군별 섭취량이높지는 않다고 하더라도식품군의종류가많아다양한 식품군으로 부터들어오게되므로총량적인면에서납의함량이 동물성식품에비해높게나타나지만그농도자체 는높지 않다고볼 수있다.
동물성식품의 경우는전체 납섭취량의
44.9%
를 차지하여전체 납섭취량의 절반에 약간 못미치는 수준에 있으나
, 3
개의 식품군에서섭취되는양으로서납의주요 노출원으 로서 이들 식품군에 대한 섭취량의조절이 필요한 것으로 생각된다.
특히 납의 노출에서 볼 때,
육류 및가금류의경우는지금까지의보고자료를 기준으로 하였을 때 섭취량의범위가 넓지 않았으나
(5.4-
11.3
µg/day),
어패류의 경우는 중위수에서5.4
µg/
day
정도의섭취량을나타내고있으나 섭취의범위가상당히넓게나타나고있으므로
(0.2-339.7
µg/day)
오염된어패류의섭취에관한잠재적인노출을생각 해볼수있다
.
V. 결 론
식품군별섭취중량의변화에의해납섭취량에변 화가있는지를추정량을통하여산출하였다
. 10
년간의 납 섭취추정량의 경년변화는 남자가
41.9-47.9
µ
g/day
로서,
식품군중주류 및음료류의섭취량증가에 의한 납 섭취량의증가가확인되었다
.
여성의경우는
32.4-35.6
µg/day
으로서식품군의납 섭취량에기인한 전체섭취량의변화는 나타나지않았다
.
식품군별납의섭취에가장영향을나타내는식품군 은동물성식품군의육류및가금류
,
어패류이고,
식물성식품군의주류및음료류였다
.
어패류는납함 량의범위가가장 넓기때문에잠재적인노출위험 성을가진다.
감사의 글
이논문은
2008
년정부(
교육과학기술부)
의재원으로한국학술진흥재단
(
현한국연구재단)
의지원을받 아수행된연구임(KRF-2008-331-E00081).
참고문헌
1. Buchet JP, Lauwerys R, Vandevoorde A, Pycke J M. Oral daily intake of cadmium, lead, manganese, copper, chromium, mercury, calcium, zinc and arsenic in Belgium: A duplicate meal study.
Food Chem Toxicol.1983; 21: 19-24.
2. Müller M, Anke M. Distribution of cadmium in the food chain (soil-plant-human) of a cadmium exposed area and the health risk of the general population.
Sci Total Environ.
1994; 156: 151-158.
3. Ikeda M, Watanabe T, Koizumi A, Fujita H, Nakat- suka H, Kasahara M. Dietary intake of lead among Japanese farmers.
Arch Environ Health.1989; 44:
23-29.
4. Ikeda M, Zhang Z-W, Shimbo S, Watanabe T, Nakatsuka H, Moon C-S. et al. Urban population exposure to lead and cadmium in east and south- east Asia.
The Sci Total Environ.2000; 249: 272- 5. International Programme on Chemical Safety. Envi- 384.
ronmental health criteria 85. Lead-environmental aspects. Geneva. World Health Organization 1989.
6. International Programme on Chemical Safety. Envi- ronmental health criteria 134. Cadmium. Genava.
World Health Organization 1992.
7. International Programme on Chemical Safety. Envi- ronmental health criteria 135. Cadmium-environ- mental aspects. Geneva. World Health Organization 1992a.
8. International Programme on Chemical Safety. Envi- ronmental health criteria 165. Inorganic lead.
Geneva. World Health Organization 1995.
9. International Agency for Research on Cancer: Lead and lead compound. IARC Monographs on the Evaluation of the Carcinogenic Risk of Chemicals to Human. 1980; 23: 325-415.
10. IARC. IARC monographs on the evaluation of the carcinogenic risk of chemicals to humans: Some metals and metabolic compounds. 1980; 23: 315- 11. ACGIH (2010) TLVs and BEIs. Cincinnati, OH. 425.
12. Moon C-S, Zhang Z-W, Shimbo S, Watanabe T, Moon D-H, Lee C-U, et al. Dietary intake of cad- mium and lead among general population in Korea.
Environ Res.
1995; 71: 46-54.
13. Moon C-S, Ikeda M. Pollutant levels in ambient air and blood in Korea.
Environ Health Prev Med.1996; 1: 33-38.
14. Choi B-W, Jung J-H, Choi W-J, Jeon C-J, Shon B- H. Distribution characteristics of ambient heavy
metals based on the emission sources and their car- cinogenic risk assessment in Ulsan, Korea.
Kor J Env Hlth.2006; 32(5): 522-531.
15. Ministry of Environment, Korea. Environmental Health Act 2009.
16. Ministry for Health, Welfare and Family Affairs, Korea (2010) Korean National Health and Nutri- tion Survey 2009.
17. Sheo H-J, Hong S-S, Kim C-M. A study on the contents of heavy metals in freshwater fishes of Yeong San river.
J Korean Soc Food Nutr.1991;
20(6): 615-620.
18. Sung D-W, Lee Y-W. A study on the content of heavy metals of marine fish in Korean coastal water.
Kor J Food Hygiene.1993; 8(4): 231-240.
19. Park SO. Studies on the content of minerals and heavy metals in milk and milk products. thesis for master course in graduate school of agriculture &
animal science: Kon-kuk University; 1994.
20. Kim YC, Han SH. A study on heavy metal con- tents of the fresh water fish, and the shellfish in Korean.
J Food Hyg Safety.1999; 14(3): 305-318.
21. Kim M, Chang M-I, Chung S-Y, Sho Y-S, Hong M- K. Trace metal contents in cereals, pulses and pota- tos and their safety evaluation.
J Korean Soc Food Sci Nutr.2000; 29(3): 364-368.
22. Kim I-S, Han S-H. A study of heavy metal con- tents in shellfishes of various areas in Jeonbuk.
J Korean Soc Food Sci Nutr.2000; 29(5): 758-761.
23. Chun OK, Kim Y, Han SH. A study on the con- tents of heavy metals in the commercial processed foods.
J Food Hyg Safety.2001; 16(4): 308-314.
24. Chung S-Y, Kim M-H, Sho Y-S, Won K-P, Hong M-K. Trace metal contents in vegetables and their safety evaluations.
J Korean Soc Food Sci Nutr.2001; 30(1): 32-36.
25. Chung S-Y, Kim M, Kim JS, Hong M, Lee JO, Kim CM. Trace metal elements in sugar products and their safety evaluations.
Korean J Food Sci Technol.2002; 34(6): 992-997.
26. Ham H-J. Distribution of hazardous heavy metals (Hg, Cd, and Pb) in fishery products, sold at Garak wholesale markets in Seoul.
J Food Hyg Safety.2002; 17(3): 146-151.
27. Chung S-Y, Kim J-S, Kim E-J, Park SK, Kim M, Hong M et al. Trace metal contents in tea products and their safety evaluations.
Korean J Food Sci Technol.2003; 35(5): 812-817.
28. Kim JH, Lim CW, Kim PJ, Park JH. Heavy metals
in shellfishes around the south coast of Korea.
J Food Hyg Safety.2003; 18(3): 125-132.
29. Kim M, Lee YD, Kim EJ, Chung SY, Park SK, Lee JO. Heavy metal contents in beverages consumed in Korea.
Korean J Food Sci Technol.2003a; 35(3):
342-346.
30. Kim M, Kim JS, Sho Y-S, Chung SY, Lee JO. The study on heavy metal contents in various foods.
Korean J Food Sci Technol.
2003b; 35(4): 561-567.
31. Ha G-J, Song J-Y , Hah D-S. Study on the heavy metal contents in fishes and shellfishes of Gyeong- sangnam-Do coastal area Part 1.
J Food Hyg Safety.2004; 19(3): 132-139.
32. Kim M, Lee YD, Park HJ, Park SK, Lee JO. Con- tents of heavy metals in soybean curd and starch jelly consumed in Korea.
Korean J Food Sci Tech- nol.2005; 37(1): 1-5.
33. Mok J-S, Park H-Y, Kim J-H. Trace metal contents and safety evaluation of major edible seaweeds from Korean coast.
J Korean Soc Food Sci Nutr.2005; 34(9): 1464-1470.
34. Yoo C-C, Kim D-W. Studies on the heavy metal contents in some vegetables sales on markets in Korea.
Korean J Food Nutr.2005; 18(3): 254-264.
35. Hwang YO, Park SG. Contents of heavy metals in marine fishes, sold in Seoul.
Anal Sci Tech.2006;
19(4): 342-351.
36. Kim H-Y, Kim J-C, Kim S-Y, Lee J-H, Jang Y-M, Lee M-S, et al. Monitoring of heavy metals in fishes in Korea- As, Cd, Cu, Pb, Mn, Zn, Total Hg.
Korean J Food Sci Technol.
2007; 39(4): 353-359.
37. Kwon Y-M, Lee K-H, Lee H-S, Park S-O, Park J- M, Kim J-M, et al. Risk assessment for heavy met- als in Korean foods and livestock foodstuffs.
Korean J Food Sci Resour.
2008; 28(3): 373-389.
38. Mok J-S, Shim K-B, Cho M-R, Lee T-S, Kim J-H.
Contents of heavy metals in fishes from the Korean coasts.
J Korean Soc Food Sci Nutr.2009; 38(4):
517-524.
39. Zhang Z-W, Moon C-S, Watanabe T, Shimbo S, Ikeda M. Contents of pollutant and nutrient ele- ments in rice and wheat grown on the neighboring fields.
Biol Trace Elem Res.1997; 57: 39-50.
40. Watanabe T, Cha CW, Song DB, Ikeda M. Pb and Cd levels among Korean populations.
Bull Environ Contam Toxicol.1987; 38: 189-195.
41. Moon C-S, Paik J-M, Choi C-S, Kim D-H, Ikeda M. Lead and cadmium levels in daily foods, blood and urine in children and their mothers in Korea.
Int Arch Occup Environ Health.