DOI: http://dx.doi.org/10.3339/chikd.2015.19.2.159 ISSN 2384-0250 (online)
Hyponatremia May Reflect Severe Inflammation in Children with Kawasaki Disease
Purpose: The aim of the present study was to investigate the risk factors for the development of coronary artery lesions (CALs) and to determine whether hypo- natremia is associated with CALs in children with Kawasaki disease (KD).
Methods: We retrospectively analyzed the data of 105 children with KD who were admitted to Ilsan Hospital between January 2000 and July 2011.
Results: Erythrocyte sedimentation rate (P = 0.013), total bilirubin levels (P = 0.017) were higher and serum sodium levels (P = 0.027) were lower in KD chil- dren with CALs than those without. White blood cell (WBC) counts (P = 0.006), neutrophil counts (P = 0.003) were higher and albumin levels (P = 0.009) were lower in KD children with hyponatremia than those without. On multiple logistic regression analysis, hyponatremia (P = 0.024) and intravenous immunoglobulin–
resistance (P = 0.024) were independent risk factors for CALs in KD. Furthermore, serum sodium levels were correlated negatively with WBC counts (P = 0.004), neutrophil counts (P < 0.001), total bilirubin levels (P = 0.005) and positively with albumin levels (P = 0.009).
Conclusion: Our study indicates that hyponatremia may reflect severe inflamma- tion in children with KD.
Key words: Kawasaki disease, hyponatremia, inflammation, cardiovascular abnormalities
I Re Lee, M.D.
1,
Se Jin Park, M.D., Ph.D.
2, Ji Young Oh, M.D.
1,3,
Gwang Cheon Jang, M.D., Ph.D.
4, Uria Kim, M.D.
4,
Jae Il Shin, M.D., Ph.D.
1,3, Kee Hyuck Kim, M.D., Ph.D.
41Department of Pediatrics, Yonsei University College of Medicine, Seoul, Korea. 2Depart
ment of Pediatrics, Ajou University School of Medicine, Daewoo General Hospital, Geoje, Korea. 3Department of Pediatric Nephrology, Severance Children’s Hospital, Seoul, Korea. 4Departments of Pediatrics, National Health Insurance System Ilsan Hospital, Goyang, Korea
Corresponding author:
Jae Il Shin, M.D., Ph.D.
Department of Pediatrics, Yonsei University School of Medicine, Seoul, Republic of Korea 50 Yonsei-ro, Seodaemun-gu
Tel: +82-2-2228-2050, Fax: +82-2-393-9118, E-mail: [email protected] Kee Hyuck Kim, M.D., Ph.D.
Department of Paediatrics, NHIC Ilsan Hospital, Koyang-si, Kyonggi-do, Republic of Korea 1232 Paeksok-dong, Ilsan-gu
Tel: +82-31-900-0265 Fax: +82-31-900-0343 E-mail: [email protected] Received: 20 September 2015 Revised: 13 October 2015 Accepted: 25 October 2015
This is an open-access article distributed under the terms of the Creative Commons Attribu tion Non-Commercial License (http://
crea tivecom mons.org/licenses/bync/3.0/) which permits unrestricted non-commercial use, distribution, and reproduction in any medium, provided the original work is properly cited.
Copyright © 2015 The Korean Society of Pediatric Nephrology
Introduction
Kawasaki disease (KD) is a systemic vasculitis involving multiple organs, and it can cause coronary artery lesions (CALs), carditis, hepatitis, arthritis, and central nervous system diseases
1). CALs are one of the most serious complications associated with KD. Characteristic clinical symptoms of KD are prolonged fever, bilateral conjunctival injection, cervical lymphadenopathy, erythematous induration of palms and soles, mucocutaneous changes in oropharynx and lips, and polymorphous skin rashes
1,2).
There have been many reports showing that patients with KD had leukocy
tosis and elevated erythrocyte sedimentation rate (ESR) and Creactive
protein (CRP) levels, which were associated with CALs
3,4). However, there
have been a few reports on the significance of hyponatremia in patients with
KD
59). The previous studies were also conducted in a small number of
patients, rarely analyzed the correlations between serum sodium levels and
other inflammatory parameters of KD, or were not analyzed by multivariate analysis
59). The aims of the present study were to investigate the risk factors for the development of CALs and determine whether hypona tremia could be associated with CALs in Korean children with KD.
Materials and methods
We retrospectively analyzed the data of 105 children (37 girls and 68 boys; mean age, 2.35 ± 2.1 years) with KD admitted to National Health Insurance System (NHIS) Ilsan Hospital between January 2000 and July 2011. The children were divided into the following groups: KD children with and without hyponatremia, and KD children with and without CALs.
Medical charts were reviewed for clinical characteri
stics, including patient age, sex, duration of fever, and presence of CALs during the clinical course. Laboratory data on admission included complete blood cell count (CBC), ESR, CRP, serum sodium, potassium, chloride, total carbon dioxide (tCO2), blood urea nitrogen (BUN), creatinine, total protein, albumin, cholesterol, uric acid, aspartate aminotransferase (AST), alanine aminotran s
ferase (ALT), lactate dehydro genase (LDH), total bilirubin, calcium, phosphorus, creatine kinase (CK), CKMB, and urinalysis.
Serum sodium levels were measured with the Ion selec
tive electrode (ISE) method using a Hitachi 747 chemistry analyzer (Hitachi Inc., Tokyo, Japan) and Unicel DxC 800 (Beacman Coulter Inc., Brea, CA, USA). Complete blood counts including platelet counts were immediately analyzed within 2 hour by Sysmex XE2100 (Sysmex Corp., Kobe, Japan). CRP levels were measured with the latexenhanced turbid imetric assay method using a Hitachi 747 chemistry analyzer and Unicel DxC 800. ESRs were measured using Sysmex VESMatic cube. Strict quality control procedures were adopted. Echocardio graphy was performed in all the children with KD to detect CALs.
KD was diagnosed if children had a fever (temperature,
>38°C) for at least 5 days in addition to at least four of the following: (1) changes in the mucous membranes of the upper respiratory tract, including injected pharynx, injected or fissured lips and strawberry tongue, (2) bilateral conjunctival injections, (3) cervical lymphadenopathy, (4)
polymorphous rash, and (5) changes in the extremities, including peripheral edema or erythema, and periungual desquamation
1,2).
Hyponatremia was defined as a serum sodium concen
tra tion (Na+) ≤135 mEq/L. CALs were defined as either an internal diameter of the coronary artery lumen >3 mm in a child <5 years of age or >4 mm in a child ≥5 years of age, the internal diameter of a segment being at least 1.5 times larger than that of an adjacent segment, or the presence of a clearly irregular lumen
10,11). Intravenous immunoglo
bulin (IVIG) was defined when additional rescue therapies were required owing to persistent or recrudescent fever (≥38.0 or 100.4℉) at least 48 hours after the end of initial IVIG infusion
12).
All data were analyzed using Statistical Package for the Social Sciences (SPSS) for Windows, version 20.0 (SPSS Inc., Chicago, IL, USA). The data were expressed as mean
± standard deviation (SD). Univariate analysis was performed using the independent ttest and chisquare test. Correlation analysis was performed to determine the relationship between two variables using Pearson correla
tion. A comparison between two paired groups was performed using the paired ttest. Multiple logistic regression analyses were performed to identify the independent risk factors for CALs in children with KD. Statistical significance was set at a Pvalue of <0.05.
This study design and the use of patients’ information stored in the hospital database were approved by the Institu
tional Review Board (IRB) at NHIS Ilsan Hospital. We were given exemption from getting informed consents by the IRB because the present study was a retrospective study and personal identifiers were completely removed and the data were analyzed anonymously. Our study was conducted according to the ethical standards laid down in the 1964 Declara tion of Helsinki and its later amendments.
Results
Clinical characteristics were not significantly different between KD children with CALs and those without (Table 1).
However, IVIGresistance was significantly higher (32.4%
vs. 8.8%, P = 0.003) in KD children with CALs than those
without. ESR levels were higher (50.3 ± 39.4 mm/hr vs. 24.8
Table 1. Clinical characteristics of KD patients with or without coronary artery lesions (CALs)
CALs (n= 37) No CALs (n=68) P-value
Age (yrs) 2.3 ± 2.2 2.4 ± 2.1 0.844
Sex (M:F) 27 : 10 41 : 27 0.209
Fever before IVIG (days) 5.0 ± 1.9 5.0 ± 2.0 0.919
Fever after IVIG (days) 1.9 ± 2.4 1.7 ± 1.8 0.685
Strawberry tongue 29 (78.4%) 48 (70.6%) 0.490
Conjunctival injection 30 (81.1%) 56 (82.4%) 1.000
Cervical lymphadenopathy 24 (64.9%) 42 (61.8%) 0.834
Polymorphous rash 37 (81.1%) 49 (72.1%) 0.352
Periungual desquamation 24 (64.9%) 34 (50.0%) 0.157
IVIG resistance 12 (32.4%) 6 (8.8%) 0.003*
IVIG: intravenous immunoglobulin, CALs: coronary artery lesions
*P-value of <0.05
Table 2. Laboratory findings of KD patients with or without CALs
CALs (n= 37) No CALs (n=68) P-value
WBC (/μL) 14,164 ± 5,444 13,250 ± 5,650 0.424
ESR (mm/hr) 50.3 ± 39.4 24.8 ± 18.8 0.013*
CRP (mg/dL) 8.3 ± 6.3 8.2 ± 6.3 0.964
Neutrophil (%) 70.3 ± 14.5 65.4 ± 16.9 0.142
Lymphocyte (%) 21.3 ± 11.3 26.5 ± 14.6 0.063
Monocyte (%) 6.2 ± 3.6 6.1 ± 4.3 0.835
Hb (g/dL) 11.1 ± 1.1 11.3 ± 0.9 0.200
Hct (%) 32.7 ± 3.1 33.4 ± 2.8 0.293
PLT (10×3/μL) 331 ± 123K 325 ± 100K 0.795
Sodium (mmol/L) 134 ± 2.8 135 ± 3.0 0.027*
Potassium (mmol/L) 4.2 ± 0.8 4.3 ± 0.6 0.216
Chloride (mmol/L) 101 ± 4.0 102 ± 3.8 0.221
tCO2 (mmol/L) 18.2 ± 3.5 19.4 ± 2.7 0.041*
BUN (mg/dL) 10.5 ± 5.8 9.1 ± 3.8 0.130
Creatinine (mg/dL) 0.6 ± 1.1 0.4 ± 0.1 0.107
AST (IU/L) 177 ± 307 94 ± 121 0.051
ALT (IU/L) 178 ± 181 120 ± 136 0.068
Total protein (g/dL) 6.8 ± 3.3 6.5 ± 0.5 0.468
Albumin (g/dL) 3.3 ± 0.7 3.6 ± 0.5 0.066
Uric acid (mg/dL) 4.3 ± 1.7 3.7 ± 1.4 0.082
Cholesterol (mg/dL) 136 ± 40.0 135 ± 28.0 0.842
Calcium (mg/dL) 12.7 ± 20.1 9.5 ± 0.6 0.192
Phosphorus (mg/dL) 3.9 ± 1.1 4.1 ± 1.0 0.391
CK (IU/L) 70 ± 79 106 ± 180 0.249
CK-MB (ng/mL) 2.6 ± 4.0 1.8 ± 1.9 0.202
LDH (IU/L) 319 ± 122 305 ± 127 0.584
Total bilirubin (mg/dL) 1.5 ± 1.4 0.9 ± 1.1 0.017*
WBC: white blood cell, ESR: erythrocyte sedimentation rate, CRP: C-reactive protein, Hb: hemoglobin, Hct: hematocrit, PLT: platelet, tCO2: total carbon dioxide, BUN: blood urea nitrogen, AST: aspartate aminotransferase, ALT: alanine aminotransferase, CK: creatine kinase, LDH: lactate dehydrogenase
* P-value of <0.05
± 18.8 mm/hr, P = 0.013), sodium levels were lower (134 ± 2.8 mmol/L vs 135 ± 3.0 mmol/L, P = 0.027), tCO2 levels were lower (18.2 ± 3.5 mmol/L vs. 19.4 ± 2.7 mmol/L, P = 0.041) and total bilirubin levels were higher (1.5 ± 1.4 mg/dL vs. 0.9 ± 1.1 mg/dL, P = 0.017) in KD children with CALs than those without (Table 2).
Clinical characteristics were not significantly different between KD children with hyponatremia and those without (Table 3). However, CALs were significantly higher (47.8%
vs 28.4%, P = 0.034) in KD children with hyponatremia than those without. In KD children with hyponatremia, white blood cell (WBC) counts were higher (15,355 ± 6,159/
μL vs. 12,335 ± 4,794/μL, P = 0.006), neutrophil counts were higher (72.6 ± 13.8% vs. 63.2 ± 16.8%, P = 0.003), lym p hocyte counts were lower (20.2 ± 10.5% vs. 27.7 ± 14.8%, P = 0.005), neutrophillymphocyte ratio were higher (5.1 ± 4.1 vs. 3.6 ± 3.2, P = 0.048), chloride levels were lower (100 ± 3.8 mmol/
L vs. 103 ± 3.6 mmol/L, P = 0.001), tCO2 levels were lower (18.1 ± 3.1 mmol/L vs. 19.6 ± 2.9 mmol/L, P = 0.013), albumin levels were lower (3.3 ± 0.5 g/dL vs. 3.6 ± 0.6 g/dL, P = 0.009), uric acid levels were higher (4.3 ± 1.8 mg/dL vs.
3.7 ± 1.3 mg/dL, P = 0.037), and phosphorus levels were lower (3.6 ± 0.9 mg/dL vs. 4.3 ± 1.0 mg/dL, P = 0.001) than those without hyponatremia (Table 4).
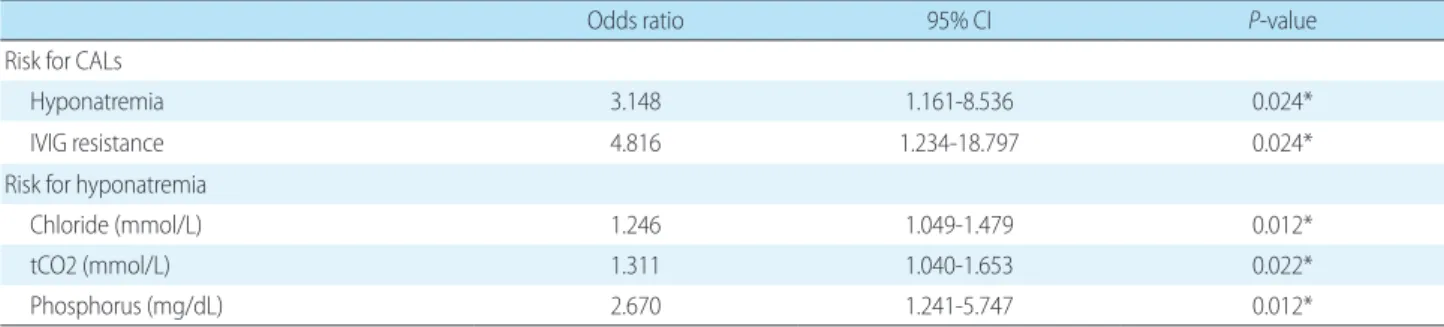
On multiple logistic regression analysis, hyponatremia (Odd ration (OR) = 3.148, 95% confidence interval (CI)
1.1618.536, P = 0.024) and IVIG–resistance (Odd ratio = 4.816, 95% CI 1.23418.797, P = 0.024) were independent risk factors for CALs in children with KD. Also, low serum chloride levels (Odd ratio = 1.246, 95% CI 1.0491.479, P = 0.012), low serum tCO2 levels (Odd ratio = 1.311, 95% CI 1.0401.653, P = 0.022) and low serum phosphorus levels (Odd ratio = 2.670, 95% CI 1.2415.747, P = 0.012) were indepen dent risk factors for the development of hypona
tremia in children with KD (Table 5).
Furthermore, serum sodium levels were correlated negatively with WBC counts (r = 0.276, P = 0.004), neutro
phil counts (r = 0.414, P < 0.001), lymphocyte counts (r = 0.398, P <0.001), neutrophillymphocyte ratio (r = 0.348, P <0.001), total bilirubin levels (r = 0.280, P = 0.005) and positively with albumin levels (r = 0.255, P = 0.009) (Table 6). However, IVIG–resistance was not correlated with WBC counts (P = 0.287), ESR levels (P = 0.160), CRP levels (P = 0.268), total bilirubin levels (P = 0.999) and albumin levels (P = 0.230).
Changes in serum sodium levels (Na levels at the con
vales cent phase – Na levels at the acute phase, ΔNa) correlated positively with changes in lymphocyte counts (Δlympho
cyte) (r = 0.236, P = 0.019), chloride (Δchloride) (r = 0.517, P <0.001), tCO2 levels (ΔtCO2) (r = 0.227, P = 0.020) and negatively with neutrophil counts (Δneutrophil) (r = 0.230, P = 0.022), neutrophillymphocyte ratio (Δneutrophil
Table 3. Clinical characteristics of KD patients with or without hyponatremia
Hyponatremia (n=43) No hyponatremia (n=62) P-value
Age (yrs) 2.1 ± 2.2 2.5 ± 2.3 0.286
Sex (M:F) 27 : 16 44 : 18 0.392
Fever before IVIG (days) 5.0 ± 1.3 5.0 ± 2.2 0.935
Fever after IVIG (days) 1.5 ± 1.3 1.8 ± 1.3 0.576
Strawberry tongue 37 (80.4%) 48 (71.6%) 0.287
Conjunctival injection 39 (84.8%) 55 (82.1%) 0.707
Cervical lymphadenopathy 28 (60.9%) 41 (61.2%) 0.972
Polymorphous rash 36 (78.3%) 47 (70.1%) 0.337
Periungual desquamation 27 (58.7%) 35 (52.2%) 0.498
IVIG resistance 8 (17.4%) 11 (16.4%) 0.892
CALs 22 (47.8%) 19 (28.4%) 0.034*
Pyuria 25 (54.3%) 33 (49.3%) 0.595
Glucosuria 9 (19.6%) 9 (13.4%) 0.381
Hematuria 9 (19.6%) 9 (13.4%) 0.381
Proteinuria 4 (8.7%) 7 (10.4%) 0.758
IVIG: intravenous immunoglobulin, CALs: coronary artery lesions
*P-value of <0.05
lymphocyte ratio) (r = 0.263, P = 0.019), AST levels (ΔAST) (r = 0.271, P = 0.018) (Table 7). Changes in serum sodium levels were negatively correlated with changes in inflamma tory markers.
Discussion
Table 4. Laboratory findings of KD patients with or without hyponatremia
Hyponatremia (n=43) No hyponatremia (n=62) P-value
WBC (/μL) 15,355 ± 6,159 12,335 ± 4,794 0.006*
ESR (mm/hr) 47.4 ± 23.6 40.4 ± 20.0 0.106
CRP (mg/dL) 9.2 ± 7.0 7.5 ± 5.7 0.245
Neutrophil (%) 72.6 ± 13.8 63.2 ± 16.8 0.003*
Lymphocyte (%) 20.2 ± 10.5 27.7 ± 14.8 0.005*
Neutrophil-Lymphocyte ratio 5.1 ± 4.1 3.6 ± 3.2 0.048*
Hb (g/dL) 11.0 ± 1.0 11.4 ± 1.0 0.092
Hct (%) 32.4 ± 2.7 33.6 ± 2.9 0.03*
PLT (10×3/μL) 331 ± 129K 324 ± 92K 0.765
Potassium (mmol/L) 4.2 ± 0.7 4.3 ± 0.7 0.297
Chloride (mmol/L) 100 ± 3.8 103 ± 3.6 0.001*
tCO2 (mmol/L) 18.1 ± 3.1 19.6 ± 2.9 0.013*
BUN (mg/dL) 9.5 ± 3.6 9.7 ± 5.2 0.852
Creatinine (mg/dL) 0.4 ± 0.1 0.5 ± 0.9 0.574
AST (IU/L) 144 ± 254 109 ± 173 0.411
ALT (IU/L) 154 ± 178 130 ± 138 0.446
Total protein (g/dL) 6.2 ± 0.6 6.8 ± 2.6 0.117
Albumin (g/dL) 3.3 ± 0.5 3.6 ± 0.6 0.009*
Uric acid (mg/dL) 4.3 ± 1.8 3.7 ± 1.3 0.037*
Cholesterol (mg/dL) 132 ± 34 138 ± 31 0.360
Calcium (mg/dL) 9.3 ± 0.6 11.5 ± 15.6 0.344
Phosphorus (mg/dL) 3.6 ± 0.9 4.3 ± 1.0 0.001*
CK (IU/L) 67 ± 77 112 ± 187 0.140
CK-MB (ng/mL) 2.0 ± 2.9 2.1 ± 2.8 0.848
LDH (IU/L) 298 ± 87 318 ± 145 0.434
Total bilirubin (mg/dL) 1.4 ± 1.3 1.0 ± 1.1 0.132
WBC: white blood cell, ESR: erythrocyte sedimentation rate, CRP: C-reactive protein, Hb: hemoglobin, Hct: hematocrit, PLT: platelet, tCO2: total carbon dioxide, BUN: blood urea nitrogen, AST: aspartate aminotransferase, ALT: alanine aminotransferase, CK: creatine kinase, LDH: lactate dehydrogenase
*P-value of <0.05
Table 5. Multiple logistic regression analysis of laboratory parameters associated with the development of CALs and hyponatremia
Odds ratio 95% CI P-value
Risk for CALs
Hyponatremia 3.148 1.161-8.536 0.024*
IVIG resistance 4.816 1.234-18.797 0.024*
Risk for hyponatremia
Chloride (mmol/L) 1.246 1.049-1.479 0.012*
tCO2 (mmol/L) 1.311 1.040-1.653 0.022*
Phosphorus (mg/dL) 2.670 1.241-5.747 0.012*
CALs: coronary artery lesions, IVIG: intravenous immunoglobulin, tCO2: total carbon dioxide
*P-value of <0.05
Our study is the first study which showed that hypona
tremia was an independent risk factor for the development of CALs in KD using multivariate analyses and it was also closely associated with other well known inflammatory markers of KD such as WBC count, ESR, and serum albumin level. Although WBC count, CRP, low serum albumin levels, or elevated serum ALT were reported to be associated with the development of CALs in KD
13,14), these biomarkers were not statistically significant between children with KD and those without KD in our study.
Although previous studies exhibited that increased CRP and total bilirubin on admission were indicated as signifi
cant predictors for IVIG resistance and serum albumin levels before IVIG treatment were also suggested to be a useful predictor of IVIG resistance in patients with KD
15,16), we did not find any significant difference between the two groups. These contrasting results may be due to different ethnic groups and disease severities among studies. We also intended to investigate the independent risk factors for the development of hyponatremia in KD and found that low serum chloride, tCO2 levels, and hypophosp
hatemia were independent risk factors for hyponatremia, which has not been analyzed and reported previously.
Although the pathogenesis of hyponatremia in KD still remains elusive, some plausible explanations have been proposed. Firstly, as we previously hypothesized, hyponat
remia can be a result of ADH excess caused by inflamm
atory cytokines such as interleukin (IL)1β, IL6, and tumor necrosis factor (TNF)α
17). IL1β and IL6 have been known to activate the magnocellular ADHsecreting neurons, leading to SIADH
18). Activation of CD8+ Tcells and
macrophages are thought to play a central role in the develop ment of hyponatremia, which results from elevated concentrations of IL1, IL6, IL8, and TNF α secreted by the CD8+ Tcells
1). Secondly, these inflamma tory mediators can cause hyponatremia by inhibiting the function of the apical epithelial sodium channel and/or sodium potassium adenosine triphosphatase at the baso lateral membrane of renal epithelial cells
19). Not only renal epithelial cells but also tubular dysfunction occurs in im paired proximal, distal, and collecting tubules due to severe renal interstitial inflammation, which causes hypona tremia. Thirdly, this is also related to renal tubular unres ponsi veness to aldosterone in late distal and cortical collec ting tubules, leading to secondary pseudohy p oa ld o st eronism
20), because KD can also involve renal tubules
21). Finally, increased concentra
tions of atrial and brain natriuretic peptide (ANP; BNP) can cause hyponatremia and natriuresis by inhibiting tubular reabsorption of sodium
22,23).
We speculate that hypophosphatemia which was found to be an independent risk factor for the development of hyponatremia in our study might be caused by renal loss of phosphorus, because urinary phosphorus is mainly reabsor
bed by proximal tubules and tubular injury by KD could lead to urinary phosphate wasting. To confirm its patho genesis, however, assessment of urine output, urinary electrolytes, phosphorous, creatinine, osmolality, serum ADH levels, and plasma rennin and aldosterone concen tration should be investigated in the future randomized, prospective, and controlled study.
In our study, low tCO2 levels were more common in KD children with hyponatremia than in those without, presu
mably indicating hypovolemic hyponatremia, which was Table 7. Correlation between changes in serum sodium levels and changes in laboratory parameters (Δchanges in parameters)
Correlation coefficient P-value
ΔWBC (/μL) -0.108 0.288
ΔNeutrophil (%) -0.230 0.022*
ΔLymphocyte (%) 0.236 0.019*
ΔNeutrophil-Lymphocyte ratio -0.263 0.009*
ΔChloride (mmol/L) 0.517 <0.001*
ΔtCO2 (mmol/L) 0.227 0.020*
ΔAST (IU/L) -0.271 0.018*
WBC: white blood cell, tCO2: total carbon dioxide, AST: aspartate aminotransferase
*P-value of <0.05
Table 6. Correlation between serum sodium levels and
laboratory parameters
Correlation coefficient P-value
WBC (/μL) -0.276 0.004*
ESR (mm/hr) -0.125 0.203
CRP (mg/dL) -0.193 0.082
Neutrophil (%) -0.414 <0.001*
Lymphocyte (%) 0.398 <0.001*
Neutrophil-Lymphocyte ratio -0.348 <0.001*
Albumin (g/dL) 0.255 0.009*
Total bilirubin (mg/dL) -0.280 0.005*
WBC: white blood cell, ESR: erythrocyte sedimentation rate, CRP:
C-reactive protein
*P-value of <0.05