1)
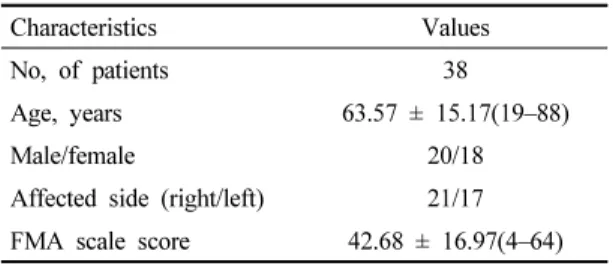
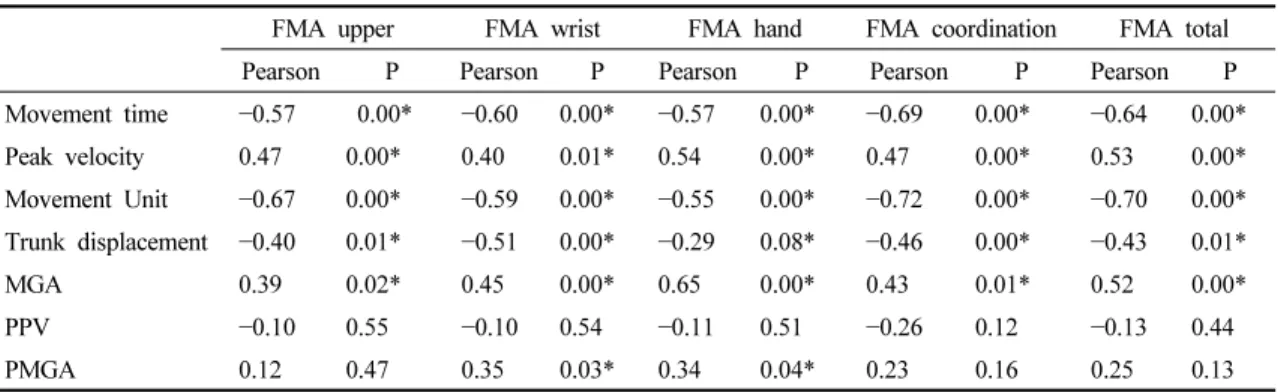
Relationship Between a New Functional Evaluation Model and the Fugle-Meyer Assessment Scale for Evaluating the Upper Extremities of Stroke Patients
9
0
0
전체 글
(2)
(3)
(4)
(5)
(6)
(7)
(8)
(9)
수치
관련 문서
Modern Physics for Scientists and Engineers International Edition,
If both these adjustments are considered, the resulting approach is called a bootstrap-BC a -method (bias- corrected-accelerated). A description of this approach
③ A student who attended Korean course at KNU Korean Language Program and holds TOPIK Level 3 or a student who completed Korean course Level 4 at the KNU Korean Language
· 50% exemption from tuition fee Ⅱ for the student with a TOPIK score of level 3 or higher or completion of level 4 or higher class of the Korean language program at the
14 For individuals with a triglyceride concentration of 200–499 mg/dL, pharmacological therapy should be considered to lower triglyceride concentration after
웹 표준을 지원하는 플랫폼에서 큰 수정없이 실행 가능함 패키징을 통해 다양한 기기를 위한 앱을 작성할 수 있음 네이티브 앱과
_____ culture appears to be attractive (도시의) to the
The key issue is whether HTS can be defined as the 6th generation of violent extremism. That is, whether it will first safely settle as a locally embedded group
