I. Introduction
Over the past decades, the data collected in the intensive care units (ICUs) has grown exponentially and been used selectively in data mining studies [1]. However, the large amounts of data are still underutilized for the care of criti- cally ill patients in the ICUs. Moreover, considering the un- availability and lack of human experts for various reasons, busy or novice physicians can overlook important details, while automated discovery tools built on various prediction models could analyze the raw data and extract high-level information for the decision maker enabling better decisions [2]. Likewise the ICU setting is particularly well suited for an implementation of a data-driven system which acquires a
A Comparison of Intensive Care Unit Mortality
Prediction Models through the Use of Data Mining Techniques
Sujin Kim, PhD1, Woojae Kim, MS2, Rae Woong Park, MD2
1College of Communication and Information Studies and Department of Pathology and Laboratory Medicine, University of Kentucky, Lexington, KY, USA;
2Department of Biomedical Informatics, Ajou University School of Medicine, Suwon, Korea
Objectives: The intensive care environment generates a wealth of critical care data suited to developing a well-calibrated prediction tool. This study was done to develop an intensive care unit (ICU) mortality prediction model built on University of Kentucky Hospital (UKH)’s data and to assess whether the performance of various data mining techniques, such as the artificial neural network (ANN), support vector machine (SVM) and decision trees (DT), outperform the conventional lo- gistic regression (LR) statistical model. Methods: The models were built on ICU data collected regarding 38,474 admissions to the UKH between January 1998 and September 2007. The first 24 hours of the ICU admission data were used, including patient demographics, admission information, physiology data, chronic health items, and outcome information. Results:
Only 15 study variables were identified as significant for inclusion in the model development. The DT algorithm slightly outperformed (AUC, 0.892) the other data mining techniques, followed by the ANN (AUC, 0.874), and SVM (AUC, 0.876), compared to that of the APACHE III performance (AUC, 0.871). Conclusions: With fewer variables needed, the machine learning algorithms that we developed were proven to be as good as the conventional APACHE III prediction.
Keywords: APACHE, Intensive Care Units, Neural Networks, Decision Trees, Support Vector Machines
Healthc Inform Res. 2011 December;17(4):232-243.
http://dx.doi.org/10.4258/hir.2011.17.4.232 pISSN 2093-3681 • eISSN 2093-369X
Submitted: October 17, 2011 Revised: December 12, 2011 Accepted: December 22, 2011 Corresponding Author Sujin Kim, PhD
Division of Biomedical Informatics, College of Public Health, School of Library and Information Science, College of Communication and Information Studies, University of Kentucky, 339 Lucille Little Build- ing, Lexington, KY 40506-0224, USA. Tel: +1-859-257-8657, Fax:
+1-859-257-4205, E-mail: [email protected]
This is an Open Access article distributed under the terms of the Creative Com- mons Attribution Non-Commercial License (http://creativecommons.org/licenses/by- nc/3.0/) which permits unrestricted non-commercial use, distribution, and reproduc- tion in any medium, provided the original work is properly cited.
ⓒ 2011 The Korean Society of Medical Informatics
large quantity of data to discover relationships for diagnos- tic, prognostic, and therapeutic factors using well-designed, predictive data mining models.
However, development of a clinically applicable and scien- tifically accurate critical care prediction tools is not an easy task, considering issues involved with complex data collec- tion and inconsistent analysis methods. For instance, some data are not objectively measured (or recorded) which are then not recorded in a standardized format (e.g., categories of admitting diagnosis, categories of underlying chronic health issues, etc). Additionally, some data require constant updates at a reasonable interval range (e.g., daily physi- ological values, active treatment including medication and procedures performed, etc). Moreover, challenges that are directly relevant to different data mining methods and sci- entific validation for the produced results must be rigorously tested so that the predictive model can be applied in a criti- cal care setting. A standard statistical method such as logistic regression has been well received by critical care profes- sionals to predict the risk of mortality or adverse events for patients with critically illnesses or injuries admitted to ICU [3-7]. However, these predictions are not accurate enough for individual patients and no tools exist to reliably predict an individual patient’s progress on a critical care condition in a timely manner. Currently, new prediction approaches using machine learning algorithms, such as artificial neural networks (ANNs) and decision trees (DTs), have resulted in a number of prediction models in different critical care set- tings [8-14]. However, an evaluation of the performance is still under discussion and very few studies have paid atten- tion to reporting on the handling of missing and noise data, treatment of different types of data, and data dimension re- duction techniques.
Therefore, it is our goal to develop a critical care mortality prediction model by comparing new computational tech- niques including ANN, support vector machine (SVM), and DT to a conventional standard technique, the logistic regres- sion model. To derive a well-performed, predictive model that uses various critical care data extracted from a large number of representative samples, University of Kentucky Hospital (UKH)’s ICU data was tested and the resulting models were assessed on their prediction performances.
II. Methods
Three study goals to achieve are: 1) to construct an ICU pre- diction model given the UKH-ICU study population and ex- plore to what extent the constructed model can confirm pre- vious results obtained from the previous logistic regression
(LR)-based APACHE III prediction models; 2) to identify relevant clinical input factors for the ICU prediction models by using Logistic Regression; and 3) to compare prediction performance between DT, ANN, SVM, to LR. In this com- parison, the measures of performance were assessed using the area under the receiver operating characteristic (ROC) curve (AUC). The following sections describe study setting and participants, variables included, and data analysis tech- niques used.
1. Study Setting and Participants
The study data used in this study were retrospectively col- lected from 23,446 patients (on 38,474 admissions) admitted to the UKH located in Lexington, KT, USA between Janu- ary 1998 to September 2007. The UKH is a 489-bed, state- operated, teaching academic and tertiary referral hospital.
Over the past decades, the UKH has collected patients’ ICU data and the trained APACHE nursing staffs has carefully entered the data into the APACHE III Critical Care system [15]. According to the UKH APACHE data collection guide- line, the patients under 20 years old, burned patients, several transplant patients except for renal and liver transplants, and patients with an ICU stay of less than four hours are not included in the APACHE system, Therefore, our study data does not include those cases in our analysis. Of the selected data, half of them (n = 19,227, 50%) were randomly selected and designated as training data set to be used for prediction models construction, and the remaining half (n = 19,247, 50%) was used to test the performance of the constructed models (testing data set). Thus, both training and testing data set are mutually exclusive. Approval from University of Kentucky’s institutional review board, which meets federal criteria to qualify for exemption certification, was obtained.
Therefore, patient identifiable data were removed before the data was available for the study.
2. Study Variables
The variable sets used in this study are shown in Table 1. It contains variable names, description and exemplary data values, and selected study variables to build the best predic- tion model for our study. For the listed 41 variables includ- ing outcome (survival status: 1 refers to death, 0 refers to alive) are listed in the first column by five variable categories such as demographic/admission, chronic health, physiology, cardiac, and outcome sections. The Yes mark in APACHE III column of Table 1 refers to the variables for LR-based APACHE III prediction model, while the Study Variables column refers to those variables used to build the mortal- ity prediction for our study. Those study variables were first
Table 1. University of Kentucky Hospital intensive care unit (ICU) variables used in the study Variable name
(V = 40) Description
APACHE III variables
(V = 22)
Study variables
(V = 15)
p-value Demographic/Admission Information
Age Patient’s calculated age based on the hospital admission date. Yes <0.001b
Gender Patient’s race including male or female. 0.308a
Race Patient’s race including American Indian, Asian, Black, Hispanic, other, White.
0.077a Physiology reserved points A calculated field of age weight plus chronic (0-40). Yes <0.001b Admit category A calculated field of monitoring risk depending on active treat-
ment given. Between 0-4 values is assigned.
Yes <0.001a Admit service Indicate the clinical service of the physician who is directing the
patient’s care in the ICU, 31 sites specific values are included.
<0.001a Readmit Indicate Y or N, if the patient meets the APACHE readmission
definition.
<0.001a Admit source Indicate one of seven designated locations from which the patient
was directly admitted to the ICU.
Yes <0.001a
Chronic Health Information
Disease group The specific disease category that the individual admitting diag- nosis codes map to (0-103).
Yes Yes <0.001a Chronic health item Code assigned to the chronic health item (0-16). Yes Yes <0.001a Elective surgery If the patient has a surgical diagnosis, indicate whether the sur-
gery is elective by selecting 1 (Yes) or not 0 (No).
Yes <0.001a On dialysis 1 (Yes) or not 0 (No) field as to whether or not the patient is on
dialysis.
0.373a Physiology Information
Temperature The worst temperature for patient (20-43). Yes 0.512b
Mean arterial pressure (MAP) The worst MAP. Diastolic blood pressure (0-250) and systolic blood pressure (0-400).
Yes Yes <0.001b
Heart rate The worst heart rate value (1-300). Yes <0.001b
Respiratory rate (RR) The worst respiratory rate (range, 1-100). Yes Yes <0.001b
Ventilation Mechanically ventilated with worst RR, 1 (Yes) or 0 not (No) field.
Yes <0.001a
Glasgow Coma Score (GCS) The worst GCS, neurologic assessment is the sum of GCS-eyes, motor and verbal (3-15).
Yes Yes <0.001b GCS on medication Check only if unable to obtain GCS due to Meds, anesthesia, or
sedation. This is a 1 (Yes) or not 0 (No) field.
Yes <0.001a
Urine out Calculated 24-hr urine output equivalent (0-20,000). Yes <0.001b
White blood cell The worst white blood cell count (0.01-200). Yes Yes <0.001b
Hematocrit The worst hematocrit value (5-100). Yes <0.001b
Sodium The worst sodium value (80-200). Yes <0.001b
Blood urea nitrogen The worst blood urea nitrogen value (1-255). Yes <0.001b
Creatinine The worst creatinine value (0.1-25). Yes <0.001b
Glucose The worst serum glucose value (1-3,000). Yes <0.001b
Albumin The worst albumin value (0.8-10). Yes Yes <0.001b
Bilirubin The worst bilirubin value (0.01-75). Yes Yes <0.001b
Arterial blood gas (ABG) The worst ABG assign score based upon Intubated-Fio2-PaO2- PaCO2 relationship (0-15).
Yes Yes <0.001b Aid-base abnormalities (ABA) The worst ABA score based upon pH-pCO2 relationship (0-12). Yes Yes <0.001b
aSign denotes Pearson’s chi-square test values less than 0.05 and bsign denotes Student’s t-test values less than 0.01.
selected based on Pearson’s chi-square test for categorical variables and t-test for continuous variables (p-value < 0.05).
The logistic regression (Forwarding) was then performed to finalize the study variables, which resulted in 15 variables checked in Table 1. All the acceptable data value ranges used in the study comply with the Cerner’s APACHE III Critical Care system [15].
The distribution of cases used in the study is outlined in Table 2, which includes APACHE III scores, age, gender, ethnic, admission type, and admission origin that remained unchanged during the patient’s admission [16]. The variables encompass admission information, physiological variables, and chronic conditions. The ICU death outcomes, such as APACHE III scores and mortality, were also recorded. Physi- ological variables extracted from the APACHE critical care system were manually entered within the defined physiol- ogy data midpoints and acceptable data entry range. Some physiology data such as arterial blood gases (ABG)-related variables (ABG_Intubated, ABG_FiO2, ABG_PaO2, ABG_
PaCO2, and ABG_pH) were aggregated into two variables (ABG_PaO2 and AaDO2) in accordance with APACHE methodology to record the worst ABG. Glasgow Coma Score (GCS) variables were combined into a compound score.
Remaining data was carefully audited for outliers, errone- ous, and missing values. Missing data for the continuous variables were estimated with simple imputations using the median non-missing value. The method used to reduce di- mensions (variables) is LR from SPSS PASW statistics (SPSS Inc., Chicago, IL, USA).
3. Measurements and Data Analysis
The primary outcome variable was the vital status (death or alive) at the time of ICU discharge captured in the APACHE III critical care system. APACHE uses only variables and data that are captured within the first 24 hours of ICU ad- mission as accepted as conventional predictor variables.
Therefore, the study did not capture changes in physiological status and the relative contributions of age and comorbidi- ties. Given the same variables, the study compared the pre- dictive accuracy of ANN, SVM, and DT derived from UKH’s ICU patients’ data with the APACHE III scoring system. The probability of ICU outcome prediction, p was derived from the APACHE III equation given in the section 1 of Knaus’
paper [4].
The ANN architecture used in the study was a back-prop- agation network with two-hidden layers, a layer between Table 1. Continued
Variable name
(V = 40) Description
APACHE III variables (V = 22)
Study variables
(V = 15)
p-value
Cardiac Information
CABG_IG For coronary artery bypass graft (CABG), whether the internal mammary artery graft performed, 1 (Yes) or not 0 (No).
<0.001a
CABG_Grafts For CABG, a total number of bypass grafts done (0-6). <0.001a
CABG_MI 1 (Yes) or not 0 (No) field whether patient had myocardial in- farction (MI) during this hospitalization.
<0.001a CABG_CC 1 (Yes) or not 0 (No) field whether patient had a cardiac cath-
eterization (CC) during this hospitalization.
<0.001a
Total grafts A total number of graft (0-6) done. <0.001b
Left ventricular ejection fraction
In the field for pre-op left ventricular ejection fraction (%) indi- cates a number between 0.0 and 99.00.
Yes <0.001a
Myocardial infarction within 6 mo
1 (Yes) or not 0 (No) field whether or not the patient has had an MI within the last 6 mo.
<0.001a
Cardiac event occurred Indicates either a cardiac event occurred 1 (Yes) or not 0 (No). <0.001a Location of cardiac event Location code of cardiac event occurred (0-7). <0.001a Prediction Outcome Information
Death status Whether patient occurred a death 1 (Yes) or not 0 (No). Yes Yes
aSign denotes Pearson’s chi-square test values less than 0.05 and bsign denotes Student’s t-test values less than 0.01.
Table 2. Characteristic of the study participants admitted to University of Kentucky Hospital intensive care unit
Variables Training set Testing set p-value
Age (yr) 55.51 ± 15.88 55.41 ± 16.06 0.25
Gender (male) 11,432 (59.92) 11,608 (59.85) 0.65
Race 0.97
White 17,199 (90.14) 17,465 (90.05)
African-American 1,373 (7.25) 1,341 (6.91)
Hispanic 151 (0.79) 179 (0.92)
Asian 49 (0.26) 48 (0.25)
American Indian 20 (0.1) 10 (0.05)
Other 234 (1.23) 281 (1.45)
APACHE III score 52.88 ± 28.08 52.76 ± 28.12 0.73
Intensive care unit length of stay in days 4.78 ± 8.58 4.9 ± 9.98 0.79
Outcome 0.37
Survival 17,143 (89.16) 17,106 (88.88)
Death 2,084 (10.84) 2,141 (11.12)
Operative status 0.08
Non-operative 12,294 (64.43) 12,574 (64.83)
Post-elective 4,867 (25.51) 4,910 (25.32)
Post-emergency surgery 1,838 (10.06) 1,806 (9.85)
Chronic health 0.92
Not present 7,265 (38.08) 7,509 (38.72)
Diabetes mellitus 3,421 (17.93) 3,463 (17.86)
Immunosuppression 2,581 (13.53) 2,669 (13.76)
Dialysis 611 (3.2) 613 (3.16)
Cirrhosis 522 (2.74) 490 (2.53)
Solid tumor with metastasis 510 (2.67) 470 (2.42)
Hepatic failure 353 (1.85) 369 (1.9)
Leukemia 183 (0.96) 157 (0.81)
Unavailable 88 (0.46) 97 (0.5)
Lymphoma 67 (0.35) 80 (0.41)
10 most common disease group 0.95
Coronary artery bypass grafting 966 (5.06) 894 (4.61)
Congestive heart failure 785 (4.11) 812 (4.19)
Acute myocardial 762 (3.99) 723 (3.73)
Respiratory-other 736 (3.86) 721 (3.72)
Pneumonia-bacterial 725 (3.8) 710 (3.66)
Sepsis 705 (3.69) 710 (3.66)
Head trauma 665 (3.48) 709 (3.66)
Abdomen trauma-surgery for 621 (3.25) 653 (3.37)
Abdomen trauma 533 (2.79) 607 (3.13)
Gastrointestinal-location bleeding 528 (2.77) 545 (2.81)
Values are presented as mean ± SD or number (%).
the input and output layers. Estimated accuracy, an index of the accuracy of the predictions, was measured based on the differences between the predicted values and the actual values in the training data [17]. The number of units such as input, hidden, and output were recorded. The study used the exhaustive prune method. The method starts with “a large network and prunes the weakest units in the hidden and input layers as training proceeds” [17]. This method is usually the slowest for NN, because the network training parameters are chosen to ensure a very thorough search of the space of possible models to find the best one. However, it is known to yield the best results [17]. For the decision tree analysis, the Clementine’s C5.0 algorithm (SPSS Clementine is commercial data mining software that allows data process, analysis, and modeling to collaborate in exploring data and building models based on various built-in algorithms) was used. The model “works by splitting the sample based on the field that provides the maximum information gain and each subsample defined by the first split is then split again, until the subsamples cannot be split any further” [17]. Previous studies show that C5.0 models are quite robust in the pres- ence of problems such as missing data and large numbers of input fields [17]. In addition, an easier interpretation and a powerful boosting method to increase accuracy of classifica- tion are major strengths of the C5.0 models.
The SVM is a classification and regression technique that
“maximizes the predictive accuracy of a model without over fitting the training data” [17]. Our data set is very large volume with large number of predictor variables; therefore the SVM was chosen to bring as an option for developing optimal prediction model for the ICU mortality. The high- dimensional variables are separated into categories and then a separator found between each category is transformed for further analysis. “Following this, characteristics of new data can be used to predict the group to which a new record should belong” [17]. To evaluate performance of the differ- ent prediction models, the study reported AUC. The AUC was used to measure for “how well the model can discrimi- nate between positives and negatives” based on specificity and sensitivity values [1]. In other words, the AUC was used to assess the ability of the system to distinguish between in- dividual patients who lived and those who died [18].
III. Results
1. Overall Description of UKH Critical Care Data
A total record of 38,474 ICU encounters was obtained from 23,446 patients (average number of visits per a patient, 1.64 visits) admitted to UKH-ICU between January 1998 and
September 2007. The demographic and clinical features are presented in Table 2. The average age of the patients was 55.46 (standard deviation was ±15.97) and 59.88 percentage (n = 23,040) of the patients was male. Predicted APACHE III scores of the study participants, calculated within a day of ICU admission, was 50.98 (±28.80). Actual ICU length of stay (LOS) was 4.84 (±9.31) days, which was obtained from ICU discharge information. Non-operative encounters (n = 24,868, 64.95%) were the most dominant in the study. The most frequently recorded chronic health item in the study group was diabetes (n = 6,884, 17.89%) followed by immu- no-suppressed diseases (n = 5,250, 13.65%). Most commonly suspected diagnosis at admission included post-operative di- agnosis of coronary artery bypass grafting (n = 1,860, 4.83%), congestive heart failure (n = 1,597, 4.15%) and acute myo- cardial infarction (n = 1,485, 3.83%). Complete information about characteristics of the study participants and variable selected for each model can be found in Tables 1, 2.
2. Variables Selected
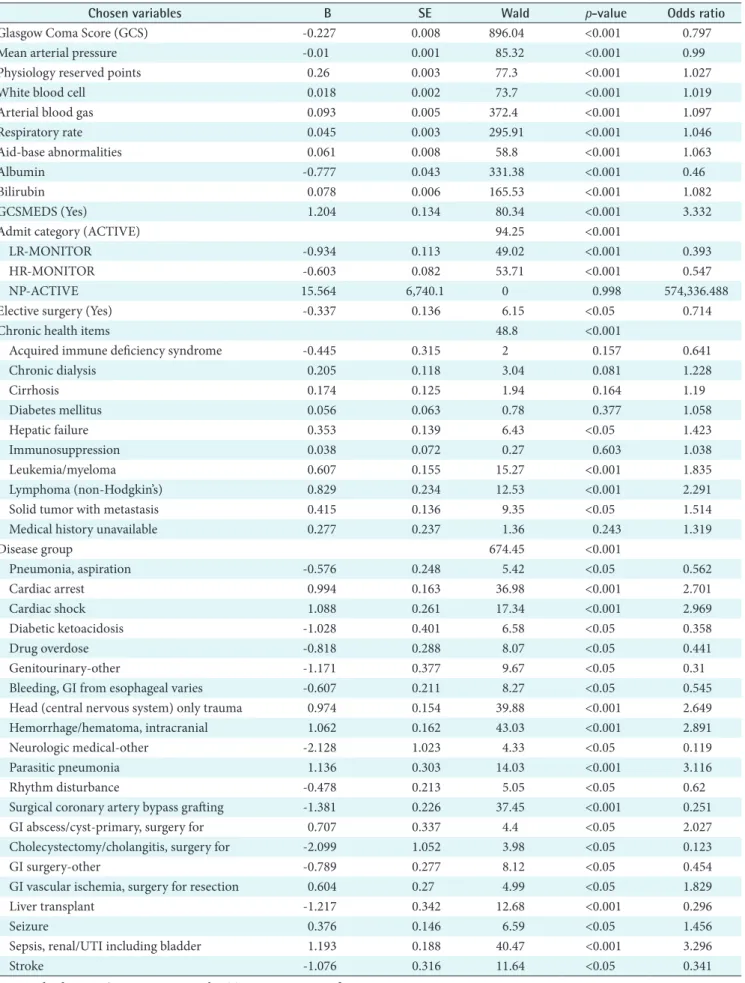
Forty variables (V = 41) including one outcome variable was the full set of the study dimensions obtained from APACHE III critical care system. A fifteen variable set (V = 15) was chosen using the logistic regression (forwarding) in Table 3.
A complete list of study variables in each variable set along with p-value is listed in Table 3.The included variables are: a calculated field of age weight plus chronic (PhyResvPts), ad- mission category, disease group, chronic health item, elective surgery, mean arterial pressure (MAP), respiratory rate (RR), GCS, GCS on medication, white blood cell (WBC), albumin, bilirubin, ABG, aid-base abnormalities (ABA), and death status. The study found that most cardiac-related variables (e.g., CABGIG, CABGGraft, etc.) were not included in the reduced variable set. In addition, some patient demographic and admission information such as gender, race, admission service and readmission were excluded in the reduced vari- able set (V = 15).
3. Overall Performances
All four models, APACHE III, C5.0, ANN, and SVM models, were constructed to predict the ICU outcome. The accuracy of these four methods for outcome prediction was measured to assess prediction performance in Table 4. Among four models, the best performing model is C5.0 (AUC, 0.892), followed by SVM (AUC, 0.876), APACHE III (AUC, 0.871), and ANN (AUC, 0.874). As resulted in our predicted models using only 15 chosen variables, two machine models, DT and SVM, performed slightly better than that of the con- ventional APACHE III prediction model in our data set (V
Table 3. Dimension reduction by using logistic regression
Chosen variables B SE Wald p-value Odds ratio
Glasgow Coma Score (GCS) -0.227 0.008 896.04 <0.001 0.797
Mean arterial pressure -0.01 0.001 85.32 <0.001 0.99
Physiology reserved points 0.26 0.003 77.3 <0.001 1.027
White blood cell 0.018 0.002 73.7 <0.001 1.019
Arterial blood gas 0.093 0.005 372.4 <0.001 1.097
Respiratory rate 0.045 0.003 295.91 <0.001 1.046
Aid-base abnormalities 0.061 0.008 58.8 <0.001 1.063
Albumin -0.777 0.043 331.38 <0.001 0.46
Bilirubin 0.078 0.006 165.53 <0.001 1.082
GCSMEDS (Yes) 1.204 0.134 80.34 <0.001 3.332
Admit category (ACTIVE) 94.25 <0.001
LR-MONITOR -0.934 0.113 49.02 <0.001 0.393
HR-MONITOR -0.603 0.082 53.71 <0.001 0.547
NP-ACTIVE 15.564 6,740.1 0 0.998 574,336.488
Elective surgery (Yes) -0.337 0.136 6.15 <0.05 0.714
Chronic health items 48.8 <0.001
Acquired immune deficiency syndrome -0.445 0.315 2 0.157 0.641
Chronic dialysis 0.205 0.118 3.04 0.081 1.228
Cirrhosis 0.174 0.125 1.94 0.164 1.19
Diabetes mellitus 0.056 0.063 0.78 0.377 1.058
Hepatic failure 0.353 0.139 6.43 <0.05 1.423
Immunosuppression 0.038 0.072 0.27 0.603 1.038
Leukemia/myeloma 0.607 0.155 15.27 <0.001 1.835
Lymphoma (non-Hodgkin’s) 0.829 0.234 12.53 <0.001 2.291
Solid tumor with metastasis 0.415 0.136 9.35 <0.05 1.514
Medical history unavailable 0.277 0.237 1.36 0.243 1.319
Disease group 674.45 <0.001
Pneumonia, aspiration -0.576 0.248 5.42 <0.05 0.562
Cardiac arrest 0.994 0.163 36.98 <0.001 2.701
Cardiac shock 1.088 0.261 17.34 <0.001 2.969
Diabetic ketoacidosis -1.028 0.401 6.58 <0.05 0.358
Drug overdose -0.818 0.288 8.07 <0.05 0.441
Genitourinary-other -1.171 0.377 9.67 <0.05 0.31
Bleeding, GI from esophageal varies -0.607 0.211 8.27 <0.05 0.545
Head (central nervous system) only trauma 0.974 0.154 39.88 <0.001 2.649
Hemorrhage/hematoma, intracranial 1.062 0.162 43.03 <0.001 2.891
Neurologic medical-other -2.128 1.023 4.33 <0.05 0.119
Parasitic pneumonia 1.136 0.303 14.03 <0.001 3.116
Rhythm disturbance -0.478 0.213 5.05 <0.05 0.62
Surgical coronary artery bypass grafting -1.381 0.226 37.45 <0.001 0.251
GI abscess/cyst-primary, surgery for 0.707 0.337 4.4 <0.05 2.027
Cholecystectomy/cholangitis, surgery for -2.099 1.052 3.98 <0.05 0.123
GI surgery-other -0.789 0.277 8.12 <0.05 0.454
GI vascular ischemia, surgery for resection 0.604 0.27 4.99 <0.05 1.829
Liver transplant -1.217 0.342 12.68 <0.001 0.296
Seizure 0.376 0.146 6.59 <0.05 1.456
Sepsis, renal/UTI including bladder 1.193 0.188 40.47 <0.001 3.296
Stroke -1.076 0.316 11.64 <0.05 0.341
SE: standard error, GI: gastrointestinal, UTI: urinary tract infection.
= 15). Among the machine learning models built, our study revealed that the DT slightly outperformed that of LR, SVM, and ANNs. This study result indicates that all four models performed within the level of a medically acceptable predic- tion range, which is over 80% of the AUC. Typically, model developers require an AUC of the ROC curve to be 0.70 [19-21].
Figure 1 visually shows the performances of the four mod- els built. It is apparent that one of non-traditional methods, the decision trees using C5.0 algorithms, yielded larger ROC areas than that of a standard statistical method, LR. In ad- dition, the results of ANN and SVM were as good as that of LR. Again, this assures that all of our four models built show very good discriminatory values with AUC ranging between 0.80 and 0.90, achieving good to excellent calibration assess- ments.
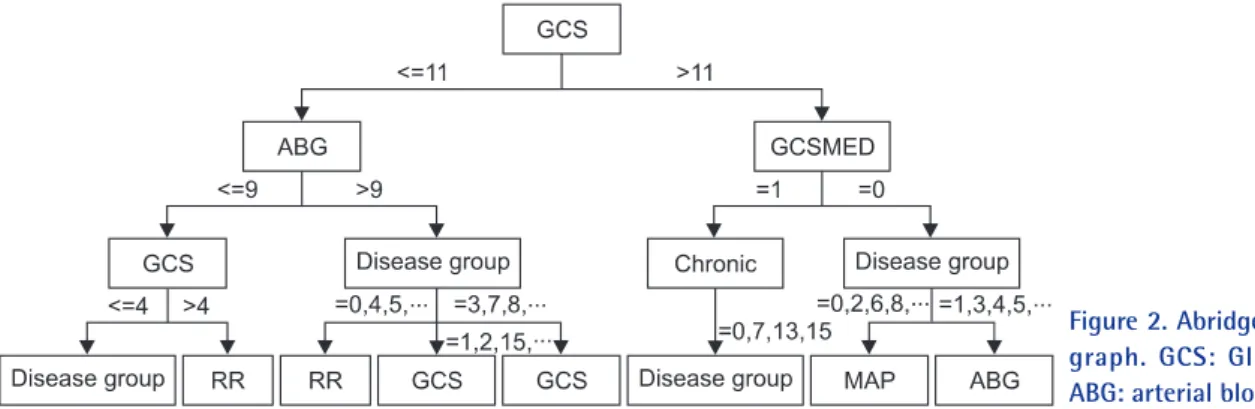
As resulted in our study, the decision tree outperformed among the study models. In order for us to closely review the branches of the resulted decision tree, the following Figure 2 illustrates a shorten version of the tree result. In this decision tree, split rules are explained with power of splitter, which explores further analysis on individual value ranges selected for each variable to branch-out to the next level of the deci- sion performed. In our study result, the first level decision branch in this tree is GCS predictor which separates score
more or equal to 11 followed by ABG less than or equal to 9.
However, it may contain potential to visually depict critical care decisions, which can further be used to develop critical care practice guideline.
IV. Discussion
The primary goal of the study was to construct an ICU out- come prediction model from 38,474 admissions only using the data captured within the first 24 hours at UKH-ICU. The three models were developed using the ICU data extracted from the UK APACHE III Critical Care system and included patient demographic, admission information, physiology, and chronic health conditions as predictor variables (input) and an ICU discharge status as a response (target) variable.
The most interesting outcome of this study was that the DT model outperformed those of LR and ANN-based mod- els. For several reasons, in the past studies, decision tree algorithms are not the favored choice of data miners. For example, the following criticisms show limitation on the use of DTs: classes must be mutually exclusive, final decision tree
Table 4. Comparison of DT, ANN, SVM, and LR performance
Methods AUC SE 95% Confidence
interval
C5 0.892 0.004 0.884-0.900
ANN 0.874 0.004 0.866-0.881
SVM 0.876 0.004 0.868-0.883
APACHE III 0.871 0.003 0.865-0.877
DT: decision trees, LR: logistic regression, ANN: artificial neu- ral network, SVM: support vector machine, AUC: area under the receiver operating characteristic curve, SE: standard error.
Figure 1. Receiver operating characteristic (ROC) results of pre- diction models developed. ANN: artificial neural net- work, SVM: support vector machine.
Figure 2. Abridged decision trees (DT) graph. GCS: Glasgow Coma Score, ABG: arterial blood gases.
dependent upon order of attribute selection, errors in the training set can result in overly complex decision trees, and having missing values for an attribute make it unclear which branch to take when that attribute is tested. Nonetheless, the past studies have reported controversial findings on the C5 algorithm. For example, Delen et al. [22]’s result (C5.0 was the best predictor with the highest accuracy of 93.6%
in predicting breast cancer survivability) supports our find- ing of the best prediction resulted from C5.0 methods in all three-performance measurement outcome. Unlike the study of Delen et al. [22], Ramon et al. [1] reported that the AUCs of decision tree based algorithms (decision tree learning, 65%; first order random forests, 81%) yielded smaller areas compared to those of naive Bayesian networks (AUC, 85%) and tree-augmented naive Bayesian networks (AUC, 82%) in their preliminary study on a small data set containing 1,548 mechanically ventilated ICU patients [1]. This result does not comply with our finding of the superiority of decision tree based models. Although the study was not intended for comparing multiple machine learning algorithms, Crawford et al. [23] concluded that a decision tree used in their study provided a clinically acceptable mining result in predicting susceptibility of prostate carcinoma patients at low risk for lymph node spread.
Considering the noticeable lack of information about the use of decision tree algorithm for predicting health out- comes, this study contributes to our understanding of the performance of the decision tree-based algorithm such as C5.0 in comparison to those of the neural and logistic mod- els. Furthermore, the major limitation for the use of ANNs is the lack of logic between input and output nodes, which are not explicit because of hidden layers. Some studies sug- gest that decision trees can be applied to uncover the hidden layers in order to explain the hidden clinical implication in the ANN’s black box area. Therefore, a more elaborate com- parison using a different decision tree algorithms (CART, CHAID, ID3, etc.) and ANN algorithms should be conduct- ed to provide reliable and generalizable research findings.
Previously studied data mining algorithms in predicting hospital or ICU outcomes have mostly used ANN methods whose performance was not compared to those of decision trees [24,25].
To identify the best predictor variables for the model, the study performed an LR-based dimension reduction ap- proach. The study confirmed that the reduced study variables in machine learning algorithms slightly better than those with conventional APACHE III variables. As confirmed by four AUC performance measures, the predictors included in three machine learning-based models performed slightly
better with the statistically chosen variables than that of the APACHE III variables. The unanimous variables in both variable sets are disease group, chronic health item, MAP, RR, GCS, WBC, Albumin, Bilirubin, ABG, and ABA. These variables are mostly drawn from physiology lab values except for disease and chronic health items. This finding reassures the importance of physiology lab to predict ICU mortality as proven in APACHE prediction modeling. Within the critical care context, the UK hospital’s protocol of the Adult Trauma Alert Activation Criteria recommends critical variables such as MAP, RR, GCS, and ABG to be used as mandatory crite- ria to provide rapid and efficient mobilization of personnel and resources essential for resuscitation, evaluation, diag- nosis and treatment of the multiply injured patient. In this protocol, systolic BP less than 90 and GCS less than 8 are indicative of issuing an adult trauma patient. Although this protocol is not specifically intended for an overall mortal- ity of ICU, the decision paths, critical variables, and cut-off values can be validated in our further study. Likewise, the previous findings suggest that the overall performance was improved as variables were reduced [26-28]. Therefore, this result led us for further justification of our findings against the previous studies which concluded a simple model with lesser variables was much more effective and likely to be ac- cepted and used by clinicians working in critical care setting [29].
The major contribution of the current study was the use of a large number of samples (n = 38,474), which represents al- most every ICU patient admitted to UKH-ICU over the past decade. The use of small data sets has been identified as a major limitation in previous studies [17,30,31]. Considering the fact that the UKH is a largest and most comprehensive academic hospital within the state of Kentucky, the study findings are representative of public health observation in critical care services. In addition, secondary use of health data can greatly enhance critical care research, which can possibly suggest new ways of analyzing mined ICU data such as the results of decision tree paths.
The current study has several limitations, which have to be improved for prospective studies in ICU prediction model- ing, if designed for a different research direction. First, the study only used the first day of ICU data, which did not capture intermediate progression on various treatment and physiology data changes. This limits the impact of clinical decision-making, since captured data is usually not updated during the patients’ ICU stay [2]. The use of intermedi- ate information rather than static data can suggest a more meaningful clinical implication in critical care. In their Silva et al. [2] and Harrison and Kennedy [29], electrocardiogram
data and adverse events captured over the course of ICU treatments were used to build an ICU prediction model [29]. Therefore, in our next study, ICU data from the time of presentation (time dimension to be added for prediction modeling) will be performed which will also consider in pre- dicting other ICU outcomes such as length of stay, days of ventilation, etc.
Second, considering the benefits of using data mining tech- niques, the data mining approach in clinical medicine should carefully be designed based on the capability and applica- bility of the medical domain knowledge throughout every process of the data-mining task. Although the study did not intend to focus on a certain disease category such as acute coronary syndrome or sepsis, it is apparent that the next step of UKH ICU data mining will consider in dealing with the specific disease related approaches. In this regard, we plan to develop further prediction models with the top 10 popular disease groups identified in our data set. In addition, the use of domain expert prediction compared to machine learning predictions will give us a better validation of the produced results.
Third, although our study used a large number of repre- sentative samples from a large teaching hospital, the data were collected from only one center. The original source of APACHE III Critical Care series have collectively captured critical care data from more than one institution nationwide, we hope to expand our study to develop a prediction model at a multiple centers. As recommended, the “determination of the applicability and usefulness of any predictive model requires independent and external validation in a population that is intrinsically different from the development sample”
[31]. Again, we believe that further research is required to assess the clinical applicability of the developed model with hybrid and multiple modeling approaches in a larger pool of critical care patients at a multiple institutions.
In this study, we developed a well-calibrated ICU predic- tion model that outperformed the prevalent statistical mod- el, APACHE III, using new machine learning algorithms such as C5.0, SVM, and ANN. The study used systematically collected critical care data from over a decade at a large aca- demic teaching hospital. It confirms that machine-learning techniques generally improve the performance or accuracy of the outcome prediction. It is also clear that alternative ma- chine learning, such as decision trees, which have not been investigated in many clinical settings, should be studied fur- ther to validate our study’s finding. Moreover, further studies should give their attention to a multicenter-driven, hybrid machine learning-tested, special disease-focused and hu- man expert-validated experimental design so that the overall
quality, generalizability, and reproducibility can be improved in the study of machine learning in the critical care setting.
In addition, the intensive care setting is well suited to imple- ment a prediction tool that is being built on a wealth of criti- cal care data populated every second. It will see more com- pelling demands if UKH and other major medical centers are ready to use automatically collected real time ICU data that requires a clinical decision support system to predict clinically reliable patient outcome. Therefore, more atten- tion should be given to utilize the critical care data available, which can be of further assistance to busy clinicians who can then effectively monitor data patterns for optimal care. Con- clusively, the study believes that the new machine learning algorithms can be integrated into the development of stan- dard critical care systems so that critical care decisions can be improved to ultimately save critically-ill patients.
Conflict of Interest
No potential conflict of interest relevant to this article was reported.
Acknowledgements
This publication was made possible by Grant Number P20 RR16481 from the National Center for Research Resources (NCRR), a component of the National Institutes of Health (NIH). The authors wish to thank the faculty and staff of the APACHE system team (Dr. Joseph Conigliaro, MD, MPH, FACP, Mr. Ion Mitrache, MS, and Ms. Leigh Sawyer, RN) of the Center for Enterprise Quality and Safety at the Univer- sity of Kentucky Hospital for their generous collaboration.
References
1. Ramon J, Fierens D, Guiza F, Meyfroidt G, Blockeel H, Bruynooghe M, van den Berghe G. Mining data from intensive care patines. Adv Eng Inform 2007; 21: 243- 256.
2. Silva A, Cortez P, Santos MF, Gomes L, Neves J. Mortal- ity assessment in intensive care units via adverse events using artificial neural networks. Artif Intell Med 2006;
36: 223-234.
3. Rosenberg AL. Recent innovations in intensive care unit risk-prediction models. Curr Opin Crit Care 2002; 8:
321-330.
4. Knaus WA. APACHE 1978-2001: the development of a quality assurance system based on prognosis: milestones and personal reflections. Arch Surg 2002; 137: 37-41.
5. Knaus WA, Wagner DP, Draper EA, Zimmerman JE, Bergner M, Bastos PG, Sirio CA, Murphy DJ, Lotring T, Damiano A. The APACHE III prognostic system. Risk prediction of hospital mortality for critically ill hospital- ized adults. Chest 1991; 100: 1619-1636.
6. Le Gall JR, Loirat P, Alperovitch A, Glaser P, Granthil C, Mathieu D, Mercier P, Thomas R, Villers D. A simplified acute physiology score for ICU patients. Crit Care Med 1984; 12: 975-977.
7. Le Gall JR, Lemeshow S, Saulnier F. A new Simplified Acute Physiology Score (SAPS II) based on a European/
North American multicenter study. JAMA 1993; 270:
2957-2963.
8. Morik K, Imhoff M, Brockhausen P, Joachims T, Gather U. Knowledge discovery and knowledge validation in intensive care. Artif Intell Med 2000; 19: 225-249.
9. Moser SA, Jones WT, Brossette SE. Application of data mining to intensive care unit microbiologic data. Emerg Infect Dis 1999; 5: 454-457.
10. Ganzert S, Guttmann J, Kersting K, Kuhlen R, Putensen C, Sydow M, Kramer S. Analysis of respiratory pressure- volume curves in intensive care medicine using induc- tive machine learning. Artif Intell Med 2002; 26: 69-86.
11. Lucas P. Bayesian analysis, pattern analysis, and data mining in health care. Curr Opin Crit Care 2004; 10:
399-403.
12. Kreke JE, Schaefer AJ, Roberts MS. Simulation and criti- cal care modeling. Curr Opin Crit Care 2004; 10: 395- 398.
13. Kong L, Milbrandt EB, Weissfeld LA. Advances in statis- tical methodology and their application in critical care.
Curr Opin Crit Care 2004; 10: 391-394.
14. Sierra B, Serrano N, Larranaga P, Plasencia EJ, Inza I, Jiménez JJ, Revuelta P, Mora ML. Using Bayesian net- works in the construction of a bi-level multi-classifier. A case study using intensive care unit patients data. Artif Intell Med 2001; 22: 233-248.
15. APACHE Medical Systems Inc. APACHE III methodol- ogy training critical care. McLean, VA: APACHE Medi- cal Systems Inc.; 1998.
16. Cerner Corporation. The APACHE IV equations:
benchmarks for mortality and resource use [Internet].
Cerner Corporation; c2011 [cited at 2011 Dec 1]. Avail- able from http://www.cerner.com/public/Cerner_3.
asp?id=27300.
17. SPSS Inc. Clementine help manual ver. 10.1. Chicago, IL: SPSS Inc.; 2005.
18. Green M, Bjork J, Forberg J, Ekelund U, Edenbrandt L, Ohlsson M. Comparison between neural networks and
multiple logistic regression to predict acute coronary syndrome in the emergency room. Artif Intell Med 2006; 38: 305-318.
19. Lemeshow S, Hosmer DW Jr. A review of goodness of fit statistics for use in the development of logistic regres- sion models. Am J Epidemiol 1982; 115: 92-106.
20. Lemeshow S, Teres D, Klar J, Avrunin JS, Gehlbach SH, Rapoport J. Mortality Probability Models (MPM II) based on an international cohort of intensive care unit patients. JAMA 1993; 270: 2478-2486.
21. Lemeshow S, Le Gall JR. Modeling the severity of illness of ICU patients. A systems update. JAMA 1994; 272:
1049-1055.
22. Delen D, Walker G, Kadam A. Predicting breast cancer survivability: a comparison of three data mining meth- ods. Artif Intell Med 2005; 34: 113-127.
23. Crawford ED, Batuello JT, Snow P, Gamito EJ, McLeod DG, Partin AW, Stone N, Montie J, Stock R, Lynch J, Brandt J. The use of artificial intelligence technology to predict lymph node spread in men with clinically local- ized prostate carcinoma. Cancer 2000; 88: 2105-2109.
24. Terrin N, Schmid CH, Griffith JL, D'Agostino RB, Selker HP. External validity of predictive models: a comparison of logistic regression, classification trees, and neural networks. J Clin Epidemiol 2003; 56: 721-729.
25. Wong LS, Young JD. A comparison of ICU mortality prediction using the APACHE II scoring system and artificial neural networks. Anaesthesia 1999; 54: 1048- 1054.
26. Jacobs S, Chang RW, Lee B, Lee B. Audit of intensive care: a 30 month experience using the Apache II sever- ity of disease classification system. Intensive Care Med 1988; 14: 567-574.
27. Frize M, Ennett CM, Stevenson M, Trigg HC. Clinical decision support systems for intensive care units: using artificial neural networks. Med Eng Phys 2001; 23: 217- 225.
28. Clermont G, Angus DC, DiRusso SM, Griffin M, Linde- Zwirble WT. Predicting hospital mortality for patients in the intensive care unit: a comparison of artificial neu- ral networks with logistic regression models. Crit Care Med 2001; 29: 291-296.
29. Harrison RF, Kennedy RL. Artificial neural network models for prediction of acute coronary syndromes using clinical data from the time of presentation. Ann Emerg Med 2005; 46: 431-439.
30. Nimgaonkar A, Karnad DR, Sudarshan S, Ohno-Mach- ado L, Kohane I. Prediction of mortality in an Indian intensive care unit. Comparison between APACHE II
and artificial neural networks. Intensive Care Med 2004;
30: 248-253.
31. Jaimes F, Farbiarz J, Alvarez D, Martinez C. Comparison
between logistic regression and neural networks to pre- dict death in patients with suspected sepsis in the emer- gency room. Crit Care 2005; 9: R150-R156.