822 Korean Chem. Eng. Res., 54(6), 822-829 (2016)
http://dx.doi.org/10.9713/kcer.2016.54.6.822 PISSN 0304-128X, EISSN 2233-9558
Enhanced Production of Cellulase-Free Thermoactive Xylanase Using Corncob by a Black Yeast, Aureobasidium pullulans CBS 135684
Wichanee Bankeeree, Pongtharin Lotrakul, Sehanat Prasongsuk, Seung Wook Kim* and Hunsa Punnapayak† Plant Biomass Utilization Research Unit, Department of Botany, Faculty of Science, Chulalongkorn University, Bangkok, 10330, Thailand
*Department of Chemical and Biological Engineering, Korea University, Seoul, 02841, Korea (Received 26 April 2016; Received in revised form 8 August 2016; accepted 17 August 2016)
Abstract − Our aim was to optimize the production of cellulase-free thermoactive xylanase by Aureobasidium pullu- lans CBS 135684 with statistical methodology based on experimental designs. Among eleven variables, the nutrient sources that had significant effect on xylanase production were corncob, (NH4)2SO4, xylose, KH2PO4 and tween 80, identified by the initial screening method of Plackett-Burman. The optimum concentrations of these five components were subsequently investigated using response surface methodology. The optimal concentrations (g·l-1) for maximum production of xylanase were corncob, 39.0; (NH4)2SO4, 3.0; xylose, 1.8; KH2PO4 1.4; and tween 80, 1.4, respectively.
An improved xylanase yield of 8.74 ± 0.84 U·ml-1 was obtained with optimized medium which is 2.1-fold higher pro- duction than previously obtained results (4.10 ± 0.10 U·ml-1) after 48 h of cultivation. In addition, the xylanase produc- tion under optimal condition reached 10.09 ± 0.27 U·ml-1 after 72 h of cultivation.
Key words: Endoxylanase, Thermo-tolerant, Black yeast, Corncob, RSM
1. Introduction
Among all xylanolytic enzymes, xylanases (1,4-β-D-xylan xylano- hydrolase; EC 3.2.1.8) are of significant importance that have been extensively studied due to their function and applications, espe- cially in pulp and paper manufacturing. The pretreatment of xylanases prior to conventional bleaching of pulp was found to increase the brightness and strength of paper, while it was also efficient in the reduction of kappa number and the use of bleached chemicals [1,2].
For application of xylanase in pulp bleaching, thermal-tolerance is an ideal property for efficient operation because industrial pulping is performed at elevated temperature (70~100oC) [3,4]. Conse- quently, the potent organisms capable of producing thermostable xylanase with greater yields are of special interest.
In our previous study, Aureobasidium pullulans CBS 135684 isolated from Thailand was found to produce cellulase-free xylanase that was relatively active and stable at high temperature (70~80oC) with the wide ranges of pH (4~10) [5]. These properties of xylanase are hardly found in commercial enzymes, such as Cartazyme, Irga- zyme 40s and Ecopulp X200 [6], and also in other yeast xylanases that would be a good potential for novel application. In addition, this strain can produce xylanases from agricultural wastes, which is practically more attractive due to the low cost of enzyme production.
The highest xylanase production was found in the medium contain- ing 1% (w/v) corncob, compared with those of wheat germ, wheat
bran, rice straw and water hyacinth [5]. To obtain the highest yield with low production cost, the investigation of the optimal nutrient compositions in culture medium for xylanase production using corncob as the main substrate has gained an attention in this study.
Various nutrient compositions of carbon sources, nitrogen sources, mineral salts, inducers, and along with other nutrient parameters were found to influence the xylanase production during submerged cul- ture. It is imperative to consider in single and combined effects on all involved parameters [8]. The classical method of one-variable- at-a-time design may be effective in some situations, but fails to consider the combined effects while the multivariate design fulfills this requirement [9]. The factorial or Plackett-Burman design is an appropriate experimental design for the first-order model to screen the significant factors among several variables [10]. Subsequently, experimental designs for second-order models, such as response surface methodology, should be used to approximate a response function or to optimize the concentration of variables [11,12]. The purpose of this study was to optimize the thermoactive xylanase production by A. pullulans CBS 135684 using corncob as main substrate.
First, Plackett-Burman experimental design was used to determine which of the nutritional variables were significant on the produc- tion of xylanase. Sequentially, the optimum levels of the identified variables were determined through application of response surface methodology using Box-Behnken experimental design.
2. Materials and Methods
2-1. Organism and culture conditions
Aureobasidium pullulans CBS 135684 was previously isolated [5] and maintained at the fungal culture collection of the Plant Bio-
†To whom correspondence should be addressed.
E-mail: [email protected]
This is an Open-Access article distributed under the terms of the Creative Com- mons Attribution Non-Commercial License (http://creativecommons.org/licenses/by- nc/3.0) which permits unrestricted non-commercial use, distribution, and reproduc- tion in any medium, provided the original work is properly cited.
mass Utilization Research Unit, Department of Botany, Faculty of Science, Chulalongkorn University, Bangkok, Thailand. It was deposited at the Centraalbureau voor Schimmelcultures, Netherlands (CBS number 135684). The yeast was grown in yeast malt (YM) agar medium [13] at room temperature for two days and short-term stock cultures were stored at 4oC. For long-term storage, the strain was stored at −20°C in YM broth containing 20% (v/v) glycerol.
2-2. Xylanase production from corncob
Corncob was locally collected, cleaned, initially cut to small sizes, air dried, ground and sieved through 80-mesh screen. Seed culture was prepared by growing one colony of A. pullulans in YM medium at room temperature (28±2oC) with 150 rpm shaking incuba- tion for 72 h. The inoculum was adjusted to 2.5×10⁷ cells·ml-1 using sterile distilled water and 100 µl was transferred into 100 ml basal medium [14] supplemented with 1% (w/v) corncob as the sole car- bon source. The cultures were incubated at room temperature with 150-rpm agitation for 48 h. Cells were separated from the culture broth by centrifugation (18,000 × g, 10 min) at 4oC. The superna- tant was used as the crude enzyme solution for xylanase assay.
2-3. Enzyme assay
Xylanase activity was assayed at 70oC using 1% (w/v) beech wood xylan (Fluka, USA) as the substrates in 50 mM acetate buffer (pH 6.0). The amount of released reducing sugars was determined by the 3,5-dinitrosalicylic acid (DNS) method [15]. One unit (U) of xylanase was defined as the amount of enzyme required to release 1 μmol xylose equivalent per min under the optimal conditions.
Results are reported as the mean value of three replicates.
2-4. Screening of nutrient compositions using a Plackett-Bur- man design
To assess the effects of medium compositions on the xylanase production, the experiment was designed based on the Design Expert software (Version 8.0.2.0, Stat-Ease Inc., Minneapolis, USA) [10].
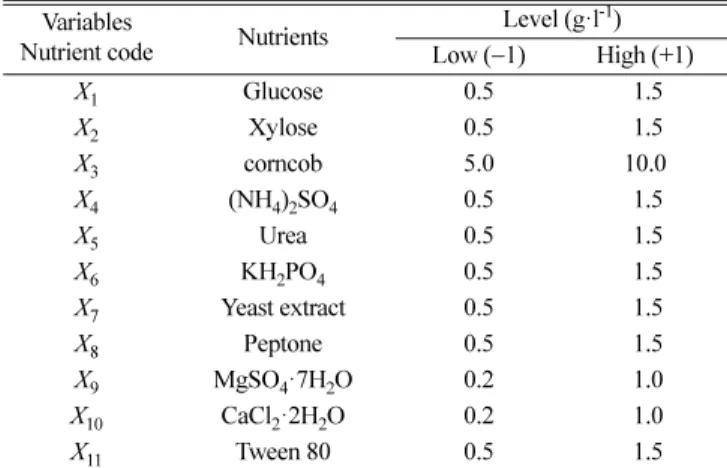
A total of eleven variable components were analyzed including corncob, xylose, glucose, urea, (NH4)2SO4, yeast extract, peptone, MgSO4·7H2O, CaCl2·2H2O, KH2PO4 and tween 80. All variables were investigated at two spaced intervals designated as −1 (low level) and +1 (high level) as shown in Table 1. The experimental design for the screening of the variables is described in Table 2. The Plackett- Burman experimental design was based on a first-order model:
Y = β0 + ƩβiXi (1)
where Y is the response (enzyme activity), β0 is the model inter- cept, βi is the linear coefficient, and Xi is the level of the independent variable. All experiments were performed in three replicates and the mean values are given. Nutrient compositions that significantly enhanced the xylanase production were selected for further optimi- zation.
2-5. Optimization of nutrient concentration using response surface methodology
The Box-Behnken experimental design with five factors, based on the results from Plackett-Burman experiments, in three levels including three replicates at the center point was used to fit the sec- Table 1. Nutrient screening using a Plackett-Burman design
Variables
Nutrient code Nutrients Level (g·l-1)
Low (−1) High (+1)
X1 Glucose 0.5 1.5
X2 Xylose 0.5 1.5
X3 corncob 5.0 10.0
X4 (NH4)2SO4 0.5 1.5
X5 Urea 0.5 1.5
X6 KH2PO4 0.5 1.5
X7 Yeast extract 0.5 1.5
X8 Peptone 0.5 1.5
X9 MgSO4·7H2O 0.2 1.0
X10 CaCl2·2H2O 0.2 1.0
X11 Tween 80 0.5 1.5
Table 2. The Plackett-Burman experimental design matrix for medium composition screening of xylanase production by A. pullulans CBS 135684
Trials Variable factors (g.l-1) Xylanase activity
(U·ml-1)
Predicted values (U·ml-1)
X1* X2 X3 X4 X5 X6 X7 X8 X9 X10 X11
1 +1 +1 −1 +1 +1 +1 −1 −1 −1 +1 −1 2.48 2.17
2 −1 +1 +1 −1 +1 +1 +1 −1 −1 −1 +1 3.26 3.27
3 +1 −1 +1 +1 −1 +1 +1 +1 −1 −1 −1 4.73 4.38
4 −1 +1 −1 +1 +1 −1 +1 +1 +1 −1 −1 3.95 4.43
5 −1 −1 +1 −1 +1 +1 −1 +1 +1 +1 −1 6.08 6.20
6 −1 −1 −1 +1 −1 +1 +1 −1 +1 +1 +1 3.86 3.87
7 +1 −1 −1 −1 +1 −1 +1 +1 −1 +1 +1 3.64 3.65
8 +1 +1 −1 −1 −1 +1 −1 +1 +1 −1 +1 2.27 2.39
9 +1 +1 +1 −1 −1 −1 +1 −1 +1 +1 −1 5.04 5.05
10 −1 +1 +1 +1 −1 −1 −1 +1 −1 +1 +1 3.44 3.60
11 +1 −1 +1 +1 +1 −1 −1 −1 +1 −1 +1 6.51 6.20
12 −1 −1 −1 −1 −1 −1 −1 −1 −1 −1 −1 4.62 4.67
*X1: glucose, X2: xylose, X3: corncob, X4: (NH4)2SO4, X5: urea, X6: KH2PO4, X7: yeast extract, X8: peptone, X9: MgSO4·7H2O, X10: CaCl2·2H2O and X11: tween 80. The +1 and −1 symbols refer to the higher and lower concentrations, respectively, for each variable factor in Plackett-Burman experimental design
ond order response surface [16]. All variables were taken at a cen- tral coded value of zero. The minimum and maximum ranges of variables investigated are listed in Table 3. Upon the completion of experiments, the average of xylanase activities was taken as the response and analyzed in a statistical manner using regression. A multiple regression analysis of the data was carried out for obtain- ing an empirical model that related the response measured to the independent variables. Xylanase production was analyzed by mul- tiple regressions through the least squares method to fit the follow- ing equation:
B = β0 + ƩβiAi + ƩβijAiAj +ƩƩβiiAi2 (2) where B is the measured response, β0 is the intercept term, βi is linear coefficients, βii is quadratic coefficient, βij is interaction coefficient and Ai and Aj are coded independent variables. Statistical analysis of the data involved design package Design-Expert software (version 8.0.7.1, Stat-Ease, Inc., Minneapolis, USA) to evaluate the analysis of variance (ANOVA) and to determine the significance of each term in the equations fit. The fitted polynomial equation was then expressed in the form of three-dimensional response surface plots to illustrate the main and interactive effects of the independent variables on the dependent ones. In addition, the optimal concentrations of the criti- cal variables were also obtained by these plots. The combination of different optimized variables, which yielded the maximum response, was determined to verify the validity of the model. To verify the accu- racy of the predicted model, the repeated experiment was carried out using the optimized medium. Growth pattern and xylanase production of A. pullulans were also determined every 12 h up to 120 h after culti- vation in the optimum medium compared with the previous produc- tion medium at room temperature.
3. Results and Discussion
3-1. Screening of the medium composition for xylanase produc- tion using the Plackett-Burman design
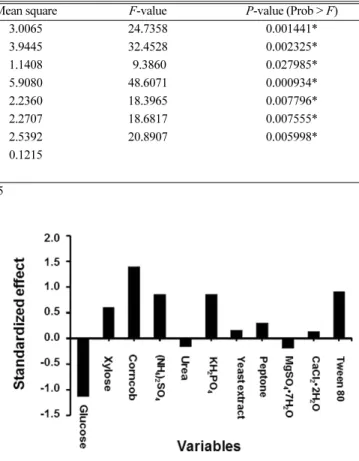
The independent variables examined in the Plackett-Burman design and their settings are shown in Table 2, while the effect of each medium component on xylanase production is shown in Fig. 1. The negative influence on the xylanase yield was found in the presence of urea
and MgSO4 due to the interfering of these residues in the cultivated broth on the measurement of enzyme activity [5], while glucose caused the repression of xylanase encoding gene according to a similar result in the previous report of Trichoderma reesei [17]. The strong inhibition of xylanase production in the presence of glucose (> 1.5 g·L-1) was due to the cross signal between cellulase/xylanase regulatory pathways [17]. The shared-domain of carbon catabolic repressor made it able to regulate both cellulase and xylanase gene cassettes and then glucose acted as a strong repressor for xylanase production [17,18]. Therefore, low concentration of glucose (0.5 g·L-1) was used to support the initial microbial growth and to study the effect on xylanase production. However, the catabolite repression caused by glucose is still dominant.
The remaining eight components, including xylose, corncob, (NH4)2SO4, KH2PO4, yeast extract, peptone, CaCl2 and tween 80, could enhance xylanase production. Statistical analysis (F-value and P-value) demonstrated that among the main positive effects, xylose, corncob, (NH4)2SO4, KH2PO4 and tween 80 had effects above 95% level and hence were considered to significantly influence xylanase production (Table 3). As xylanases are inducible enzymes, the generally known inducers of xylanase production are xylan and its short fragments, such as xylooligosaccharides [19,20]. Such long and short chains of xylan are present in corncob [21]. For xylose, similar results were presented that it served as a strong inducer for xylanase production by A. pullulans CBS 58475 [22] and A. pullulans NCIM Fig. 1. Pareto chart showing the effects of medium components on
xylanase production by A. pullulans CBS 135684.
Table 3. Analysis of variance (ANOVA) of the Plackett-Burman experimental model developed for xylanase production by A. pullulans CBS 135684
Source Sum of Squares df Mean square F-value P-value (Prob > F)
Model 18.0393 6 3.0065 24.7358 0.001441*
X1-Glucose 3.9445 1 3.9445 32.4528 0.002325*
X2-Xylose 1.1408 1 1.1408 9.3860 0.027985*
X3-Corncob 5.9080 1 5.9080 48.6071 0.000934*
X4-(NH4)2SO4 2.2360 1 2.2360 18.3965 0.007796*
X7- KH2PO4 2.2707 1 2.2707 18.6817 0.007555*
X11-tween 80 2.5392 1 2.5392 20.8907 0.005998*
Residual 0.6077 5 0.1215
Cor Total 18.6471 11
R2 = 0.967; Adj R2= 0.928; Coefficient of variance = 8.39%; Significant at P<0.05
1050 [23]. Tween 80 is considered to be of no antimicrobial activ- ity as a nonionic surfactant that is widely used as amendment in the production of fungal enzymes due to the increase in permeability of cell membrane and stabilizing effect on the enzyme activity [24,25].
Therefore, the effect of tween 80 at final concentration of 0.05 and 0.15% (w/v)) on xylanase production was tested in this study within the range of typical use between 0.025 to 1% (v/v), and a positive result was also found in the same way with several studies [26-28].
With this experimental design, the role of each medium compo- nent on xylanase production by A. pullulans CBS 135684 was con- firmed by the coefficient of determination (R2 = 0.967) for the Plackett-Burman model and the significant probability value for regression model [(prob > F) <0.05]. The model F-value of 24.74 and P at < 0.05 also indicated that the model was significant. Regres- sion analysis was performed on the results and a first-order polyno- mial equation was derived representing xylanase production as a function of the independent variables as follows:
Y = 4.15−0.57X1+ 0.31X2+ 0.70X3+ 0.43 X4+ 0.44X6+ 0.46X11(3) where, Y is the response value or xylanase activity (U·ml-1). X1, X2, X3, X4, X6 and X11 are glucose (g·l-1), xylose (g·l-1), corncob (g·l-1), (NH4)2SO4 (g·l-1), KH2PO4 (g·l-1) and tween 80 (ml·l-1), respectively.
Xylanase activity from the composition-adjusted medium in this experiment was found to increase about 1.6-fold (6.51±0.23 U·ml-1) compared to the previous medium containing 1% (w/v) corncob (4.10±0.10 U·ml-1) [5]. However, the xylanase activity obtained from this new medium was still slightly lower than that from the original production medium containing commercial beech wood xylan (7.23±0.15 U·ml-1). Therefore, appropriate concentrations of all five positive factors were selected to determine the optimal concentra- tion based on Box-Behnken design.
3-2. Optimization of the medium compositions for xylanase production using response surface methodology
The observed and predicted responses from 43 experimental tri- als which contained different combinations of the five variables at three different concentrations are shown in Table 4. The maximum xylanase production was found to be 8.74±0.84 U·ml-1 in the trial number 8, which was very close to the predicted value (8.65±0.21 U·ml-1). The enzyme yield increased approximately two-fold when compared to the unmodified medium (4.10±0.10 U·ml-1). The sec- ond-order regression equation providing the levels of xylanase activity
as the function of variables was presented in terms of coded factors as in the following equation:
B = 5.64A1+10.39A2+12.86A3+18.37A4+18.54A5−0.14A1A2−0.03A1A3− 0.22A1A4−0.20A1A5−0.05A2A3+0.39A2A4+0.09A2A5+0.13A3A4−0.10A3A5+ 0.02A4A5−0.06A12−0.95A22−3.33A32−3.89A42−3.61A52−155.36
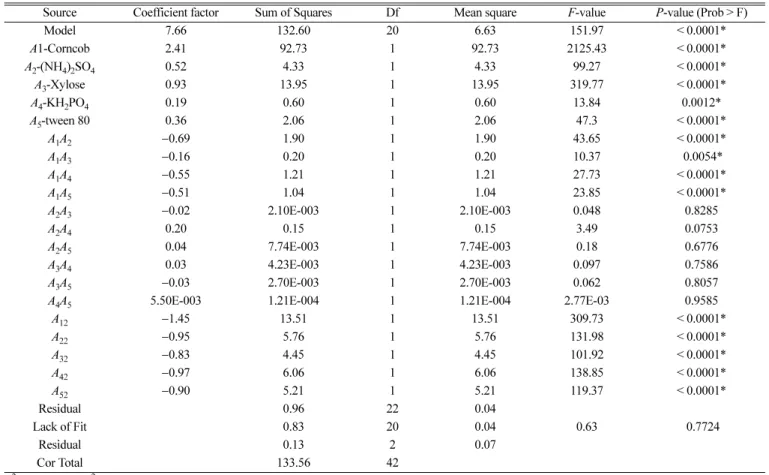
where, B is the response value or xylanase activity (U·ml-1). A1, A2, A3,A4 and A5 are corncob (g·l-1), (NH4)2SO4 (g·l-1), xylose (g·l-1), KH2PO4 (g·l-1) and tween 80 (ml·l-1), respectively. The model for xylanase production in this study was significant based on the F-value (151.97) and the model terms value of Prob > F less than 0.0001 (Table 6). The coefficient of determination (R2) was calculated to be 0.9928, indicating that the model could explain up to 99% of the vari- ability and only less than 1% of the total variance could not be explained by the model. The adjusted determination coefficient (adjusted R2= 0.9863) and predicted determination coefficient (R2 = 0.9730) also confirmed the significance of the model. A lower value of coefficient of variation (CV = 3.63%) indicated a greater precise- ness and reliability of experiment performed.
Comparison of predicted and experimental values revealed good correspondence between them. The plot of observed versus pre- dicted xylanase activities under optimum conditions showed that the actual values of xylanase activity were not significantly different from the predicted response values (Fig. 2). In this case, the model showed insignificance in lack of fit (P = 0.7724). It indicated the second-order model equation was adequate for the prediction of xylanase production across the specified range of variables employed.
It was confirmed by the coefficient of determination (R2 = 0.9905).
A lower value of coefficient of variation (CV = 3.63%) indicated a greater preciseness and reliability of the experiment performed.
Thus, the estimated model fitted the experimental data adequately.
In this experiment, the linear effects (A1, A2, A3, A4 and A5), the interactive effects (A1A2, A1A3, A1A4 and A1A5) and square effects (A12, A22, A32, A42 and A52) were significant model terms for xylanase production (B), which is evident from P-value less than 0.05 (Table 6).
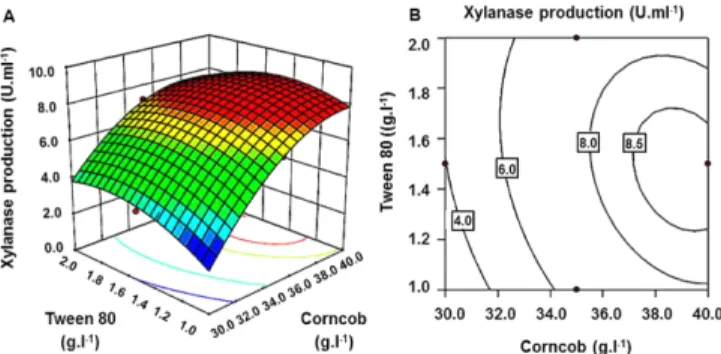
To get a better understanding of the effects of the variables on xylanase production by A. pullulans CBS 135684, the predicted model was further assessed using RSM. Three-dimensional response plots and their corresponding contour plots were drawn based on the model equation to investigate the interaction among the variables and to determine the optimum concentration of each factor for maximum xylanase production. The contour plots affirmed that the objective function was unimodal, which showed an optimum at the boundaries (Fig. 3~5). Xylanase production tends to increase with gradually increasing value in corncob concentration (Fig. 3 and 5). The opti- mal concentration of corncob (3.9% (w/v)) obtained in this study fell in the same range (1% to 4% (w/v)) reported for other strains of A. pullulans [29,30], Aspergillus terricola [31] and A. niger [32].
Fig. 4 shows the effects of A3 (xylose) and A4 (KH2PO4) on xylanase production. Evidently, the middle level of the KH2PO4 in the medium ensured more xylanase production. Similar result was found in Fig. 5 Table 4. Experimental range and levels of independent test variables
used in Box-Behnken experimental design Independent
variables (g·l-1)
Variable codes
Level
−1 0 +1
Corncob A1 30.0 35.0 40.0
(NH4)2SO4 A2 2.0 3.0 4.0
Xylose A3 1.0 1.5 2.0
KH2PO4 A4 1.0 1.5 2.0
Tween 80 A5 1.0 1.5 2.0
that the middle level of tween-80 resulted in the higher xylanase production.
The canonical analysis revealed a maximum xylanase activity of 8.74±0.84 U.ml-1 under the optimal conditions of corncob, 39.0 g·l-1; (NH4)2SO4, 3.0 g·l-1; xylose, 1.8 g·l-1; KH2PO4 1.4 g·l-1 and tween 80, 1.4 ml·l-1. The model predicted that the xylanase activity from A.
pullulans CBS 135684 would reach up to 8.82±0.21 U·ml-1 when produced in the medium containing these five components at the optimized concentrations. The validity of the results predicted by the regression model was confirmed by repeated experiments under opti-
mal conditions. The result obtained from three replications showed that the maximum xylanase production obtained (8.72±0.21 U·ml-1) was close to the predicted value (8.65±0.21 U·ml-1). It implied that empirical models derived from RSM can be used to adequately describe the relationship between the factors and response in xylanase production by A. pullulans CBS 135684. The synergistic effect of selected variables corresponded to 1.34 and 2.13-fold increase in xylanase activity (8.74±0.84 U·ml-1) compared to their individual effects from Plackett-Burman model (6.51±0.23 U·ml-1) and origi- nal medium (4.10±0.10 U·ml-1), respectively. In addition, xylanase Table 5. Box-Behnken design matrix with experimental and predicted values of xylanase production by A. pullulans CBS 135684
Trials Variables (g/L) Xylanase activity
(U/mL)
Predicted values (U/mL) Corncob (A1) (NH4)2SO4 (A2) Xylose (A3) KH2PO4 (A4) Tween 80 (A5)
1 +1 +1 0 0 0 7.24 7.50
2 0 0 0 0 0 7.42 7.66
3 0 0 0 +1 +1 6.50 6.34
4 0 0 0 0 0 7.62 7.66
5 0 0 −1 −1 0 4.74 4.76
6 0 +1 0 0 +1 6.68 6.73
7 0 0 +1 +1 0 7.10 7.01
8 +1 0 +1 +1 0 8.74 8.65
9 0 +1 +1 0 0 7.35 7.31
10 −1 +1 0 −1 0 4.08 4.06
11 0 0 0 0 −1 4.87 5.24
12 0 −1 0 0 −1 5.04 4.97
13 0 +1 0 0 0 5.94 5.87
14 0 0 −1 +1 0 4.97 5.08
15 0 0 +1 0 −1 6.52 6.53
16 0 −1 0 −1 +1 5.52 5.60
17 −1 0 0 0 +1 3.74 3.77
18 0 0 −1 +1 −1 4.57 4.61
21 −1 0 −1 +1 0 7.44 7.56
22 0 −1 0 0 0 7.72 7.86
23 +1 0 0 −1 +1 6.40 6.32
24 +1 −1 0 0 0 7.93 7.66
25 0 −1 +1 0 0 1.80 1.64
26 0 0 0 0 0 6.02 5.93
27 −1 −1 0 +1 0 6.78 6.65
28 0 +1 0 0 −1 3.70 3.96
29 0 +1 0 −1 0 5.40 5.62
31 −1 0 +1 0 0 7.03 6.91
32 0 0 0 +1 −1 5.42 5.38
33 0 0 0 +1 +1 5.14 5.22
34 +1 0 −1 0 0 5.42 5.49
35 0 0 −1 −1 +1 2.02 2.08
36 0 −1 0 0 0 4.38 4.40
37 0 +1 −1 0 0 3.38 3.57
38 −1 0 0 0 0 2.30 2.03
39 0 −1 −1 +1 0 8.04 7.86
40 −1 0 0 0 0 8.26 8.00
41 −1 0 0 −1 −1 7.27 7.19
42 +1 0 0 0 −1 6.74 6.56
43 +1 0 0 +1 0 7.42 7.29
The −1, 0, +1 symbols are placed at one of three equally spaced values for the higher, middle and lower concentrations, respectively, for each independent variable in Box-Behnken design
production from this experiment was 1.2-fold higher than that from the unmodified medium containing commercial beechwood xylan.
3-3. Xylanase production by A. pullulans before and after optimization
Two parallel experiments were conducted to study the pattern of cell growth and xylanase production in the optimized and original media (basal medium containing 1% (w/v) corncob) under the same condition. Although the cell density of A. pullulans CBS 135684 in optimized medium was noticeably lower than that of the basal medium,
Table 6. Analysis of variance (ANOVA) of the Box-Behnken experimental model developed for xylanase production by A. pullulans CBS 135684
Source Coefficient factor Sum of Squares Df Mean square F-value P-value (Prob > F)
Model 7.66 132.60 20 6.63 151.97 < 0.0001*
A1-Corncob 2.41 92.73 1 92.73 2125.43 < 0.0001*
A2-(NH4)2SO4 0.52 4.33 1 4.33 99.27 < 0.0001*
A3-Xylose 0.93 13.95 1 13.95 319.77 < 0.0001*
A4-KH2PO4 0.19 0.60 1 0.60 13.84 0.0012*
A5-tween 80 0.36 2.06 1 2.06 47.3 < 0.0001*
A1A2 −0.69 1.90 1 1.90 43.65 < 0.0001*
A1A3 −0.16 0.20 1 0.20 10.37 0.0054*
A1A4 −0.55 1.21 1 1.21 27.73 < 0.0001*
A1A5 −0.51 1.04 1 1.04 23.85 < 0.0001*
A2A3 −0.02 2.10E-003 1 2.10E-003 0.048 0.8285
A2A4 0.20 0.15 1 0.15 3.49 0.0753
A2A5 0.04 7.74E-003 1 7.74E-003 0.18 0.6776
A3A4 0.03 4.23E-003 1 4.23E-003 0.097 0.7586
A3A5 −0.03 2.70E-003 1 2.70E-003 0.062 0.8057
A4A5 5.50E-003 1.21E-004 1 1.21E-004 2.77E-03 0.9585
A12 −1.45 13.51 1 13.51 309.73 < 0.0001*
A22 −0.95 5.76 1 5.76 131.98 < 0.0001*
A32 −0.83 4.45 1 4.45 101.92 < 0.0001*
A42 −0.97 6.06 1 6.06 138.85 < 0.0001*
A52 −0.90 5.21 1 5.21 119.37 < 0.0001*
Residual 0.96 22 0.04
Lack of Fit 0.83 20 0.04 0.63 0.7724
Residual 0.13 2 0.07
Cor Total 133.56 42
R2 = 0.993; Adj R2= 0.986; Coefficient of variance = 3.63%; Significant at P < 0.05
Fig. 2. Observed xylanase activity versus the predicted xylanase activ- ity under the optimum conditions.
Fig. 3. Response surface plot (A) and contour plot (B) of the combined effects of corncob (A1) and (NH4)2SO4 (A2) on xylanase pro- duction by A. pullulans CBS 135684.
Fig. 4. Response surface plot (A) and contour plot (B) of the combined effects of xylose (A3) and KH2PO4 (A4) on xylanase production by A. pullulans CBS 135684.
the xylanase production was strongly increased (Fig. 6). The maxi- mal activity (10.09±0.27 U·ml-1) was found in the optimized medium after 72 h of incubation during the late log phase of the culture. In the original medium, the maximal activity was 4.10 ± 0.10 U·ml-1 after 48 h of incubation, which was 2.5-fold lower than that of the opti- mized medium.
The subsequent decrease in enzyme activity during the station- ary phase was generally common for the primary metabolites and has also been noted in xylanase production by other fungi [33]. It was probably due to proteolysis of the enzyme and/or the decline of actively growing cells because of nutrient depletion [33,34]. The results also suggested that the appropriate time for harvesting the xylanase enzyme produced by A. pullulans CBS 135684 grown in the optimized medium was at 72 h after inoculation.
4. Conclusion
We reported the successful optimization of nutrient sources in a medium for enhancement of xylanase production by A. pullulans CBS
135684. Statistical methods (Plackett-Burman and Box-Behnken design) were employed, instead of the one-factor-at-a-time method, to provide the information of interaction between variables, to select significant factors and to evaluate the optimum value of variables.
Corncob, (NH4)2SO4, xylose, KH2PO4 and tween 80 had signifi- cant effect on xylanase production, and the optimized medium was (g·l-1): 39.0, 3.0, 1.8, 1.4, and 1.4, respectively, which resulted in xylanase activity with 2.13-fold higher than that obtained from the non-optimized medium. Based on the result herein, the large scale of xylanase production from A. pullulans CBS 135684 should be carried out in the future study.
Acknowledgment
This research was supported by the Advanced Biomass R&D Center (ABC) of Global Frontier Project funded by Ministry of Science, ICT and Future Planning (ABC-2011-0031360), and Rachadapisek Sompot Fund for Postdoctoral Fellowship, Chulalongkorn University.
References
1. Beg, Q., Kapoor, M., Mahajan, L. and Hoondal, G. S., “Micro- bial Xylanases and Their Industrial Applications: A Review,”
Appl. Microbiol. Biotechnol., 56(3-4), 326-338(2001).
2. Viikari, L., Alapuranen, M., Puranen, T., Vehmaanperä, J. and Siika- Aho, M., “Thermostable Enzymes in Lignocellulose Hydrolysis in Biofuels,” Adv. Biochem. Eng. Biotechnol., 108, 121-145(2007).
3. Viikari, L., Poutanen, K., Tenkanen, M. and Tolan, J. S., “Hemi- cellulases,” Encyclopedia of Bioprocess Technology. Wiley, New York, (2002).
4. Woldesenbet, F., Gupta, N. and Sharma, P., “Statistical Optimi- zation of The Production of a Cellulase-Free, Thermo-Alkali-Stable, Salt-and Solvent-Tolerant Xylanase from Bacillus halodurans by Solid State Fermentation,” Arch. Appl. Sci. Res., 4, 524-535(2012).
5. Bankeeree, W., Lotrakul, P., Prasongsuk, S., Chaiareekij, S., Eve- leigh, D. E., Kim, S. W. and Punnapayak, H., “Effect of Polyols on Thermostability of Xylanase from a Tropical Isolate of Aureo- basidium pullulans and Its Application in Prebleaching of Rice Straw Pulp,” Springerplus, 3(1), 37(2014).
6. Gangwar, A. K., Prakash, N. T. and Prakash, R., “Applicability of Microbial Xylanases in Paper Pulp Bleaching: A Review,” Biore- sources, 9(2), 3733-3754(2014).
7. Benedetti, A. C. E. P., Costa, E. D., Aragon, C. C., Santos, A. F., Goulart, A. J., Attili-Angelis, D. and Monti, R., “Low-Cost Carbon Sources for The Production of A Thermostable Xylanase by Asper- gillus niger,” Rev. Ciênc. Farm. Básica Apl., 34(1), 25-31(2013).
8. Silva, C. J. and Roberto, I. C., “Optimization of Xylitol Produc- tion by Candida guilliermondii FTI 20037 Using Response Surface Methodology,” Process Biochem., 36(11), 1119-1124(2001).
9. Rao, K. J., Kim, C. H. and Rhee, S. K., “Statistical Optimization of Medium for The Production of Recombinant Hirudin from Sac- charomyces cerevisiae Using Response Surface Methodology,”
Process Biochem., 35(7), 639-647(2000).
10. Plackett, R. L. and Burman, J. P., “The Design of Optimum Multi- factorial Experiments,” Biometrika, 33(4), 305-325(1946).
Fig. 5. Response surface plot (A) and contour plot (B) of the com- bined effects of corncob (A1) and tween 80 (A5) on xylanase production by A. pullulans CBS 135684.
Fig. 6. Time course of growth and xylanase production of A. pullulans CBS 135684 at room temperature (28±2 °C) in the basal medium containing 1% (w/v) corncob and the optimized medium. Open circles (○) and solid circles (●) indicated cell density in the basal medium and the optimized medium, respectively. White bars and black bars indicated xylanase activity in the basal medium and the optimized medium, respectively. Results were shown as a mean with one standard deviation derived from three rep- licates.
11. Li, Y., Liu, Z. Q., Cui, F. J., Xu, Y.Y. and Zhao, H., “Applica- tion of Experimental Design to Optimize Culture Requirements of Aspergillus sp. Zh-26 Producing Xylanase for Degradation of Arabinoxylans in Mashing,” J. Food Sci., 72(5), 320-329(2007).
12. Cui, F., Liu, Z., Li, Y., Ping, L., Ping, L., Zhang, Z., Lin, L., Dong, Y. and Huang, D., “Production of Mycelial Biomass and Exo-polymer by Hericium erinaceus CZ-2: Optimization of Nutri- ents Levels Using Response Surface Methodology,” Biotechnol.
Bioprocess Eng., 15(2), 299-307(2010).
13. Atlas, R. M., “Handbook of Microbiological Media,” L. C. Boca Raton, Florida (1993).
14. Leathers, T. D., “Purification and Properties of Xylanase from Aureobasidium,” J. Ind. Microbiol. Biotechnol., 4(5), 341-347(1989).
15. Miller, G. L., “Use of Dinitrosalicylic Acid Reagent for Deter- mination of Reducing Sugar,” Anal. Chem., 31(3), 426-428(1959).
16. Box, G. E. and Behnken, D. W., “Some New Three Level Designs for The Study of Quantitative Variables,” Technometrics, 2(4), 455-475(1960).
17. Aro, N., Ilmén, M., Saloheimo, A. and Penttilä, M., “ACEI of Trich- oderma reesei is a Repressor of Cellulase and Xylanase Expres- sion,” Appl. Environ. Microbiol., 69(1), 56-65(2003).
18. Margolles-Clark, E., Ihnen, M. and Penttilä, M., “Expression Pat- terns of Ten Hemicellulase Genes of The Filamentous Fungus Trichoderma reesei on Various Carbon Sources,” Biotechnol. J., 57(1), 167-179(1997).
19. Kulkarni, N., Shendye, A. and Rao, M., “Molecular and Biotechno- logical Aspects of Xylanases,” FEMS Microbiol. Rev., 23(4), 411-456(1999).
20. Li, Y., Lin, J., Meng, D., Lu, J., Gu, G. and Mao, Z., “Effect of pH, Cultivation Time and Substrate Concentration on The Endox- ylanase Production by Aspergillus awamori ZH-26 under Submerged Fermentation Using Central Composite Rotary Design,” Food Technol. Biotech., 44(4), 473-477(2006).
21. Dobberstein, J. and Emeis, C. C., “β-Xylanase Produced by Aureoba- sidium pullulans CBS 58475,” Appl. Microbiol. Biotechnol., 32(3), 262-268(1989).
22. Dobberstein, J. and Emeis, C. C., “β-Xylanase Produced by Aureoba- sidium pullulans CBS 58475,” Appl. Microbiol. Biotechnol., 32(3), 262-268(1989).
23. Karni, M., Deopurkar, R. L. and Rale, V. B., “β-Xylanase Produc- tion by Aureobasidium pullulans Grown on Sugars Agricultural Residues,” World J. Microb. Biot., 9(4), 476-478(1993).
24. Reese, E. T. and Maguire, A., “Surfactants as Stimulants of Enzyme Production by Microorganisms,” J. Appl. Microbiol., 17(2), 242- 245(1969).
25. Shi, J. G., Zeng, G. M., Yuan, X. Z., Dai, F., Liu, J. and Wu, X.
H., “The Stimulatory Effects of Surfactants on Composting of Waste Rich in Cellulose,” World J. Microb. Biot., 22(11), 1121- 1127(2006).
26. Ding, C. H., Jiang, Z. Q., Li, X. T., Li, L. T. and Kusakabe, I.,
“High Activity Xylanase Production by Streptomyces olivaceo- viridis E-86,” World J. Microb. Biot., 20(1), 7-10(2004).
27. Shah, A. R. and Madamwar, D., “Xylanase Production by a Newly Isolated Aspergillus foetidus Strain and Its Characterization,”
Process Biochem., 40(5), 1763-1771(2005).
28. Maalej, I., Belhaj, I., Masmoudi, N. F. and Belghith, H., “Highly Thermostable Xylanase of The Thermophilic Fungus Talaromyces thermophilus: Purification and Characterization,” Appl. Biochem.
Biotechnol., 158(1), 200-212(2009).
29. Nasr, S., Soudi, M. R., Salmanian, A. H. and Ghadam, P., “Partial Optimization of Endo-1, 4-β-xylanase Production by Aureobasidium pullulans Using Agro-industrial Residues,” Iran J. Basic. Med.
Sci., 16(12), 1245(2013).
30. Chen, Y., Guo, J., Li, F., Liu, M., Zhang, X., Guo, X. and Xiao, D.,
“Production of Pullulan from Xylose and Hemicellulose Hydro- lysate by Aureobasidium pullulans AY82 with pH Control and DL-dithiothreitol Addition,” Biotechnol. Bioprocess Eng., 19(2), 282-288(2014).
31. Michelin, M., Maria de Lourdes, T. M., Ruzene, D. S., Silva, D.
P., Ruiz, H. A., Vicente, A. A., Jorge, J. A., Terenzi, H. F. and Teix- eira, J. A., “Production of Xylanase and β-xylosidase from Autohy- drolysis Liquor of Corncob Using Two Fungal Strains,” Bioproc.
Biosyst. Eng., 35(7), 1185-1192(2012).
32. Jin, N., Ma, S., Liu, Y., Yi, X., He, R., Xu, H., Qiao, D. R. and Cao, Y., “Thermophilic Xylanase Production by Aspergillus niger in Solid State Fermentation Using Wheat Straw and Corn Cob,”
Afr. J. Microbiol. Res., 6(10), 2387-239(2012).
33. Shah, A. R. and Madamwar, D., “Xylanase Production by A Newly Isolated Aspergillus foetidus Strain and Its Characterization,”
Process Biochem., 40(5), 1763-1771(2005).
34. Pal, A. and Khanum, F., “Identification and Optimization of Criti- cal Medium Components Using Statistical Experimental Designs for Enhanced Production of Xylanase from Aspergillus flavus DFR-6,” Food Technol. Biotech., 49(2), 228-236(2011).