Uric Acid Level Has a J-Shaped
Association with Arterial Stiffness in
Korean Postmenopausal Women
Hyungbin Lee, Young-Hyo Jung, Yu-Jin Kwon, Byoungjin Park*
Department of Family Medicine, Yonsei University College of Medicine, Seoul, Korea
Background:
Uric acid has been reported to function both as an oxidant or antioxidant depending on the context.
A previous study in the Korean population reported a positive linear association between serum uric acid level and
arterial stiffness in men, but little is known about how serum uric acid level is related to the risk of increased arterial
stiffness in Korean postmenopausal women.
Methods:
We performed a cross-sectional study of 293 subjects who participated in a health examination program
run by the health promotion center of Gangnam Severance Hospital between October 2007 and July 2010. High
brachial-ankle pulse wave velocity was defined as a brachial-ankle pulse wave velocity of more than 1,450 cm/s.
The odds ratios (ORs) for high brachial-ankle pulse wave velocity were calculated using multivariate logistic
regres-sion analysis across uric acid quartiles after adjusting for other indicators of cardiovascular risk.
Results:
The 293 postmenopausal women were divided into quartiles according to uric acid level. The mean
bra-chial-ankle pulse wave velocity values of each quartile were as follows: Q1, 1,474 cm/s; Q2, 1,375 cm/s; Q3, 1,422
cm/s; Q4, 1,528 cm/s. The second quartile was designated as the control group based on mean brachial-ankle
pulse wave velocity value. Multivariate adjusted ORs (95% confidence intervals) for brachial-ankle pulse wave
ve-locity across the uric acid quartiles were 2.642 (Q1, 1.095–6.3373), 1.00, 4.305 (Q3, 1.798–10.307), and 4.375 (Q4,
1.923–9.949), after adjusting for confounding variables.
Conclusion:
Serum uric acid level has a J-shaped association with arterial stiffness in Korean postmenopausal
women.
Keywords:
Uric Acid; Vascular Stiffness; Menopause; Cardiovascular Diseases
Received: May 11, 2016, Revised: July 29, 2016, Accepted: August 2, 2016
*Corresponding Author: Byoungjin Park Tel: +82-2-2019-3480, Fax: +82-2-3463-3287, E-mail: [email protected]
Original Article
INTRODUCTION
In human, uric acid is a by-product of purine metabolism, and can function as an oxidant or antioxidant.1,2-7) A previous study reported a positive association between a high serum uric acid level in the nor-mal range and increased arterial stiffness.2) Furthermore, high serum uric acid level could be a risk factor for metabolic syndrome.7,8) Hakoda et al.9) examined serum uric acid concentration as a risk factor for car-diovascular mortality, and found that a high serum uric acid level was associated with cardiovascular mortality.7) However, it is not clear how serum uric acid increases oxidative stress or contributes to chronic diseases, such as metabolic and cardiovascular disease in men, and few studies have investigated the associations between low serum uric acid levels and arterial stiffness.10)
Arterial stiffness can be easily measured by examining the brachial-ankle pulse wave velocity (ba-PWV), which is a significant predictor of cardiovascular events and metabolic disease.11-13) Recently, a simple automated device has become available for the measurement of ba-PWV using a volume-rendering method.13)
Menopause is known to be associated with increased risk for meta-bolic syndrome.14-18) Besides marked changes in hormonal levels, menopause is characterized by many other changes that could be linked to metabolic syndrome and can influence oxidative stress.16,19) Although a previous Korean study showed that the serum uric acid level had a positive linear association with arterial stiffness in men, this relationship was not found in women.2) Little is known about how se-rum uric acid levels are related to the risk of increased arterial stiffness in postmenopausal women. Therefore, we examined the association between serum uric acid levels and arterial stiffness in postmenopaus-al women.
METHODS
1. Study Design and Participants
This cross-sectional study was based on data obtained from the health promotion center of Gangnam Severance Hospital. We received the medical records of 966 participants (392 pre-menopausal women, 574 postmenopausal women) who underwent medical examinations at a single center between October 2007 and July 2010. Because we de-signed the study to investigate the association between serum uric acid levels and the risk for an elevated ba-PWV in postmenopausal women, we excluded pre-menopausal women. Subjects meeting any of the following criteria were excluded (n=281): subjects with any missing value; subjects with any overlapping values; and those with white blood cell (WBC) count ≥10,000/μL or high-sensitivity C-reac-tive protein ≥3.0 mg/L (to rule out acute inflammatory disorders). Af-ter excluding subjects, 293 participants were included in the final anal-ysis. This study was approved by the institutional review board of Yon-sei University College of Medicine (IRB number: 3-2017-0228), and in-formed consent was obtained from each participant. Participants were asked about lifestyle behaviors, including cigarette smoking, alcohol
consumption, and physical activity (more or less than three times per week), as well as whether they had been diagnosed with hypertension or diabetes. Participants were classified as non-smokers, ex-smokers, or current smokers. Subjects were classified into two groups according to alcohol intake (alcohol consumption >140 g/wk or ≤140 g/wk). Body mass index (BMI) was calculated as weight in kg divided by height in meters squared (kg/m2).
Diabetes was defined as a self-reported history of the disorder or a fasting plasma glucose level ≥126 mg/dL. Hypertension was defined as a self-reported history of the disorder, systolic blood pressure ≥140 mm Hg, or diastolic blood pressure ≥90 mm Hg.
We designed two models to evaluate the adjusted odds ratio (OR). Model 1 was calculated with an unadjusted OR, and model 2 was ad-justed for age, BMI, smoking status, alcohol intake, regular exercise, history of hypertension, history of diabetes, total cholesterol, resting heart rate, and neutrophil-lymphocyte ratio, all of which are known as conventional risk factors. Previous studies, including the study by Park et al.,13,20) showed that a higher resting heart rate and neutrophil-lym-phocyte ratio were independently associated with arterial stiffness. Based on these previous studies, we designed model 2 to contain known confounding factors.
2. Brachial-Ankle Pulse Wave Velocity Measurement
An automatic waveform analyzer was used to measure PWV. This in-strument simultaneously records venous blood pressure and arterial blood pressure at both brachial arteries and ankles while also per-forming a phonocardiogram and electrocardiogram. Participants were examined in the supine position after 10 minutes of bed rest. Electro-cardiogram electrodes were placed on both wrists, and a microphone for the phonogram was placed on the left edge of the sternum. Pneu-monic cuffs were wrapped around both upper arms and ankles and connected to a plethysmographic sensor to determine the volume pulse waveform. Waveforms for the upper arm (brachial artery) and ankle (tibial artery) were stored for 10-second sample times with auto-matic gain analysis and quality adjustment. Oscillometric pressure sensors were attached to the cuffs to measure blood pressure in the four extremities. The ba-PWVs were recorded using a semiconductor pressure sensor (1,200 Hz sample acquisition frequency) and calculat-ed using the following equation: (La-Lb)/ΔTba. La and Lb were de-fined as the distance from the aortic valve to the elbow and to the an-kle, respectively. The distance from the suprasternal notch to the el-bow (La) and from the suprasternal notch to the ankle (Lb) were cal-culated as follows: La=0.2195×height of participant (cm)-2.0734 and Lb=0.8129×height of participant (cm)+12.328. The time interval be-tween the arm and ankle distance (ΔTba) was defined as the pulse transit time between the brachial and tibial arterial pressure wave-forms. La and Lb were estimated automatically based on the heights of the participants.
3. Statistical Analysis
Q3=4.5 to 4.9, and Q4≥5.0 mg/dL. Demographic and biochemical characteristics of the study population according to uric acid quartiles were compared using a one-way analysis of variance for continuous variables and the chi-square test for categorical variables. Individuals were divided into two groups based on ba-PWV: a high group and a low group. A high ba-PWV was defined as a ba-PWV of more than 1,450 cm/s.13) The ORs for high ba-PWV were calculated using multi-variate logistic regression analysis after adjusting for confounding vari-ables across uric acid quartiles. All analyses were conducted using IBM SPSS statistical software ver. 22.0 (IBM Corp., Armonk, NY, USA). All statistical tests were two-sided, and statistical significance was as-sumed when P<0.05.
RESULTS
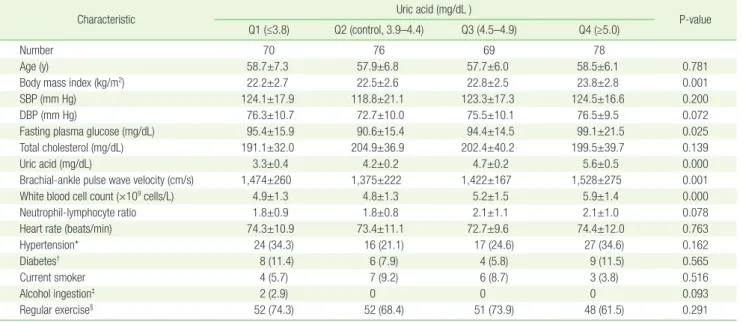
In this study, 293 postmenopausal women were divided into quartiles according to their uric acid levels. Characteristics of the study popula-tion are shown in Table 1. BMI, systolic blood pressure, diastolic blood pressure, fasting plasma glucose level, triglyceride level, resting heart rate, and the WBC count, were highest in the fourth quartile. In the second serum uric acid quartile, the ba-PWV was the lowest (Q1, 1,474 cm/s; Q2, 1,375 cm/s; Q3, 1,422 cm/s, Q4, 1,528 cm/s). We designated Q2 as the control group based on ba-PWV level.
In multiple logistic regression model 1, the corresponding ORs (95% confidence intervals [CIs]) for high ba-PWV across uric acid quartiles 1, 3, and 4 were 2.561 (1.261–5.202), 2.954 (1.454–6.002), and 4.170 (2.086–8.337). Although the first quartile had a lower serum uric acid level than the second quartile, Q1 had a higher risk for ba-PWV than did Q2. Multivariate-adjusted ORs (95% CI) for the highest versus the lowest quartiles of uric acid were 4.375 (Q4, 1.923–9.949) and 2.642 (Q1, 1.095–6.373) in model 2, respectively (Table 2).
DISCUSSION
In this cross-sectional study, we found that serum uric acid level quar-tiles had a J-shaped association with arterial stiffness in Korean post-menopausal women. Q2 (uric acid level, 3.9–4.4) had the lowest OR value for high ba-PWV across the uric acid quartiles, while the risk of arterial stiffness was greatest in Q4 (uric acid level ≥5.0). Interestingly, although the first quartile had a lower serum uric acid level than the second quartile, Q1 (uric acid level ≤3.8) had a higher risk for ba-PWV than did Q2 (uric acid level, 3.9–4.4). These results were similar after Table 1. Clinical and chemical characteristics of the study population according to uric acid quartile
Characteristic Uric acid (mg/dL ) P-value
Q1 (≤3.8) Q2 (control, 3.9–4.4) Q3 (4.5–4.9) Q4 (≥5.0)
Number 70 76 69 78
Age (y) 58.7±7.3 57.9±6.8 57.7±6.0 58.5±6.1 0.781
Body mass index (kg/m2) 22.2±2.7 22.5±2.6 22.8±2.5 23.8±2.8 0.001
SBP (mm Hg) 124.1±17.9 118.8±21.1 123.3±17.3 124.5±16.6 0.200
DBP (mm Hg) 76.3±10.7 72.7±10.0 75.5±10.1 76.5±9.5 0.072
Fasting plasma glucose (mg/dL) 95.4±15.9 90.6±15.4 94.4±14.5 99.1±21.5 0.025
Total cholesterol (mg/dL) 191.1±32.0 204.9±36.9 202.4±40.2 199.5±39.7 0.139
Uric acid (mg/dL) 3.3±0.4 4.2±0.2 4.7±0.2 5.6±0.5 0.000
Brachial-ankle pulse wave velocity (cm/s) 1,474±260 1,375±222 1,422±167 1,528±275 0.001
White blood cell count (×109 cells/L) 4.9±1.3 4.8±1.3 5.2±1.5 5.9±1.4 0.000
Neutrophil-lymphocyte ratio 1.8±0.9 1.8±0.8 2.1±1.1 2.1±1.0 0.078
Heart rate (beats/min) 74.3±10.9 73.4±11.1 72.7±9.6 74.4±12.0 0.763
Hypertension* 24 (34.3) 16 (21.1) 17 (24.6) 27 (34.6) 0.162
Diabetes† 8 (11.4) 6 (7.9) 4 (5.8) 9 (11.5) 0.565
Current smoker 4 (5.7) 7 (9.2) 6 (8.7) 3 (3.8) 0.516
Alcohol ingestion‡ 2 (2.9) 0 0 0 0.093
Regular exercise§ 52 (74.3) 52 (68.4) 51 (73.9) 48 (61.5) 0.291
Values are presented as mean±standard deviation or number (%). SBP, systolic blood pressure; DBP, diastolic blood pressure.
*Defined as a SBP ≥140 mm Hg, DBP ≥90 mm Hg, or a history of the disorder. †Defined as fasting plasma glucose level ≥126 mg/dL or a history of the disorder. ‡≥140 g alcohol consumption per week. §≥3 times per week.
Table 2. Odds ratios and 95% confidence intervals for brachial-ankle pulse wave velocity according to uric acid quartiles
Uric acid quartiles Odds ratio (95% confidence interval)
Model 1* Q1 2.561 (1.261–5.202) Q2 (control) Reference Q3 2.954 (1.454–6.002) Q4 4.170 (2.086–8.337) Model 2† Q1 2.642 (1.095–6.373) Q2 (control) Reference Q3 4.305 (1.798–10.307) Q4 4.375 (1.923–9.949)
*Unadjusted. †Adjusted for age, body mass index, smoking status, alcohol intake, regular exercise, history of hypertension, history of diabetes, total cholesterol, resting heart rate, and neutrophil-lymphocyte ratio.
adjusting for age, BMI, smoking status, alcohol intake, regular exercise, history of hypertension, history of diabetes, total cholesterol level, rest-ing heart rate, and neutrophil-lymphocyte ratio. The observed rela-tionship between the lowest serum uric acid level quartile and ba-PWV in Korean postmenopausal women has several possible explana-tions. First, uric acid can function as an antioxidant.1,4,21) Thus, an indi-vidual with a low serum uric acid level may have weak antioxidant ca-pacity, which could be associated with increased vascular inflamma-tion and structural changes within the arterial walls.1,4,21) Additionally, Kanda et al.22) reported that low serum uric acid levels were associated with the loss of renal function. Based on this study, low serum uric acid levels could therefore increase systemic vascular inflamma-tion.22-24) Menopause may be another reason for the observed findings, because menopause causes hormonal changes and is associated with metabolic disease and increased insulin resistance.14,15,17,19,25) For ex-ample, estrogen is known to decrease inflammatory markers, and es-trogen secretion changes during menopause.16) Therefore, menopause could result in the increased expression of inflammatory markers, and postmenopausal women may be more prone to have inflammation than are premenopausal women. Postmenopausal women with low serum uric acid levels may show poor resistance to vascular oxidative stress and therefore consequently display progressive arterial stiffness. Shin et al.2) examined 779 Korean adults and reported that serum uric acid level in the normal range had a positive association with arterial stiffness in men, but not in women. The serum uric acid quartiles in women had a linear association with the ba-PWV; however, after ad-justing for several possible confounding factors, serum uric acid quar-tiles were found to not be independently associated. There are several possible reasons for this discrepancy between the sexes. First, 234 women were enrolled in the study, while less men were enrolled. Sec-ond, postmenopausal women, which may have a reduced antioxidant capacity, were included in this study and could have accounted for this difference between sexes. However, in this study, we included an abnormal range in serum uric acid level in our analysis. In doing so, we found that serum uric acid level had a J-shaped association with arterial stiffness in postmenopausal women.
We used a cut-off value of ba-PWV of 1,450 cm/s, because Park et al.,13) who had examined the association between resting heart rate and arterial stiffness in a previous study, showed that a ba-PWV value greater than 1,450 cm/s was a powerful predictor of cardiovascular disease.
This study had some limitations. First, it was a cross-sectional study, and the study population was recruited at only one center. Second, we cannot exclude the possibility that subjects were taking diuretics or al-lopurinol, both of which can strongly influence serum uric acid levels. Third, we did not examine and compare serum uric acid levels in Ko-rean men and premenopausal women. Finally, we did not determine the mechanism underlying the interaction between uric acid and ba-PWV.
This is the first study to report an association between serum uric acid levels and ba-PWV in postmenopausal women in Korea. In the
near future, additional studies should examine the effects of increasing serum uric acid levels in postmenopausal women.
In conclusion, in this cross-sectional study, we found that the serum uric acid level has a J-shaped association with arterial stiffness in post-menopausal women.
CONFLICT OF INTEREST
No potential conflict of interest relevant to this article was reported.
REFERENCES
1. Sautin YY, Johnson RJ. Uric acid: the oxidant-antioxidant paradox. Nu-cleosides Nucleotides Nucleic Acids 2008;27:608-19.
2. Shin JY, Lee HR, Shim JY. Significance of high-normal serum uric acid level as a risk factor for arterial stiffness in healthy Korean men. Vasc Med 2012;17:37-43.
3. Becker BF. Towards the physiological function of uric acid. Free Radic Biol Med 1993;14:615-31.
4. Davies KJ, Sevanian A, Muakkassah-Kelly SF, Hochstein P. Uric acid-iron ion complexes: a new aspect of the antioxidant functions of uric acid. Biochem J 1986;235:747-54.
5. Fuhua P, Xuhui D, Zhiyang Z, Ying J, Yu Y, Feng T, et al. Antioxidant status of bilirubin and uric acid in patients with myasthenia gravis. Neuroimmunomodulation 2012;19:43-9.
6. Dawson J, Quinn T, Walters M. Uric acid reduction: a new paradigm in the management of cardiovascular risk? Curr Med Chem 2007;14: 1879-86.
7. Yu TY, Jee JH, Bae JC, Jin SM, Baek JH, Lee MK, et al. Serum uric acid: a strong and independent predictor of metabolic syndrome after ad-justing for body composition. Metabolism 2016;65:432-40.
8. Choi H, Kim HC, Song BM, Park JH, Lee JM, Yoon DL, et al. Serum uric acid concentration and metabolic syndrome among elderly Koreans: the Korean Urban Rural Elderly (KURE) study. Arch Gerontol Geriatr 2016;64:51-8.
9. Hakoda M, Masunari N, Yamada M, Fujiwara S, Suzuki G, Kodama K, et al. Serum uric acid concentration as a risk factor for cardiovascular mortality: a longterm cohort study of atomic bomb survivors. J Rheu-matol 2005;32:906-12.
10. Li YH, Lin GM. Sex differences in the association between serum uric acid and cardiac mortality in Asian patients with established coronary artery disease: a revisit of the ET-CHD registry in Taiwan, 1997-2003. J Cardiol 2016;68:461.
11. Laurent S, Boutouyrie P, Asmar R, Gautier I, Laloux B, Guize L, et al. Aortic stiffness is an independent predictor of all-cause and cardiovas-cular mortality in hypertensive patients. Hypertension 2001;37:1236-41.
12. Boutouyrie P, Tropeano AI, Asmar R, Gautier I, Benetos A, Lacolley P, et al. Aortic stiffness is an independent predictor of primary coronary events in hypertensive patients: a longitudinal study. Hypertension 2002;39:10-5.
13. Park BJ, Lee HR, Shim JY, Lee JH, Jung DH, Lee YJ. Association be-tween resting heart rate and arterial stiffness in Korean adults. Arch Cardiovasc Dis 2010;103:246-52.
14. Campesi I, Occhioni S, Tonolo G, Cherchi S, Basili S, Carru C, et al. Ageing/menopausal status in healthy women and ageing in healthy men differently affect cardiometabolic parameters. Int J Med Sci 2016;13:124-32.
15. Ama Moor VJ, Nansseu JR, Nouaga ME, Noubiap JJ, Nguetsa GD, Tchanana G, et al. Assessment of the 10-year risk of cardiovascular events among a group of Sub-Saharan African post-menopausal women. Cardiol J 2016;23:123-31.
16. Au A, Feher A, McPhee L, Jessa A, Oh S, Einstein G. Estrogens, inflam-mation and cognition. Front Neuroendocrinol 2016;40:87-100. 17. Stachowiak G, Pertynski T, Pertynska-Marczewska M. Metabolic
disor-ders in menopause. Prz Menopauzalny 2015;14:59-64.
18. Conti FF, Brito Jde O, Bernardes N, Dias Dda S, Malfitano C, Morris M, et al. Positive effect of combined exercise training in a model of meta-bolic syndrome and menopause: autonomic, inflammatory, and oxi-dative stress evaluations. Am J Physiol Regul Integr Comp Physiol 2015;309:R1532-9.
19. Meirelles RM. Menopause and metabolic syndrome. Arq Bras Endo-crinol Metabol 2014;58:91-6.
20. Park BJ, Shim JY, Lee HR, Lee JH, Jung DH, Kim HB, et al. Relationship
of neutrophil-lymphocyte ratio with arterial stiffness and coronary calcium score. Clin Chim Acta 2011;412:925-9.
21. Waring WS, Webb DJ, Maxwell SR. Systemic uric acid administration increases serum antioxidant capacity in healthy volunteers. J Cardio-vasc Pharmacol 2001;38:365-71.
22. Kanda E, Muneyuki T, Kanno Y, Suwa K, Nakajima K. Uric acid level has a U-shaped association with loss of kidney function in healthy people: a prospective cohort study. PLoS One 2015;10:e0118031. 23. Odden MC, Amadu AR, Smit E, Lo L, Peralta CA. Uric acid levels,
kid-ney function, and cardiovascular mortality in US adults: National Health and Nutrition Examination Survey (NHANES) 1988-1994 and 1999-2002. Am J Kidney Dis 2014;64:550-7.
24. Jung DH, Lee YJ, Lee HR, Lee JH, Shim JY. Association of renal mani-festations with serum uric acid in Korean adults with normal uric acid levels. J Korean Med Sci 2010;25:1766-70.
25. Park BJ, Park JO, Kang HT, Lee YJ. Elevated intraocular pressure is as-sociated with metabolic syndrome in postmenopausal women: the Korean National Health and Nutrition Examination Survey. Meno-pause 2013;20:742-6.