저작자표시-비영리-변경금지 2.0 대한민국 이용자는 아래의 조건을 따르는 경우에 한하여 자유롭게 l 이 저작물을 복제, 배포, 전송, 전시, 공연 및 방송할 수 있습니다. 다음과 같은 조건을 따라야 합니다: l 귀하는, 이 저작물의 재이용이나 배포의 경우, 이 저작물에 적용된 이용허락조건 을 명확하게 나타내어야 합니다. l 저작권자로부터 별도의 허가를 받으면 이러한 조건들은 적용되지 않습니다. 저작권법에 따른 이용자의 권리는 위의 내용에 의하여 영향을 받지 않습니다. 이것은 이용허락규약(Legal Code)을 이해하기 쉽게 요약한 것입니다. Disclaimer 저작자표시. 귀하는 원저작자를 표시하여야 합니다. 비영리. 귀하는 이 저작물을 영리 목적으로 이용할 수 없습니다. 변경금지. 귀하는 이 저작물을 개작, 변형 또는 가공할 수 없습니다.
A Thesis for the Degree of Master of Science
Enhanced production of 2’-fucosyllactose by
introducing fucosyllactose exporter and
optimizing biosynthetic pathway of GDP-
L-fucose
in engineered Corynebacterium glutamicum
대사공학적으로 설계된
코리네박테리움 글루타미쿰에서
푸코실락토오스 수송체 도입과
GDP-
L-fucose 경로의 최적화를 통한
2’-푸코실락토오스 생산 증대
By
Do-Haeng Lee
Department of Agricultural Biotechnology
Seoul National University
A Thesis for the Degree of Master of Science
Enhanced production of 2’-fucosyllactose by
introducing fucosyllactose exporter and
optimizing biosynthetic pathway of GDP-
L-fucose
in engineered Corynebacterium glutamicum
Advisor : Professor Jin-Ho Seo
Submitted in Partial Fulfillment of the Requirements
for the Degree of Master of Science
By
Do-Haeng Lee
Department of Agricultural Biotechnology
Seoul National University
農 學 碩 士 學 位 論 文
Enhanced production of 2’-fucosyllactose by introducing fucosyllactose exporter and optimizing biosynthetic pathway
of GDP-L-fucose in engineered Corynebacterium glutamicum
대사공학적으로 설계된 코리네박테리움 글루타미쿰에서 푸코실락토오스 수송체 도입과 GDP-L-fucose 경로의 최적화를 통한2’-푸코실락토오스 생산 증대 指導敎授 徐鎭浩 이論文을 農學碩士學位論文으로 提出함 2018年 2月 서울大學校大學院 農生命工學部 食品生命工學 專攻 李道行 李道行의 農學碩士學位論文을 認准함 2018年 2月 委員長 유 상 렬 (인) 副委員長 서 진 호 (인) 委員 최 영 진 (인)
i
ABSTRACT
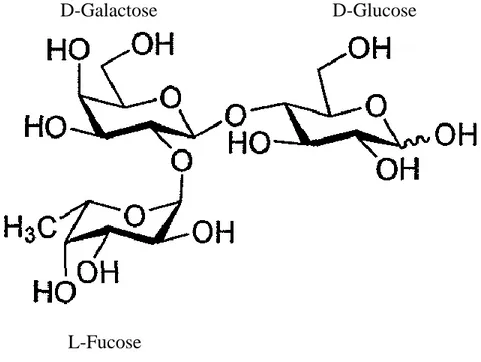
Human milk contains a considerable amount of oligosaccharides (about 15 g/L), unlike other mammalian milks. Human milk oligosaccharides (HMOs) consist of 200-300 kinds of oligosaccharides. In particular, 80% of HMOs are fucosylated oligosaccharides, and 2’-fucosyllactose (2’-FL) is the most abundant oligosaccharide among HMOs. 2’-FL is a trisaccharide composed of lactose and fucose. Fucose binds to the galactose of lactose through α1-2 linkage. 2’-FL has many physiological functions such as prebiotic effects, inhibition of intestinal adhesion of pathogens and enterotoxin secreted from pathogens and alleviation of the inflammatory responses.
Corynebacterium glutamicum, which is approved as GRAS
(Generally Recognized As Safe), was used to produce 2'-FL in previous researches. In order to biosynthesize 2'-FL, GDP-L-fucose and lactose
are required. The wild-type C. glutamicum lacks the GDP-L-fucose
biosynthetic pathway, so the genes for biosynthesis of GDP-L-fucose
were introduced. In addition, the lactose permease gene from
Escherichia coli was introduced since the wild type C. glutamicum
cannot import lactose and the codon-optimized α-1,2 fucosyltransferase gene from Helicobacter pylori was introduced for fucosylation. Using the above-mentioned metabolically engineered strain, 11.5 g/L of 2’-FL was produced in fed-batch fermentation.
In this study, several attempts have been made to enhance 2'-FL production. First, the ABC transporter permease gene from
ii
As a result, it showed a 38% improvement in 2’-FL secretion per gram of cells than the strain constructed previously. The concentration of 2'-FL in the medium was 830 mg/L, which was 52% higher than that of the strain constructed in previous research.
Next, the GDP-L-fucose biosynthetic pathway was optimized to
enhance the metabolic flux to GDP-L-fucose. In the system for
synthesizing GDP-L-fucose using glucose only, the metabolic flux
mostly directed to glycolysis for cell growth. In order to solve this problem, the phosphofructokinase A (pfkA) gene was disrupted by the double crossover method using a pK19mobsacB vector, and the ΔP strain that blocked the first major pathway of the glycolysis (Fructose 6-phosphate → Fructose 1,6-bisphosphate) was constructed. By using a mixture of glucose and fructose as a carbon source, a two track system was constructed in which glucose was used for synthesis of GDP-L
-fucose and fructose for cell growth. As a result, 2’-FL was produced at a concentration of 1.22 g/L in flask fermentation, and 12.6 g/L in fed-batch fermentation.
However, cell growth was delayed in the middle of fermentation, and the consumption rate of glucose and fructose continuously changed, making it difficult to maintain a constant concentration during fermentation. To solve this problem, glucose was supplied intermittently while supplying fructose to maintain a constant concentration. As a result, 2.05 g/L of 2’-FL was produced in flask fermentation. But, in fed-batch fermentation, cell growth was delayed for a long time when glucose was supplied. The cell adaptation process was added at the pre-culture step in which the cells to be inoculated into
iii
the main culture were prepared. After establishing an environment similar to that of the main culture, the cells were cultured up to the mid-log phase and inoculated into the main culture. As a result, the delay of cell growth was solved, and 21.5 g/L of 2’-FL was produced in fed-batch fermentation. This result is 87% higher than the amount of 2’-FL produced in the previous research.
Finally, by changing the culture temperature from 30℃ to 37℃ in the latter stage of the fermentation, the fluidity of the cell membrane was increased to allow the intracellular 2’-FL to go out of the cells. As a result, 2.61 g/L of 2’-FL was produced in flask fermentation, which is 379% higher than that the amount of 2’-FL produced in the previous research.
In this study, a microbial bioprocess was developed to produce 2’-FL with high titer and productivity. It is believed that the bioprocess developed in this study would provide a technical framework for industrial production of 2’-FL.
Keywords: Metabolic engineering, 2’-fucosyllactose, GDP-L-fucose,
2’-fucosyllactose exporter, pK19mobsacB, phosphofructokinase A, fed-batch fermentation, Corynebacterium glutamicum
iv
CONTENTS
ABSTRACT··· i
CONTENTS ··· iv
LIST OF TABLES ··· vii
LIST OF FIGURES ··· viii
I. INTRODUCTION ··· 1
1. Human milk ··· 1
2. Human milk oligosaccharides (HMOs) ··· 4
3. 2’-Fucosyllactose (2’-FL) ··· 7
3.1. Fucosyloligosaccharides ··· 7
3.2. Methods for 2’-FL production ··· 10
3.3. Biosynthesis of GDP-L-fucose ··· 11
3.4. Fucosyltransferase ··· 14
4. Corynebacterium glutamicum ··· 16
4.1. Characterization of Corynebacterium glutamicum ··· 16
4.2. C. glutamicum as a 2’-FL producer ··· 17
5. Research objectives ··· 21
II. MATERIALS AND METHODS ··· 22
1. Reagents and Enzymes ··· 22
2. Strains and Plasmids ··· 22
2.1. Strains ··· 22
2.2. Plasmids ··· 23
v
3.1. Preparation of DNA ··· 30
3.2. Polymerase Chain Reaction (PCR) ··· 30
3.3. Digestion and ligation of DNA ··· 30
3.4. Transformation of E. coli ··· 31
3.5. Electroporation of C. glutamicum ··· 31
4. Gene disruption progress ··· 33
4.1. Construction of gene disruption vector ··· 33
4.2. Screening of gene disrupted strain ··· 33
5. Media and Culture conditions ··· 35
5.1. Media ··· 35
5.2. Culture conditions ··· 35
6. Fermentation analysis ··· 38
6.1. Dry cell weight ··· 38
6.2. Quantification of metabolites concentrations ··· 38
6.3. Measurement of the amount of intracellular 2’-FL ··· 38
III. RESULTS AND DISCUSSIONS ··· 40
1.Introduction of 2’-FL exporter from Bifidobacterium infantis · 40 1.1. Construction of the strain expressing 2’-FL exporter ··· 40
1.2. Flask fermentation of the strain expressing 2’-FL exporter · 43 1.3. Measurement of 2’-FL secretion ability ··· 51
2. Disruption of phosphofructokinase A gene (pfkA) ··· 54
2.1. New strategy for 2’-FL production ··· 54
2.2. Construction of pfkA knock-out strain ··· 56
2.3. Optimization of carbon source condition ··· 60
vi
3.1. Fed-batch fermentation of △P BCGW TTLE(CO) ··· 66
3.2. Optimization of fed-batch fermentation process ··· 70
4. Change of the culture temperature condition ··· 80
IV. CONCLUSIONS ··· 86
V. REFERENCES ··· 89
vii
LIST OF TABLES
Table 1. Composition of human and bovine milk ··· 3
Table 2. Contents of major carbohydrates in human milk ··· 9
Table 3. List of strains and plasmids used in this study ··· 25
Table 4. List of primers used in this study ··· 27
Table 5. Summary of flask fermentation under 10 g/L lactose of the BCGW TTL(CO) and BCGW TTLE(CO) ··· 49
Table 6. Summary of flask fermentation of △P BCGW TTLE(CO) under the various mixed sugar conditions ··· 65
Table 7. Summary of fed-batch fermentation of △P BCGW TTLE(CO) under the glucose-fructose 3:7 mixture condition ··· 69
Table 8. Summary of flask fermentation of △P BCGW TTLE(CO) under the various glucose addition conditions ··· 75
Table 9. Summary of fed-batch fermentation of △P BCGW TTLE(CO) by a strategy based on cell adaptation ··· 78
Table 10. Summary of flask fermentation of △P BCGW TTLE(CO) under the various fermentation conditions ··· 85
viii
LIST OF FIGURES
Figure 1. Typical HMO structures ··· 6
Figure 2. Structure of 2’-fucosyllactose (2’-FL) ··· 8
Figure 3. Structure of guanosine 5’-diphospho-β-L-fucose (GDP-L -fucose) ··· 12
Figure 4. De novo biosynthetic pathway of GDP-L-fucose ··· 13
Figure 5. Corynebacterium glutamicum ··· 19
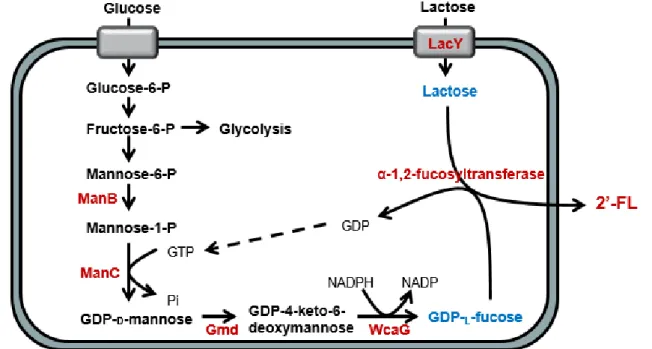
Figure 6. Biosynthesis pathway of 2’-FL from glucose and lactose in engineered C. glutamicum ··· 20
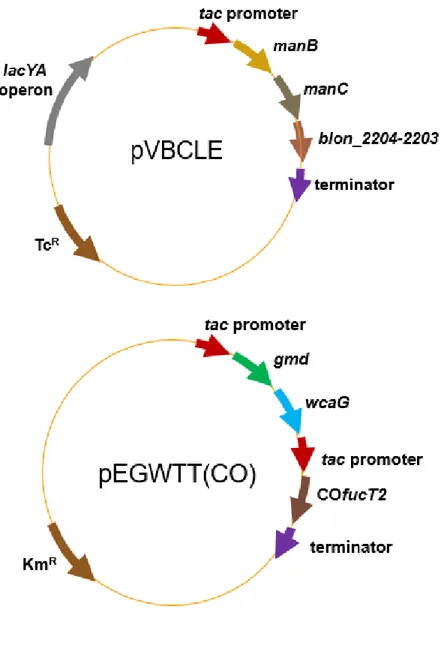
Figure 7. Genetic maps of plasmids pVBCLE and pEGWTT(CO) ·· 28
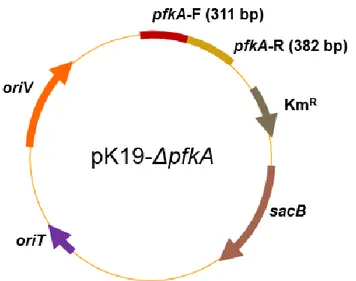
Figure 8. Genetic maps of plasmids pK19-△pfkA ··· 29
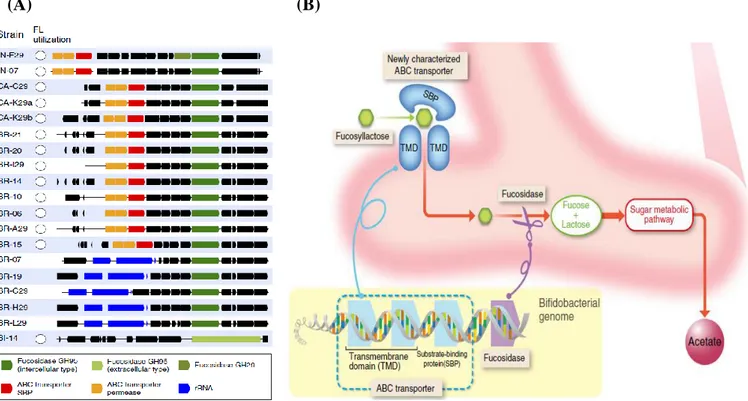
Figure 9. FL utilization in bifidobacteria ··· 42
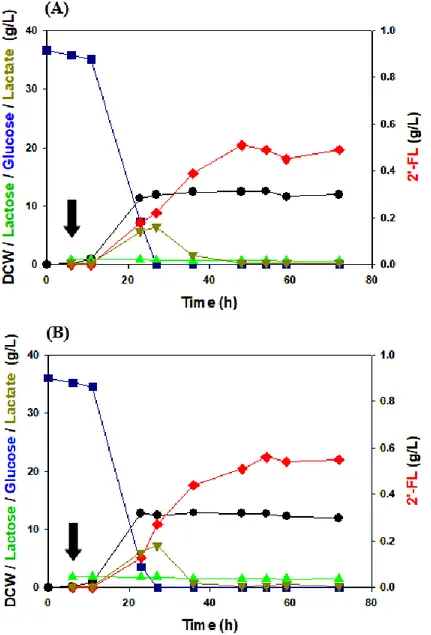
Figure 10. Flask fermentation of BCGW TTL(CO) ··· 45
Figure 11. Flask fermentation of BCGW TTLE(CO) ··· 47
Figure 12. Intracellular 2’-FL of (A) BCGW TTL(CO) and (B) BCGW TTLE(CO) ··· 50
Figure 13. Measurement of 2’-FL secretion ability of BCGW TTL(CO) and BCGW TTLE(CO) ··· 52
Figure 14. New strategy for 2’-FL production ··· 55
Figure 15. Confirmation of pfkA disruption by colony PCR ··· 59
Figure 16. Growth properties of △P in various ratios of glucose and fructose mixture ··· 62
Figure 17. Flask fermentation of △P BCGW TTLE(CO) ··· 63
Figure 18. Fed-batch fermentation of △P BCGW TTLE(CO) ··· 68
ix
Figure 20. Fed-batch fermentation of △P BCGW TTLE(CO) ··· 76 Figure 21. Fed-batch fermentation of △P BCGW TTLE(CO) after cell
adaptation at the pre-culture step ··· 77 Figure 22. LC profile of 84-hour fed-batch fermentation sample of △P
BCGW TTLE(CO) ··· 79 Figure 23. Intracellular 2’-FL confirmed in fed-batch fermentation of
△P BCGW TTLE(CO) ··· 82 Figure 24. Flask fermentation of △P BCGW TTLE(CO) under the
various fermentation conditions ··· 83 Figure 25. Intracellular 2’-FL of △P BCGW TTLE(CO) under the
1
I. INTRODUCTION
1. Human milk
Human milk is secreted from the female mammary gland in the second half of pregnancy and after delivery. It is considered the best diet for newborn nutrition. In addition to providing all the nutrients needed for growth and development to the baby, human milk contains a variety of bioactive factors that promote healthy colonization of the neonatal intestine, prevent infections and support the immune system's maturation (Jantscher-Krenn and Bode 2012).
By the 1950s, breastfeeding had been considered to be practiced by the uneducated and those of lower classes. The practice was considered old-fashioned for those who could not afford infant formula. In contrast, infant formula was considered superior to breastfeeding (Nathoo and Ostry 2009). However, as the functionality of human milk has been reported since 1960s, breastfeeding has resumed in Canada and the US, especially among more educated, affluent women (Nathoo and Ostry 2009). Currently the World Health Organization (WHO) recommends exclusive breastfeeding for six months after birth.
Human milk is composed of 3~5% fat, 0.8~0.9% protein, 6.9~7.2% carbohydrate, and 0.2% mineral salts and other constituents (Jenness 1979). These roughly classified components are subdivided into many useful ingredients that offer health benefits as well as primary nutrient sources. These health benefits include prebiotic effects, prevention of infection by pathogens, modulation of immune responses, reduction of inflammatory processes, neurological development, and enhancement
2
of vaccine responses (Lanting, Huisman et al. 1994, Severin and Wenshui 2005, Boehm and Stahl 2007, Hahn-Zoric, Fulconis et al. 2008, Jantscher-Krenn and Bode 2012).
The composition of human milk and bovine milk is shown in Table 1. There is a significant difference. Oligosaccharides content of human milk is much higher than that of bovine milk. The high concentration of oligosaccharides is the most distinctive feature of human milk. The oligosaccharides contained in human milk are involved in many physiological functions.
3
Table 1. Composition of human and bovine milk
Contents Human milk Bovine milk Fat (g/L)
Total (g/L) 42 38
Fatty acids-length ≤8C (%) trace 6
Polyunsaturated fatty acids
(%) 14 3 Protein (g/L) Total 11 33 Casein 0.4 3 25 a-lactalbumin 3 1 Lactoferrin 2 Trace IgA 1 0.03 IgG 0.01 0.6 Lysozyme 0.5 Trace Serum albumin 0.5 0.3 β-lactoglobulin - 3 Carbohydrate (g/L) Lactose 70 48 Oligosaccharides 5 - 15 0.05 Minerals (g/L) Calcium 0.3 1.25 Phosphorus 0.14 0.93 Sodium 0.15 0.47 Potassium 0.55 1.55 Chlorine 0.43 1.03
4
2. Human milk oligosaccharides (HMOs)
The oligosaccharides contained in human milk are called Human Milk Oligosaccharides (HMOs). They are the third most abundant ingredient in human milk, followed by lactose and fat. Based on numerous researches, it is generally agreed that this key ingredient represents 5-15 g/L of mature milk and approximately 22 g/L of colostrum (Newburg 1997, Coppa, Pierani et al. 1999, Kunz, Rudloff et al. 2000, Rivero-Urgell and Santamaria-Orleans 2001, Bode 2012).
To date, more than two hundred different HMOs have been identified and structurally characterized. Actually, approximately 200 different kinds of HMOs have been discovered in human milk (Ninonuevo, Park et al. 2006, Bode 2012, Jantscher-Krenn and Bode 2012). The composition of HMOs is very complex. The physiological functions of oligosaccharides are closely related to their structure. Because HMOs are not digested in the small intestine of infants, they keep their structure in there, which explains why there are so many different HMOs (Miller and McVeagh 2007). Basically, HMOs are composed of the five monosaccharides; D-glucose (Glc), D-galactose (Gal),
N-acetylglucosamine (GlcNAc), L-fucose (Fuc), and sialic acid [N-acetylneuraminic acid (NeuAc)] with lactose (Lac) core at the reducing end (Bode 2012, Jantscher-Krenn and Bode 2012). Biosynthesis of HMOs begins at the lactose core. Lactose can be elongated by an enzymatic attachment of GlcNAc residues linked in β1-3 or β1-6 linkage to the Gal residue followed by further addition of Gal in the β 1-3 (lacto-N-biose) or β1-4 bond (N-acetyllactosamine) (Fig. 1A). Further modifications are derived from attachments of lactosamine, fucose,
5
and/or NeuAc residues at different positions of the core region and the core elongation chain (Kunz, Rudloff et al. 2000, McVeagh and Miller 2008, Bode 2012). Elongation with lacto-N-biose terminates the chain, while N-acetyllactosamine can be extended by the addition of one of the two disaccharides. The β1-6 linkage between two disaccharide units introduces a chain branch. Branched structures are referred as iso-HMO; linear structures without branches as para-HMO (Fig. 1B). Lactose or the elongated oligosaccharide chain can be fucosylated at α1-2, α1-3 or α1-4 linkage and/or sialylated at α2-3 or α2-6 linkage (Fig. 1C–E). Also, some HMOs have several isomeric forms, such as lacto-N-fucopentaose (LNFP, Fig. 1D) or sialyllacto-N-tetraose (LST, Fig. 1E).
6
Figure 1. Typical HMO structures. (A) HMOs follow a basic structural blueprint. (Monosaccharide key is shown at the bottom of the figure.) (B) Lactose can be fucosylated or sialylated in different linkages to generate trisaccharides. (C) Lactose can be elongated by addition of either lacto-N-biose (type I) or N-acetyllactosamine (type II) disaccharides. Addition of disaccharides to each other in the β1-3 linkage leads to linear chain elongation (para-HMO); a β1-6 linkage between two disaccharides introduces chain branching (iso-HMO). (D) Elongated type I or II chains can be fucosylated in different linkages to form a variety of structural isomers, some of which have Le blood group specificity. (E) The elongated chains can also be sialylated in different linkages to form structural isomers. Disialylated lacto-N-tetraose (bottom right) prevents NEC in neonatal rats (Bode 2012).
7
3. 2’-Fucosyllactose (2’-FL)
3.1. Fucosyloligosaccharides
As mentioned above, about 200 kinds of HMOs have been found in human milk. Most HMOs are fucosylated, Fucosyloligosaccharides. 50~80% of the HMOs are fucosylated and 10~20% are sialylated (Kunz, Rudloff et al. 2000, Ninonuevo, Park et al. 2006, Bode 2012). They contain fucose and 3-8 sugars in size, in some cases up to 32 sugars. Fucosyloligosaccharides are attracting attention as their functions. They are used as a growth factor for Bifidobacterium or Lactobacillus and also they act as soluble analogues of cell surface receptors, so preventing infants from infection of enteric pathogens and binding of toxins (Morrow, Ruiz-Palacios et al. 2004, Newburg, Ruiz-Palacios et al. 2005).
Among HMOs, 2’-fucosyllactose (2’-FL) is the most abundant fucosyloligosaccharide in human milk and it has most of the physiological properties of HMOs (Table 2) (Chaturvedi, Warren et al. 2001, Castanys‐Muñoz, Martin et al. 2013, Smilowitz, O’Sullivan et al. 2013).
2’-FL is a trisaccharide composed of lactose and fucose (Fig. 2). Fucose binds to the galactose of lactose through α1-2 linkage. So, 2’-FL is referred as L-fucopyranosyl-(1→2)-D-galactopyranosyl-(1→ 4)-D-glucose. In infants, 2’-FL is digested by fucosidase of
Bifidobacterium and playing a role as soluble prebiotic fiber.
Furthermore, it could modulate immune response by balancing Th1 and Th2 cells and protect infants from the risk of infection by pathogens. It is reported that 2’-FL inhibits adhesion of Campylobacter jejuni,
8
Pseudomonas aeruginosa, enterotoxin of Escherichia coli, Calcivirus
etc. Additionally, it helps to reduce inflammatory processes by preventing adhesion of leukocyte and reducing extravasation at endothelial cells (Castanys‐Muñoz, Martin et al. 2013). Therefore, it can be said that 2’-FL is a key component of HMOs. However, unfortunately, about 20% of women around the world cannot synthesize 2’-FL because of genetic defects (Castanys‐Muñoz, Martin et al. 2013). For these reasons, movements to utilize 2’-FL as a functional food and therapeutic material are emerging and also it has generated the need for larger amounts of 2’-FL (Han, Kim et al. 2012).
Figure 2. Structure of 2’-fucosyllactose (2’-FL)
D-Galactose D-Glucose
9
Table 2. Contents of major carbohydrates in human milk (Smilowitz, O’Sullivan et al. 2013)
Metabolite Contents (µ mole/L) 2’-Fucosyllactose (2’-FL) 2.50 x 10³ ± 1.70 x 10³ 3-Fucosyllactose (3-FL) 2.10 x 10³ ± 1.20 x 10³ 3’-Sialyllactose (3’-SL) 144 ± 43.7 6’-Sialyllactose (6’-SL) 119 ± 54.9 Fucose 182 ± 135 Galactose 92.3 ± 49.1 Glucose 1.50 x 10³ ± 530 Lactodifucotetraose (LDFT) 266 ± 199 Lacto-N-neotetraose (LNnT) 121 ± 67.5 Lacto-N-fucopentaose (LNFP Ⅰ) 189 ± 159 Lacto-N-fucopentaose (LNFP Ⅱ) 210 ± 168 Lacto-N-fucopentaose (LNFP Ⅲ) 233 ± 74.0 Lacto-N-tetraose (LNT) 506 ± 284 Lactose 170 x 103 ± 7.30 x 10³
10
3.2. Methods for 2’-FL production
There are several methods for 2’-FL production industrially, chemical synthesis, enzymatic synthesis and whole cell synthesis. First, the chemical synthesis has been carried out for a long time (Gokhale, Hindsgaul et al. 1990, Kameyama, Ishida et al. 1991, Kretzschmar and Stahl 1998), however, this method is uneconomical and consumes much time. In addition, it requires multiple protection and deprotection steps (Gokhale, Hindsgaul et al. 1990, Kameyama, Ishida et al. 1991, Kretzschmar and Stahl 1998). These problems are major drawbacks of this method for industrial applications.
The second method for 2’-FL production is enzymatic synthesis (Albermann, Piepersberg et al. 2001). This method may be more efficient due to the high stereoselectivity of an enzyme, α-1, 2-fucosyltransferase. Furthermore, by-products are hardly produced. However, the guanosine 5’-diphospho-β-L-fucose (GDP-L-fucose) used
as a fucose donor is very expensive, and the cost of enzyme purification and cofactor involved in 2’-FL synthesis are very high. These make large-scale production difficult.
The last method is whole-cell synthesis, using microorganisms. It does not require enzyme isolation. Also, there is no need to prepare expensive substrates, GDP-L-fucose and the cofactors involved in GDP-L-fucose
biosynthesis such as nicotinamide dinucleotide phosphate (NADPH) and guanosine triphosphate (GTP) (Lee, Pathanibul et al. 2012). Therefore, this method is considered to be an appropriate strategy for large-scale 2’-FL production. In this thesis, 2’-FL was produced by using this method, microbial fermentation.
11
3.3. Biosynthesis of GDP-L-fucose
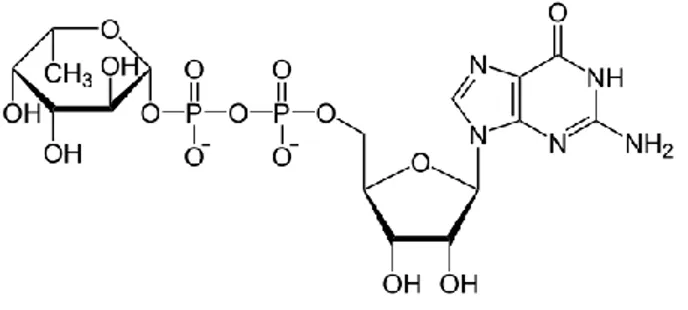
In order to produce 2’-FL, GDP-L-fucose, the activated sugar
nucleotide, is a key material used as a fucose donor (Fig. 3). There are two different metabolic pathways for biosynthesis of GDP-L-fucose; the
salvage pathway and de novo pathway. For the salvage pathway, L-fucose kinase (EC 2.7.1.52) phosphorylates L-L-fucose by consuming ATP. Then, L-fucose-1-phosphate guanylyltransferase (EC 2.7.7.30) synthesizes GDP-L-fucose by combining L-fucose-2-phosphate with
GTP (Becker and Lowe 2003).
For the de novo pathway, GDP-L-fucose is synthesized as shown in Fig.
4. Fructose-6-phosphate, an intermediate of glycolysis, is converted to mannose-1-phosphate by mannose-6-phosphate isomerase (ManA, E.C. 5.3.1.8) and phosphomannomutase (ManB, E.C. 5.4.2.8), and then mannose-1-phosphate is combined with GTP by mannose-1-phosphate guanyltransferase (ManC, E.C. 2.7.7.22) to form GDP-D-mannose.
GDP-D-mannose is converted to GDP-L-fucose by two enzymes, GDP-D-mannose-4,6-dehydratase (Gmd, E.C. 4.2.1.27) and
GDP-4-keto-6-deoxymannose 3,5-epimerase 4-reductase (WcaG, EC 1.1.1.271). First, a water molecule is removed GDP-D-mannose by Gmd. Next, WcaG
catalyzes the reduction reaction of the keto group at the C4 position of
GDP-4-keto-6-deoxymannose to synthesize GDP-L-fucose. This
reaction requires NADPH as a cofactor offering reducing power (Albermann, Distler et al. 2000, Becker and Lowe 2003, Jang, Lee et al. 2010).
Although GDP-L-fucose is synthesized more simply through the
-12
fucose is very high. So, it is uneconomically for large-scale production of 2’-FL by the salvage pathway. In contrast, the de novo pathway consists of multiple steps, but the starting material is economically appropriate. In the previous research, the de novo pathway was constructed in Corynebacterium glutamicum (Fig. 4) (Chin, Park et al. 2013).
Figure 3. Structure of guanosine 5’- diphospho-β-L-fucose
13 Figure 4. De novo biosynthetic pathway of GDP-L-fucose.
ManA, mannose-6-phosphate isomerase; ManB, phosphomannomutase; ManC, GTP-mannose-1-phosphate guanylyltransferase; Gmd, GDP-D-mannose-4,6-dehydratase; WcaG,
14
3.4. Fucosyltransferse
2’-FL is synthesized by fucosylation of lactose by α-1, 2-fucosyltransferase. This enzyme catalyzes the transfer of fucose from GDP-L-fucose to the galactose of lactose.
Fucosyltransferase is an enzyme group that transfers L-fucose of
GDP-L-fucose to various oligosaccharide acceptors (Breton, Oriol et al. 1998).
Fucosyltransferase is a type of glycosyltransferases because α-fucosylated products are formed from a β-α-fucosylated sugar nucleotide, GDP-L-fucose (Zhang, Lau et al. 2010). Based on the types of acceptors
and the regional specificity of the fucosides formed by the reaction of fucosyltransferase, fucosyltransferases are classified as α-1, 2-, α-1, 3 and/or α-1, 4-, α-1, 6- and O-fucosyltrnasferases (Ma, Simala-Grant et al. 2006).
Among them, α-1, 2-fucosyltransferases are found in eukaryotes and prokaryotes. Fucosyltransferase is thought to be involved in tissue development, angiogenesis, fertilization, cell adhesion, inflammation and tumor metastasis in eukaryotes (Ma, Simala-Grant et al. 2006, Miyoshi 2008). In prokaryotes, fucosyltransferase are associated with the synthesis of lipopolysaccharides (LPS) and exopolysaccharides (EPS) which are involved in molecular mimicry, adhesion, colonization and modulation of host immune responses (Ma, Simala-Grant et al. 2006).
α-1, 2-fucosyltransferases is a key enzyme in 2’-FL production. As mentioned above, it is involved in the last transition reaction for 2’-FL synthesis that is transferring the fucose of GDP-L-fucose to the
2’-15
FL, α-1, 2-fucosyltransferase from Helicobacter pylori has been mainly used (Albermann, Piepersberg et al. 2001, Drouillard, Driguez et al. 2006, Lee, Pathanibul et al. 2012, Baumgärtner, Seitz et al. 2013). In the previous research, α-1, 2-fucosyltransferase from H. pylori was introduced into C. glutamicum for 2’-FL production (Jo, Thesis. 2016).
16
4. Corynebacterium glutamicum
4.1. Characterization of Corynebacterium glutamicum
In the middle of 1950s, a bacterium was isolated which accumulate L-glutamic acid extracellularly. Originally, this bacterium was named
Micrococcus glutamicus (KINOSHITA, UDAKA et al. 1957). In 2000,
it was renamed as Corynebacterium glutamicum according to the taxonomy (Kumagai 2000). Since discovered several decades ago, C.
glutamicum has played a key role in producing amino acids and
nucleotides in an industrial scale. Amino acids such as valine, L-histidine, L-phenylalanine, L-tryptophan, L-glutamate and L-lysine (Ikeda 2003) and nucleotides such as 5’-inosinic acid (IMP), 5’- guanylic acid (GMP), 5’-xanthylic acid (XMP) and others have been produced in an industrial scale or have been attempted to produce.
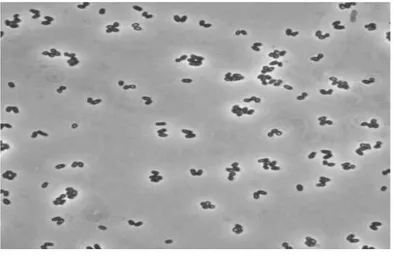
C. glutamicum is an aerobic or facultative anaerobic, Gram-positive,
non-spore forming bacterium. Commonly it has a rod-shape, somewhat irregular (“coryneform”) morphology (Fig .5) (Eggeling and Bott 2005). At first, many random mutations and screening tests were required to make superior strains. These methods are time-consuming and do not give the reason for improvement. Recently, many genetic engineering tools have been developed for C. glutamicum. In the 1980s, host-vector systems for coryneform bacteria were developed to allow the development of strains in a more rational manner (Katsumata, Ozaki et al. 1984, SANTAMARiA, GIL et al. 1984, Kiyoshi, Kazuhiko et al. 1985, Yoshihama, Higashiro et al. 1985). In the 1990s, various tools for genetic engineering of the coryneform bacteria were developed (Haynes and Britz 1989, Schäfer, Kalinowski et al. 1990, Schwarzer and Pühler
17
1991, Ikeda and Katsumata 1998). Furthermore, the complete genome of C. glutamicum ATCC 13032 has been determined by two independent research teams: the Japanese Kyowa Hakko Co. & Kitasato Univ. team and German Degussa Co. & Bielefeld Univ. team identified 3,309,401 and 3,282,708 base pairs.
4.2. C. glutamicum as a 2’-FL producer
C. glutamicum has a high NADPH regeneration capacity. The ratio of
carbon flux into the pentose phosphate pathway (PPP) is higher in C.
glutamicum than other microorganisms when glucose is used as a sole
carbon source (Marx, de Graaf et al. 1996, Eggeling and Bott 2005). A wild-type stain C. glutamicum ATCC 13032 has a large NADPH potential of over 80% during growth. That is the key feature for efficient amino acid production in mutants derived from this parent strain for decades (Eggeling and Bott 2005). Moreover, the carbon flux ratio to the PPP is significantly increased by the increased cell requirement of NADPH. C. glutamicum is also used for the fermentative production of nucleotides of interest as a flavor enhancing additive for foods (Komata 1976). Actually, mutant strains of C.
glutamicum which secrete IMP, XMP and GMP were developed
(Aharonowitz and Demain 1978). Above all, C. glutamicum is classified as a ‘Generally Recognized As Safe’ (GRAS) microorganism. Therefore, it is believed that C. glutamicum has sufficient potential to be an ideal host not only for production of amino acids or nucleotides, but also for the production of food additives or therapeutic materials
18 such as 2’-FL.
As mentioned above, in order to produce 2’-FL in microbial cells, GDP-L-fucose and lactose are required. However, wild-type C.
glutamicum does not have the GDP-L-fucose biosynthetic pathway, so
it cannot synthesize GDP-L-fucose. Thus, in the previous researches,
the strain capable of biosynthesizing GDP-L-fucose was developed
(Chin, Park et al. 2013). Also, wild-type C. glutamicum cannot metabolize lactose, so there is no lactose permease. However, in order to produce 2’-FL, it is necessary to import lactose into the cell, and therefore the lactose permease gene from Escherichia coli K-12 was introduced as the lacYA operon in which the β-galactosidase gene, lacZ was removed (Chin, Seo et al. 2016). Additionally, the codon-optimized α-1, 2-fucosyltransferase gene (COfucT2) for C. glutamicum was introduced for fucosylation (Fig. 6) (Jo, Thesis. 2016).
19 (A)
(B)
Figure 5. Corynebacterium glutamicum. (A) Phase-contrast micrograph of C. glutamicum cells grown on complex medium. Note frequent V-type arrangement of cell pairs, due to “snapping division.” (B) Same cells placed on a nucleopore membrane and viewed by scanning electron microscopy (Eggeling and Bott 2005).
20
21
5. Research objectives
This thesis was focused on the enhancement of 2’-FL production in engineered C. glutamicum by improving the strain in a metabolic engineering way. The specific objectives of this research were described as follows.
(1) To introduce the 2’-FL exporter from Bifidobacterium infantis to C.
glutamicum for improved secretion of intracellular 2’-FL.
(2) To optimize biosynthetic pathway of GDP-L-fucose by modulating
glycolysis.
(3) To mass-produce 2’-FL in engineered C. glutamicum by carrying out fed-batch fermentation.
22
Ⅱ. MATERIALS AND METHODS
1. Reagents and Enzymes
All experiments were carried out using chemicals of reagent grade. Lactose, ethidium bromide, isoniazid, protocatechuic acid, biotin, cupric sulfate, sulfuric acid and antifoam 204 were purchased from Sigma-Aldrich Chemical Company (St. Louis, MO, USA). Glucose, ammonium sulfate, urea, potassium phosphate monobasic, potassium phosphate dibasic, magnesium sulfate heptahydrate, ferrous sulfate, sodium chloride, sodium hydroxide, ammonia water and hydrochloric acid were purchased from Duksan (Ansan, Korea). Kanamycin monosulfate, IPTG and MOPS were purchased from Duchefa (Haarlem, The Netherlands). Fructose, calcium chloride, zinc sulfate, manganese(II) sulfate and Nickel(II) chloride were purchased from Junsei Chemical (Tokyo, Japan). Brain heart infusion, bacto-tryptone, yeast extract and bacto-agar were purchased from Difco (Detroit, MI., USA).
Restriction enzymes and calf intestinal alkaline phosphatase (CIP) were purchased from New England Biolabs (Beverly, MA, USA). T4 ligation mix and In-Fusion® HD cloning kit were purchased from Takara (Otsu, Japan).
2. Strains and Plasmids
2.1. Strains
E. coli Top10 (Invitrogen, Carlsbad, CA, USA) was used for construction of plasmid DNA. C. glutamicum ATCC 13032 (KACC,
23
Suwon, Korea) was used as host strain for 2’-FL production. To construct the phosphofructokinase A gene (pfkA) knock-out strain (△P), the 348 bp within pfkA was deleted by a double crossover method using a pK19mobsacB vector (Schäfer, Tauch et al. 1994).
The wild type and recombinant strains were incubated on Brain-heart infusion (BHI, Difco) containing appropriate antibiotics and stocked in a deep freezer at -80°C suspended in 15% glycerol.
2.2. Plasmids
Plasmids pVWEx2 and pEKEx2 were donated kindly by Prof. J. B. Park at Ewha Womans University. They were used as the backbone vectors for the expression of heterologous genes or overexpression of innate genes.
Plasmid pVBCLE harbors the lacYA operon from E. coli and the manB,
manC genes from C. glutamicum and the blon_2204-2203 cluster from Bifidobacterium infantis under the tac promoter. Plasmid pEGWTT(CO) was previously constructed. It harbors the gmd-wcaG gene from E. coli under tac promoter and the codon-optimized α-1,2-fucosyltransferase gene (COfucT2) from H. pylori under tac promoter. COfucT2 is transcribed monocistronically by addition of the tac promoter (Jo, Thesis. 2016).
Plasmid pK19mobsacB was donated kindly by Prof. K. J. Jeong at Korea Advanced Institute of Science and Technology (KAIST). It was used as a vector for gene knock-out on the chromosome.
Plasmid pK19-△pfkA was constructed to disrupt pfkA on chromosome. It carries 311 bp from the start codon of pfkA and 382 bp from the
24 middle of pfkA to the stop codon.
Plasmids pVmBC and pEGW were previously constructed for overexpression of the genes for GDP-L-fucose biosynthesis (Chin, Park
et al. 2013). All constructs were confirmed by restriction enzyme digestion and DNA sequencing.
25 Table 3. List of strains and plasmids used in this study
Strains/Plasmids Relevant description Reference Strains
E. coli TOP10
F-, mcrA ∆(mrr-hsdRMS-mcrBC) φ80lacZ∆M15 ∆lacX74
recA1 araD139 ∆(ara-leu)7697 galU galK rpsL (StrR) endA1
nupG
Invitrogen (Carlsbad, CA, USA)
C. glutamicum Wild-type strain, ATCC 13032 (ABE, TAKAYAMA et al. 1967)
BCGW TTL(CO) C. glutamicum ATCC 13032 harboring pVBCL and
pEGWTT(CO) (Jo, Thesis. 2016)
BCGW TTLE(CO) C. glutamicum ATCC 13032 harboring pVBCLE and
pEGWTT(CO) This study
△P C. glutamicum ATCC 13032 △pfkA This study
△P BCGW TTL(CO) C. glutamicum ATCC 13032 △pfkA harboring pVBCL and
pEGWTT(CO) This study
△P BCGW TTLE(CO) C. glutamicum ATCC 13032 △pfkA harboring pVBCLE and
pEGWTT(CO) This study
Plasmids
pEKEx2
KmR; C. glutamicum/E. coli shuttle vector for regulated
gene expression (Ptac, lacIq, pBL1, oriVC.g., oriVE.c.) (Eikmanns, Kleinertz et al. 1991) pVWEx2
TcR; C. glutamicum/E. coli shuttle vector for regulated
gene expression (Ptac, lacIq, pHM1519, oriVC.g., oriVE.c.) (Wendisch and Jülich 1997) pK19mobsacB Mobilizable vector, KmR
26
pVmBC pVWEx2 + manB + manC (Chin, Park et al. 2013)
pEGW pEKEx2 + gmd-wcaG (Chin, Park et al. 2013)
pVBCL pVmBC + lacYA (Jo, Thesis. 2016)
pVBCLE pVBCL + blon_2204-2203 This study
pEGWTT(CO) pEGWT(CO) + tac promoter (before COfucT2) (Jo, Thesis. 2016) pK19-△pfkA pK19mobsacB + (311 bp from the start codon of pfkA – 382 bp from the middle of pfkA to stop codon) This study
27 Table 4. List of primers used in this study
Name Sequence
F_inf_SpeI_RBS_Exp TCGTCTGATCAGTAG ACTAGT AAGGAGATATACA ATGACAAATGCAACGGCGC R_inf_SpeI_Exp CGGGGATCCGG ACTAGT TCACTGCTTGACAGAGCCG
F1_Exp_seq CGGTGTGAACTCAACGCAG
F2_Exp_seq ATTCTGCACTGATCGGCATTC
R_Exp_seq TCATCCGCCAAAACAGCC
F1_BamHI_pfkA_dis CGGGATCC ATGGAAGACATGCGAATTGCTACT
R1_pfkA_dis.ovl CCGCAACGACGATAATG ATTGGGATAAGGGCATCGATGC F2_pfkA_dis.ovl GATGCCCTTATCCCAAT CATTATCGTCGTTGCGGAAGG R2_EcoRI_pfkA_dis CGGAATTC CTATCCAAACATTGCCTGGGC
The italic sequences present the RBS (ribosome binding site) and spacer. The bold sequences present the recognition sites of specific restriction enzymes.
28
29
30
3. DNA Manipulation and Transformation
3.1. Preparation of DNA
Mini-scale preparation of plasmid DNA was carried out by using DNA-spin™ Plasmid DNA Purification Kit from iNtRON (Sungnam, Korea). Preparation of C. glutamicum and B. infantis chromosomal DNAs for PCR template was carried out by using DNeasy Blood & Tissue Kit from QIAGEN (Düsseldorf, Germany). As C. glutamicum and B. infantis are Gram-positive bacteria, buffer for enzymatic lysis composed of 20 mM Tris·HCl (pH 8.0), 2 mM EDTA, 1.2% Triton X-100, 20 mg/mL lysozyme was used. PCR amplified or enzyme treated DNA was purified by using respectively the QIAquick® Gel Extraction / PCR purification Kit from QIAGEN (Düsseldorf, Germany).
3.2. Polymerase Chain Reaction (PCR)
PCRs were performed with an Applied Biosystems Veriti 96 well Thermal Cycler (Lincoln, CA, USA). PCRs for cloning of genes were performed in 50 μL of PrimeStar™ dyemix solution from Takara (Otsu, Japan) containing 20 pM each of forward and reverse primers (Table 4), and 1 μL of the genomic DNA which is a template of cloning. After heating the reaction tubes for 5 min at 95℃, 30 cycles of PCR amplification were performed as follows: 10 sec at 98℃, 5 sec at 55℃ and 1 min per 1 kb DNA at 72℃, followed by 7 min at 72℃ during the last cycle.
3.3. Digestion and ligation of DNA
31
alkaline phosphatase (CIP) were purchased from New England Biolabs (Beverly, USA). Plasmid pVBCL was digested with SpeI. Plasmid pK19mobsacB was digested with BamHI and EcoRI. The Ligation Mix and In-Fusion® HD cloning kit obtained from Takara (Otsu, Japan) were used for ligation of PCR products and plasmids.
3.4. Transformation of E. coli
Transformation of E. coli was carried out as described by Sambrook (Sambrook and Russell, 1989). E. coli Top10 was cultured in 5 mL LB medium (1% tryptone, 0.5% yeast extract, 1% NaCl) for 12 hours. 0.5 mL of the culture was transferred to fresh 50 mL LB medium and cultured until OD600 reached 0.5. Cells harvested by centrifugation at
6,000 rpm for 5 min at 4°C were resuspended in 5 mL of cold 100 mM CaCl2 solution containing 15% (v/v) glycerol. Resuspended cells were
aliquoted to 100 μL, mixed with DNA, and kept on ice for 30 min. They were subjected to heat-shock at 42°C for 45 sec, and 1 mL of LB medium was added to the test tubes and incubated at 37°C for 1 hour to allow the bacteria to express the antibiotic resistance. Transformed cells were spread on LB agar plates with an appropriate concentration of antibiotics, kanamycin or tetracycline.
3.5. Electroporation of C. glutamicum
The modified protocol for preparation of electrocompetent C.
glutamicum referred to Handbook of Corynebacterium glutamicum and
van der Rest et al. (van der Rest, Lange et al. 1999, Eggeling and Bott 2005). Briefly, incubated at 30°C, overnight cultures of C. glutamicum
32
was inoculated in 100 mL BHIS (37 g/L BHI, 91 g/L sorbitol) medium in a 500 mL baffled flask containing isoniazid, glycine and tween80. Then, incubated at 30°C, 250 rpm cultured until OD600 reached 1.75.
The culture dispensed into 50 mL falcon tubes and harvested by centrifugation at 3,000 rpm for 20 min. After removing the supernatant, cell pellet was resuspended with 20 mL TG buffer (1 mM Tris·HCl (pH 7.5), 104.4 g/L glycerol) and centrifuged again. After repeating this step, cell pellet was resuspended with 20 mL of 10% (v/v) glycerol as done before. Finally the cells were resuspended in 1 mL 10% (v/v) glycerol and dispensed 150 μL aliquots in cooled Eppendorf tubes and stored at -70°C. 10 μL of plasmid DNA was added into an electrocompetent cell and transferred the mixture into a pre-chilled electroporation cuvette (Bio-Rad, Hercules, CA, USA) with a gap width of 2 mm. The electroporation is performed at 2,500 V, 25 μF and 200 Ω in MicroPulser™ Electroporation apparatus (Bio-Rad, Hercules, CA, USA). After the electric shock, the transformant was transferred immediately into 1 mL BHIS medium pre-warmed at 46°C and incubated for 6 min at 46°C without shaking to carry out the heat-shock process. Then, the transformant was incubated for 1 hour at 30°C, 250rpm for regeneration of cells. An appropriate volume of the transformants were spread on a BHIS agar plate containing appropriate antibiotics and incubated the plates at 30°C for 2 days.
33
4. Gene disruption progress
4.1. Construction of gene disruption vector
To construct the pfkA knock-out vector pK19-△pfkA, 311 bp from the start codon of pfkA (called F region) and 382 bp from the middle of
pfkA to the stop codon (called R region) were respectively amplified
with primer pairs, F1_BamHI_pfkA_dis and R1_pfkA_dis.ovl / F2_pfkA_dis.ovl and R2_EcoRI_pfkA_dis (Table 4). The PCR products were used as the templates for overlapping PCR and the second PCR was carried out by using primers, F1_BamHI_pfkA_dis and R2_EcoRI_pfkA_dis. The obtained PCR products were digested with
BamHI and EcoRI, and plasmid pK19mobsacB was also digested with
the same restriction enzymes. Then, the PCR products were cloned into pK19mobsacB to construct pK19-△pfkA.
4.2. Screening of gene disrupted strain
Disruption of pfkA was carried out by the double crossover method (Schäfer, Tauch et al. 1994). To disrupt pfkA, plasmid pK19-△pfkA was introduced into C. glutamicum by electroporation and the transformants spread on a BHIS agar plate with 25 μg/mL kanamycin were incubated for 2-3 days at 30℃. The cells formed colonies in Km medium had Km-resistance, and thus they were the plasmid-integrated clones. Then, the Km-resistant cells were cultured in LB medium overnight, and they were properly diluted and spread on a 10% (w/v) sucrose LBG (LB, 0.5% sodium acetate, 5 g/L glucose) agar plate to pop out the integrated plasmid. After incubation for about 2 days, the cells formed colonies in sucrose medium were found, and they did not have sacB. Thus, they
34
were the cells without the integrated plasmid. With the isolated clones, the desired pfkA disruption was checked by colony PCR with the primer pairs, F1_BamHI_pfkA_dis and R2_EcoRI_pfkA_dis.
35
5. Media and Culture conditions
5.1. Media
Luria-Bertani (LB) medium (1% tryptone, 0.5% yeast extract, 1% NaCl) containing appropriate antibiotics (50 μg/mL kanamycin, 15 μg/mL tetracycline) was used for cultivation of E. coli strains. Brain heart infusion (BHI) (Difco, USA) containing with appropriate antibiotics (25 μg/mL kanamycin, 5 μg/mL tetracycline) was used for incubation of C. glutamicum.
The minimal medium used for C. glutamicum was CGXII, consisting of (per liter) 20 g of (NH4)2SO4, 5 g of urea, 1 g of KH2PO4, 1 g of
K2HPO4, 0.25 g of MgSO4·7H2O, 42 g of 3-morpholinopropanesulfo
nic acid, 10 mg of CaCl2, 10 mg of FeSO4·7H2O, 10 mg of MnSO4
·H2O,1 mg of ZnSO4·7H2O, 0.2 mg of CuSO4, 0.02 mg of
NiCl2·6H2O, 0.2 mg of biotin (pH 7.0), and 0.03 mg of protocatechuic
acid (Eggeling and Bott 2005).
5.2. Culture conditions
For the inoculation of recombinant C. glutamicum, a frozen stock was transferred to a test-tube containing 5 mL of BHI medium and incubated overnight at 30°C and 250 rpm in a shaking incubator (Vision, Korea). For recombinant C. glutamicum containing a single vector (pEKEx2 derived plasmid) 25 μg/mL kanamycin was added and for the dual vector system (pEKEx2 and pVWEx2 derived plasmids) 25 μg/mL kanamycin and 5 μg/mL tetracycline were added.
For the flask fermentation, 1 mL of cell culture broth grown overnight was inoculated in a 500 mL baffled flask (NALGENE, USA) with 100
36
mL CGXII (4% glucose, or in case of △pfkA strain, 1.2% glucose and 2.8% fructose mixture or 4% fructose) media and grown at 30°C and 250 rpm. The appropriate antibiotics were supplemented. As an optical density reached OD600 of 0.8, isopropyl-β-D-l-thiogalactopyranoside
(IPTG) was added to a final concentration 1.0 mM for induction of gene expression, and also lactose was added to a final concentration 10 g/L for 2’-FL production.
Fed-batch fermentation was performed in a bioreactor of 2.5 L (Kobiotech, Korea) with 1 L initial working volume of CGXII medium containing 4% glucose and antibiotics of the same concentration as flask culture. In case of △pfkA strain, CGXII medium containing 1.2% glucose and 2.8% fructose mixture or 4% fructose was used. The 100 mL pre-culture was prepared with in a 500 mL baffled flask with 100 mL BHI. In case of △pfkA strain, the pre-culture was prepared with the same method with flask fermentation. And then, the culture solution was transferred to the bioreactor, giving an initial OD600 of
approximately 1 or 2 (△pfkA strain). Aeration rate and agitation speed were in between 2 ~ 2.5 vvm of air supply and 1,000 rpm, respectively. The pH was automatically controlled at 7.0 by addition of 28% ammonia water and 2N HCl. To keep the cell growth and a basal level of carbon source after depletion of 4% sugar initially added, feeding solution was fed at a continuous feeding rate of 5.7 g/L/h on average. The feeding solution was composed of 800 g/L glucose, or in case of △pfkA strain, 240 g/L glucose and 560 g/L fructose or 800 g/L fructose. When the initial carbon source was consumed completely, 1.0 mM IPTG was added for induction of the gene expression regulated by the
37
tac promoter. Also, 20 g/L lactose was added as an acceptor for α-1,2-fucosyltransferase. Especially, in case of the optimized fed-batch fermentation of △pfkA strain, when the pre-culture broth was inoculated into the bioreactor containing CGXII medium with 4% fructose, 1 mM IPTG, 20 g/L lactose and 20 g/L glucose were simultaneously added. To keep the cell growth and to produce 2’-FL, 800 g/L fructose feeding solution was fed at a continuous feeding rate of 2.8 g/L/h on average and glucose was added intermittently to maintain concentrations of 10-20 g/L.
38
6. Fermentation analysis
6.1. Dry cell weight
Cell growth was monitored by measuring the optical density of culture broth. Absorbance at 600 nm was measured using a spectrophotometer (OPTIZEN POP, MECASYS, Korea) after culture broth samples were properly diluted to keep optical density between 0.1 and 0.5. Optical density was converted to dry cell weight by using the following conversion equation:
Dry cell mass (g/L) = 0.30 x OD600
6.2. Quantification of metabolites concentrations
Concentrations of glucose, fructose, lactose, lactate and 2’-FL were measured by a high performance liquid chromatography (1200 series, Agilent, Santa Clara, CA, USA) with a Rezex ROA-organic acid H+ Column (Phenomenex, USA) heated at 60°C. A mobile phase of 5 mM H2SO4 was used at a flow rate of 0.6 mL/min. Detection was made with
a reflective index detector.
6.3. Measurement of the amount of intracellular 2’-FL
In case of flask fermentation, 1% triton X-100 was added to the culture broth after fermentation to measure the amount of intracellular 2’-FL. Then, the cells were cultured overnight and the supernatant of the culture broth was taken to measure the total amount of 2’-FL. The amount of intracellular 2’-FL was quantified by the difference between
39
the total amount of 2’-FL and the amount of extracellular 2’-FL. For fed-batch fermentation, 0.5 mL of the culture broth was taken to measure the amount of intracellular 2’-FL. After centrifugation at 13,200 rpm for 10 min, the supernatant was removed and the cell pellet was resuspended with 0.5 mL of DDW. Then, in order to break the cells, it was boiled in boiling water for 5 min. To quantify the amount of intracellular 2’-FL, the supernatant after centrifugation and filtration was taken.
40
III. RESULTS AND DISCUSSIONS
1. Introduction of 2’-FL exporter from Bifidobacterium
infantis
1.1. Construction of the strain expressing 2’-FL exporter
To produce 2’-FL in engineered C. glutamicum, the strain capable of biosynthesizing GDP-L-fucose was constructed (Chin, Park et al. 2013).
Next, plasmids pVBCL and pEGWTT(CO) were constructed for expression of the lactose permease gene from E. coli and α-1,2-fucosyltransferase gene from H. pylori. The strain BCGW TTL(CO) harboring plasmids pVBCL and pEGWTT(CO) was constructed for 2’-FL production from glucose and lactose. This strain produced 0.547 g/L of 2’-FL in flask fermentation (Jo, Thesis. 2016). The 2’-FL detected in the supernatant of culture broth was secreted from cells into the medium, and the amount of intracellular 2’-FL was thought to be considerably high. Therefore, to enhance the production of 2’-FL by secreting the intracellular 2’-FL, the 2’-FL exporter was explored.
Bifidobacteria can utilize fucosyllactoses (FLs) in a selfish manner. In other words, Bifidobacteria can utilize FLs by importing them into a cell. This physiological characteristic of Bifidobacteria is because they have a common FL-utilization gene cluster. The gene cluster is composed of the two ABC transporter permease genes, ABC transporter substrate-binding protein (SBP) gene and fucosidase gene (Fig. 9) (Matsuki, Yahagi et al. 2016). The ABC transporter permeases have transmembrane domain, so ABC transporter permeases are thought to be a 2’-FL transporter. Since 2’-FL was continuously
41
produced in the cell, it seems that 2’-FL might be exported through the ABC transporter permeases more smoothly by facilitated diffusion.
To introduce the ABC transporter permeases to C. glutamicum, the
blon_2204-2203 cluster from B. infantis able to utilize FLs in a selfish
manner was chosen. The blon_2204-2203 cluster from B. infantis genomic DNA was amplified with primer pairs, F_inf_SpeI_RBS_Exp and R_inf_SpeI_Exp (Table 4). The amplified blon_2204-2203 cluster was digested with SpeI and ligated into plasmid pVBCL. The constructed plasmid pVBCLE was identified by the restriction enzyme (SpeI) digestion and DNA sequencing (SolGent, Daejeon, Korea). To construct the 2’-FL production strain, C. glutamicum ATCC 13032 was transformed with plasmids pVBCLE and pEGWTT(CO) by electroporation. The transformants were isolated on the BHIS agar plate containing kanamycin and tetracycline and identified by colony PCR.
42
Figure 9. FL utilization in bifidobacteria. (A) Identification of bifidobacterial genes responsible for HMO utilization. (B) Molecular mechanisms of FL utilization by bifidobacteria (Matsuki, Yahagi et al. 2016).
43
1.2. Flask fermentation of the strain expressing 2’-FL exporter
As mentioned above, for production of 2’-FL in engineered C.
glutamicum, the strain BCGW TTLE(CO) harboring plasmids
pVBCLE and pEGWTT(CO) was constructed. In order to compare the fermentation ability of BCGW TTL(CO): harboring plasmids pVBCL and pEGWTT(CO) and BCGW TTLE(CO), flask fermentation was performed in CGXII medium containing 40 g/L glucose. As an optical density reached OD600 of 0.8, IPTG was added to a final concentration
1.0 mM for induction of gene expression, and also lactose was added to a final concentration 1, 2, 5 and 10 g/L respectively for 2’-FL production. During 72 hours of fermentation, BCGW TTL(CO) produced 2’-FL of 0.46 g/L, 0.58 g/L, 0.6 g/L and 0.6 g/L under the respective lactose concentration (Fig. 10, Table 5). In comparison, during the same time, BCGW TTLE(CO) produced 2’-FL of 0.51 g/L, 0.56 g/L, 0.66 g/L and 0.83 g/L under the respective lactose concentration (Fig. 11, Table 5). Overall, BCGW TTLE(CO) produced more 2’-FL. Especially, under the 10 g/L lactose condition, 2’-FL titer was higher by 38% than that of BCGW TTL(CO). As the amount of extracellular 2’-FL was increased, it seems that the introduced ABC transporter permeases from B. infantis work as a 2’-FL exporter. Indeed, if the ABC transporter permeases worked as s 2’-FL exporter, the amount of intracellular 2’-FL in BCGW TTLE(CO) would decrease.
In order to measure the amount of intracellular 2’-FL, cells needed to be broken. To break the cells, 1% triton X-100 was added to the culture broth after fermentation. The cells were cultured overnight and the total
44
2’-FL was obtained from the supernatant. The amount of intracellular 2’-FL was estimated by the difference between total 2’-FL and extracellular 2’-FL. The estimated amount of intracellular 2’-FL was the same as that measured by breaking cells by boiling as described above (data not shown).
The amount of intracellular 2’-FL produced in BCGW TTL(CO) and BCGW TTLE(CO) was measured. As a result, the amount of intracellular 2’-FL decreased in BCGW TTLE(CO) compared to BCGW TTL(CO) for all fermentations performed under the various lactose conditions. Conversely, the amount of extracellular 2’-FL increased in BCGW TTLE(CO) compared to BCGW TTL(CO) in all fermentations (Fig. 12). The total amount of 2'-FL was similar in both strains or higher in BCGW TTL(CO) than in BCGW TTLE(CO). The experiments results suggested that expression of 2’-FL exporter from
B. infantis did not affect 2’-FL production capacity of cells, but
enhanced the secretion of the intracellular 2’-FL and enhanced the amount of extracellular 2’-FL. The expression of 2’-FL exporter can be helpful to collect the produced 2’-FL.
45
Figure 10. Flask fermentation of BCGW TTL(CO). (A) 1 g/L lactose (B) 2 g/L 1actose (C) 5 g/L lactose (D) 10 g/L lactose. As OD600
reached 0.8, IPTG and lactose were added (thick arrow).
47
Figure 11. Flask fermentation of BCGW TTLE(CO). (A) 1 g/L lactose (B) 2 g/L 1actose (C) 5 g/L lactose (D) 10 g/L lactose. As OD600
reached 0.8, IPTG and lactose were added (thick arrow).
49
Table 5. Summary of flask fermentation under 10 g/L lactose of BCGW TTL(CO) and BCGW TTLE(CO)
*2’-FL yield and productivity were calculated based on total fermentation time.
Strains Maximum dry cell weight (g/L) Maximum 2’-FL concentration (g/L) *Yield
(mole 2'-FL/mole lactose)
*Productivity (mg/L/h) BCGW TTL(CO) 13.1 0.60 0.76 8.33 BCGW TTLE(CO) 13.1 0.83 0.98 11.5
50
Figure 12. Intracellular 2’-FL of (A) BCGW TTL(CO) and (B) BCGW TTLE(CO) Colors: Brown (first bar), Extracellular 2’-FL; Orange (second bar), Intracellular 2’-FL; Yellow green (third bar), Total 2’-FL, Blue dot, g intracellular 2’-FL / g DCW (%)
51
1.3. Measurement of 2’-FL secretion ability
In order to demonstrate the ability of the ABC transporter permeases from B. infantis as 2’-FL exporter, the following experiment was performed additionally. During flask fermentation, at 20 hours after IPTG induction, a culture broth sample corresponding to 0.3 g dry cell weight (DCW) was taken. DCW was estimated as described in MATERIALS AND METHODS. Cells were harvested after centrifugation and resuspended in 10 mL of fresh medium. 2’-FL in the culture medium was measured every 5 min while incubating at 30℃ and 250 rpm. As a result, a larger amount of 2’-FL was detected in BCGW TTLE(CO) than in BCGW TTL(CO) during the same time (Fig. 13). The 2’-FL detected in the culture medium can be regarded as the intracellular 2’-FL originally present in the cells. Due to the difference in intracellular and extracellular concentrations of 2’-FL, the intracellular 2’-FL seems to be secreted out of the cells by facilitated diffusion. The experiment result suggested that the introduction of 2’-FL exporter from B. infantis increased the chance that the intracellular 2’-FL can go out of the cells by providing passages for 2’-FL. The same experiment was performed at 40 hours after IPTG induction, and a larger amount of 2’-FL was also confirmed in BCGW TTLE(CO). Likewise, a larger amount of 2’-FL was detected in BCGW TTLE(CO) than in BCGW TTL(CO).
52
Figure 13. Measurement of 2’-FL secretion ability of BCGW TTL(CO) and BCGW TTLE(CO). (A) At 20 hours after IPTG induction (B) At 40 hours after IPTG induction. In case of (B), the sample corresponding to 0.15 g DCW was taken.
54
2. Disruption of phosphofructokinase A gene (pfkA)
2.1. New strategy for 2’-FL production
The current 2'-FL production system in engineered C. glutamicum produces 2’-FL by synthesizing GDP-L-fucose from glucose (Fig. 6).
In this case, the overall metabolic flux is thought to flow into glycolysis, which is related to cell growth rather than to synthesis of GDP-L-fucose
(Becker, Klopprogge et al. 2005). For the synthesis of GDP- L-fucose,
GDP-D-mannose should be synthesized. Fructose 6-phosphate (F6P)
which is a key intermediate of the first main step of glycolysis is converted to fructose 1,6-bisphosphate (F16BP) by the enzyme phosphofructokinase A (PFK-A). If the pfkA is disrupted to block the entry of F6P into glycolysis, the chance of going from F6P to GDP-D
-mannose would increase. However, in this case, since the pathway of glycolysis, which is important for cell growth, is blocked, there would be a problem with cell growth. In order to solve this problem, a strategy of using a mixture of glucose and fructose as a carbon source was established.
First, it is known that C. glutamicum can simultaneously consume glucose and fructose (Dominguez, Cocaign-Bousquet et al. 1997, Wendisch, de Graaf et al. 2000). There is no effect of carbon catabolite repression (CCR). Based on the above facts, a two-track system that utilizes fructose for cell growth through glycolysis and glucose for synthesis of GDP-L-fucose, was developed (Figure 14)
55 Figure 14. New strategy for 2’-FL production.
56
2.2. Construction of pfkA knock-out strain
To disrupt the pfkA (Ncgl1202), 311 bp from the start codon of pfkA (called F region) and 382 bp from the middle of pfkA to the stop codon (called R region) were respectively amplified with primers (Table 4). The F-R fragment was constructed by overlapping PCR using F1_BamHI_pfkA_dis and R2_EcoRI_pfkA_dis (Table 4) and pfkA knock-out vector pk19-ΔpfkA was constructed. When making the F-R fragment to replace pfkA on chromosome, the length of the F-R fragment was set to a multiple of 3 so that the translation ends at the original stop codon of pfkA. The pfkA knock-out strain △P was constructed by a double crossover method (Schäfer, Tauch et al. 1994). Disruption of pfkA was confirmed by colony PCR using the primer pairs F1_BamHI_pfkA_dis and R2_EcoRI_pfkA_dis (Table 4). The complete pfkA represents a length of 1041 bp, but the disrupted pfkA represents a length of 693 bp. The result of pfkA disruption is shown in Figure 15.
The pfkA gene and disrupted pfkA sequences are as follows. Ncgl1202 pfkA (1041 bp) F region, 311 bp / R region 382 bp The F and R region are marked with shading.
ATGGAAGACATGCGAATTGCTACTCTCACGTCAGGCGGCG ACTGCCCCGGACTAAACGCCGTCATCCGAGGAATCGTCCGC ACAGCCAGCAATGAATTTGGCTCCACCGTCGTTGGTTATCAA GACGGTTGGGAAGGACTGTTAGGCGATCGTCGCGTACAGCT GTATGACGATGAAGATATTGACCGAATCCTCCTTCGAGGCGG CACCATTTTGGGCACTGGTCGCCTCCATCCGGACAAGTTTAA
57 GGCCGGAATTGATCAGATTAAGGCCAACTTAGAAGACGCCG GCATCGATGCCCTTATCCCAATCGGTGGCGAAGGAACCCTGA AGGGTGCCAAGTGGCTGTCTGATAACGGTATCCCTGTTGTCG GTGTCCCAAAGACCATTGACAATGACGTGAATGGCACTGAC TTCACCTTCGGTTTCGATACTGCTGTGGCAGTGGCTACCGAC GCTGTTGACCGCCTGCACACCACCGCTGAATCTCACAACCG TGTGATGATCGTGGAGGTCATGGGCCGCCACGTGGGTTGGA TTGCTCTGCACGCAGGTATGGCCGGCGGTGCTCACTACACC GTTATTCCAGAAGTACCTTTCGATATTGCAGAGATCTGCAAG GCGATGGAACGTCGCTTCCAGATGGGCGAGAAGTACGGCAT TATCGTCGTTGCGGAAGGTGCGTTGCCACGCGAAGGCACCA TGGAGCTTCGTGAAGGCCACATTGACCAGTTCGGTCACAAG ACCTTCACGGGAATTGGACAGCAGATCGCTGATGAGATCCA CGTGCGCCTCGGCCACGATGTTCGTACGACCGTTCTTGGCCA CATTCAACGTGGTGGAACCCCAACTGCTTTCGACCGTGTTCT GGCCACTCGTTATGGTGTTCGTGCAGCTCGTGCGTGCCATGA GGGAAGCTTTGACAAGGTTGTTGCTTTGAAGGGTGAGAGCA TTGAGATGATCACCTTTGAAGAAGCAGTCGGAACCTTGAAG GAAGTTCCATTCGAACGCTGGGTTACTGCCCAGGCAATGTTT GGATAG
Disrupted pfkA (F-R fragment, 693 bp: a multiple of 3)
ATGGAAGACATGCGAATTGCTACTCTCACGTCAGGCGGCG ACTGCCCCGGACTAAACGCCGTCATCCGAGGAATCGTCCGC ACAGCCAGCAATGAATTTGGCTCCACCGTCGTTGGTTATCAA GACGGTTGGGAAGGACTGTTAGGCGATCGTCGCGTACAGCT
58 GTATGACGATGAAGATATTGACCGAATCCTCCTTCGAGGCGG CACCATTTTGGGCACTGGTCGCCTCCATCCGGACAAGTTTAA GGCCGGAATTGATCAGATTAAGGCCAACTTAGAAGACGCCG GCATCGATGCCCTTATCCCAATCATTATCGTCGTTGCGGAAG GTGCGTTGCCACGCGAAGGCACCATGGAGCTTCGTGAAGGC CACATTGACCAGTTCGGTCACAAGACCTTCACGGGAATTGG ACAGCAGATCGCTGATGAGATCCACGTGCGCCTCGGCCACG ATGTTCGTACGACCGTTCTTGGCCACATTCAACGTGGTGGAA CCCCAACTGCTTTCGACCGTGTTCTGGCCACTCGTTATGGTG TTCGTGCAGCTCGTGCGTGCCATGAGGGAAGCTTTGACAAG GTTGTTGCTTTGAAGGGTGAGAGCATTGAGATGATCACCTTT GAAGAAGCAGTCGGAACCTTGAAGGAAGTTCCATTCGAAC GCTGGGTTACTGCCCAGGCAATGTTTGGATAG
59
Figure 15. Confirmation of pfkA disruption by colony PCR with primer pairs, F1_BamHI_pfkA_dis and R2_EcoRI_pfkA_dis (Table 4)
A: 1 kb ladder
1, 2, 3, 5: disrupted pfkA 4, 6, 7: wild-type pfkA