저작자표시-비영리-변경금지 2.0 대한민국 이용자는 아래의 조건을 따르는 경우에 한하여 자유롭게 l 이 저작물을 복제, 배포, 전송, 전시, 공연 및 방송할 수 있습니다. 다음과 같은 조건을 따라야 합니다: l 귀하는, 이 저작물의 재이용이나 배포의 경우, 이 저작물에 적용된 이용허락조건 을 명확하게 나타내어야 합니다. l 저작권자로부터 별도의 허가를 받으면 이러한 조건들은 적용되지 않습니다. 저작권법에 따른 이용자의 권리는 위의 내용에 의하여 영향을 받지 않습니다. 이것은 이용허락규약(Legal Code)을 이해하기 쉽게 요약한 것입니다. Disclaimer 저작자표시. 귀하는 원저작자를 표시하여야 합니다. 비영리. 귀하는 이 저작물을 영리 목적으로 이용할 수 없습니다. 변경금지. 귀하는 이 저작물을 개작, 변형 또는 가공할 수 없습니다.
Mathematical model of serum creatinine
kinetics and functional recovery patterns
after kidney transplantation
by
Jun Bae Bang
Major in Medicine
Department of Medical Sciences
The Graduate School, Ajou University
Mathematical model of serum creatinine
kinetics and functional recovery patterns
after kidney transplantation
by
Jun Bae Bang
A Dissertation Submitted to The Graduate School of
Ajou University in Partial Fulfillment of the
Requirements for the Degree of
Master of Medicine
Supervised by
Chang-Kwon Oh, M.D., Ph.D.
Major in Medicine
Department of Medical Sciences
The Graduate School, Ajou University
i
- ABSTRACT -
Mathematical model of serum creatinine kinetics and functional
recovery patterns after kidney transplantation
Background: Commonly used equations calculating estimated glomerulus filtration rate (eGFR) are not applicable when serum creatinine (Scr) is rapidly changing such as the post-transplant period. A new mathematical model applicable to the post-post-transplant period is needed.
Methods: All 623 patients who underwent kidney transplantation from January 2008 to June 2018 at a single institute were included to validate the mathematical equations for Scr, and 14,360 laboratory results for Scr from the time of re-perfusion to 30 days post-transplantation were analysed.
Results: In validation of model equations, linear regression analysis yielded adjusted R squared values for equation 5 (applicable when renal function is changing) and equation 1 (applicable when renal function is unchanged) of 0.972 and 0.925, respectively. In selected cases (the population comprised those who presented an adjusted R squared value > 0.95 with equation 5), a linear regression analysis showed that adjusted R squared values and Pearson's correlation coefficients for equation 5 and equation 1 were 0.994, 0.997 (P < 0.001) and 0.956, 0.978 (P < 0.001), respectively. In comparison between commonly used eGFRs and creatinine clearance by modelled equation, most of the eGFR formulas are mathematically applicable only if the rate of creatinine input equals the rate of creatinine output.
certain time but also assess functional recovery after transplantation. Furthermore, these equations can be used to define and research delayed graft function.
iii
TABLE OF CONTENTS
ABSTRACT ··· ⅰ
TABLE OF CONTENTS ··· iii
LIST OF FIGURES ··· v
I. INTRODUCTION ··· 1
II. METHODS ··· 3
A. STUDY POPULATION ··· 3
B. TRANSPLANTATION AND IMMUNOSUPPRESSION ··· 3
C. MATHEMATICAL MODEL EQUATIONS FOR UNCHANGED RENAL FUNCTION ··· 4
D. MATHEMATICAL MODEL EQUATIONS FOR IMPROVING RENAL FUNCTION ··· 5
E. STATISTICAL ANALYSIS ··· 6
III. RESULTS ··· 7
A. DEMOGRAPHIC CHARACTERISTICS ··· 7
B. VALIDATION OF THE MODEL ··· 7
C. CLASSIFICATION OF THE FUNCTIONAL RECOVERY PATTERN BASED ON EQUATIONS 4 AND 5 ··· 11
D. DISTRIBUTION OF THE PARAMETERS, PRE-TRANSPLANT INJURY, AND 99%RECOVERY TIME ··· 14
E. COMPARISON BETWEEN COMMONLY USED EGFR FORMULAS AND CREATININE CLEARANCE CALCULATED USING THE MODEL ··· 15
IV. DISCUSSION ··· 20
V. CONCLUSION ··· 24
REFERENCES ··· 25
v
LIST OF FIGURES
Fig. 1. Validation of model equations for Scr in total population. ··· 9
Fig. 2.
Classification of the severity of pre-transplant renal injury and recovery time
at post-transplantation.
··· 12Fig. 3. Comparison of eGFRs and modelled CCr for the example case of different types. ··· 17
Fig. 4. Distribution of eGFR-CCr as a function of dy/dt. ··· 18
I.
INTRODUCTION
Creatinine is a breakdown product of creatine phosphate, particularly in muscle, and is usually produced at a fairly constant rate by muscles. This product is freely filtered and excreted into urine by the kidney. In clinical settings, measurements of serum creatinine (Scr) have been most commonly used to evaluate the function of the kidney. The glomerular filtration rate (GFR) is defined as the flow rate of filtered fluid through the kidney, and many equations for the calculating an estimated GFR (eGFR) based on Scr, such as the Modification of Diet in Renal Disease (MDRD), the Chronic Kidney Disease-Epidemiology collaboration (CKD-EPI), Cockcroft–Gault, and Nankivell equations, have been developed (4, 9, 11, 14). However, the measurement of creatinine in serum is prone to different types of error, and the interpretation of renal excretory function based on this measurement can be affected by various sources of interference and is thus imprecise (5). For example, an extremely low or high muscular mass (as observed in cases of malnutrition or obesity and in athletes) makes the interpretation of renal function difficult (2, 6). This association with muscular mass explains why patients (or subjects) of different ages, genders or ethnicity with similar Scr values can have different levels of GFR (3, 15). For this reason, eGFR equations include not only Scr but also age, gender, and ethnicity variables. Another source of creatinine can be a protein-rich diet (16).
During transplant surgery, some degrees of ischemia and re-perfusion injuries to the kidney graft are inevitable. Delayed graft function (DGF) is generally defined as a transient discrepancy between the functional capacity of the transplanted kidney and fulfilment of the physiological needs of the recipient, as manifested by oliguria, lack of a decrease in Scr, or transient dependency on dialysis. Whether DGF, as the principal manifestation of initial
- 2 -
ischemia/reperfusion injury, alone affects the ultimate behaviour of the graft remains under debate (1, 19, 20). During the re-perfusion period after the transplant procedure, the kidney graft should exhibit functional recovery from ischemia/re-perfusion injury. Therefore, the excretory function might change over time after kidney transplantation. The pattern of the changes in renal function after transplantation remains unknown.
Authors of this study attempted to establish new modelled equations based on the fact that the change in the creatinine concentration equals the input subtracted by the output of creatinine and the equations could be more applicable in post-transplant period.
II.
METHODS
A. Study population
From January 2008 to June 2018, 623 cases of kidney allo-transplantation were performed at Ajou University Hospital. No selection procedures were applied. This investigation was a retrospective and observational study. All patients was provided the written informed consent and the need for informed consent was waived by the Institutional Review Board of Ajou University Hospital (IRB Approval No. = AJIRB-MED-MDB-18-367).
B. Transplantation and immunosuppression
The standard surgical techniques of revascularization and urinary tract reconstruction were used for all the transplantations included in this study. To control the blood flow during vascular anastomosis, vascular clamps were placed at the recipient‟s iliac artery and vein. Immediately after anastomosis of the graft renal vein and artery to the recipient‟s iliac vein and artery, the vascular clamps were released to restore blood flow into the kidney graft. The time of re-perfusion is defined as the time at which the vascular clamps were released. The ureter was then implanted in the bladders using extravesical Lich-Gregoir ureteroneocystostomy methods (8, 12). Scr was measured through an automated assay using the cobras 8000 C702 (Roche Diagnostics System, Switzerland).
The immunosuppression regimen consisted of cyclosporine (n = 124, 19.9%) or tacrolimus (n = 499, 80.1%), corticosteroids and enteric coated mycophenolate sodium or mycophenolate mofetil. As a calcineurin inhibitor, cyclosporine or tacrolimus was administered orally at a dose of 10 mg/kg/day or 0.2 mg/kg/day, respectively, starting one or two days before transplantation.
- 4 -
Within a month after transplantation, the dose of the drug was individually adjusted with a goal trough blood level between 200 and 250 ng/mL for cyclosporine or between 5 and 10 ng/mL for tacrolimus. In this study, calcineurin inhibitor nephrotoxicity was clinically defined as reversible graft dysfunction with evidence of a substantially high blood concentration of the drug.
C. Mathematical model equations for unchanged renal function
With respect to the output of creatinine, the creatinine in blood is cleared mostly by the kidney. However, extra-renal clearance, most likely by intestinal bacteria, could be relevant in cases of severe chronic renal disease (13). Regardless of these physiological features that limit the use of Scr to calculate renal function, the following basic equation involving the input, output, and blood concentration of creatinine can be expressed: v dy/dt=m-vcy, where y = Scr (mg/dL), v = volume in which creatinine is evenly distributed (dL), m = rate of creatinine input (mg/hr), c = volumetric proportion of creatinine excretion per unit time (/hr), and dy/dt = change in the Scr concentration per unit time (mg/dL/hr). The parameter c is considered a constant (unchanged over time) if renal excretory function is unchanged. The derivation of equations from this basic differential equation should consider various scenarios. First, the rate of creatinine output is greater than that of creatinine input which is usually observed in transplant patient, can be expressed as
1
1
c t km
y
e
vc
(1)where k1(hr) is constant of integration. Second, the rate of creatinine input is the equal to the rate of creatinine output, can be expressed as
y
m
vc
(2) Third, the kidney function is almost zero (c=0), can be expressed as
y
m
t
k
3
v
(3) where k3 is constant of integration (mg/dL).D. Mathematical model equations for improving renal function
For an equation to be able to describe the recovery of kidney function, it should have the following properties: the equation should be continuous and integrable, always yield a value equal to or higher than 0, and provide incremental values until the asymptote. The logistic equation, which represents the time-varying carrying capacity, could be used in the following first-order linear differential equation. Because logistic equations are commonly used to model population growth, this type of equations could also be used to model the functional recovery pattern of a kidney graft after transplantation. The basic concept underlying the modified logistic equation is
(
)
where r = rate of functional recovery and maximal functional capacity and C(t) = volumetric proportion of creatinine excretion per unit time (/hr) depending on the time variable. Because a kidney with a greater functional reserve (maximal functional capacity) can more quickly recover its function (rate of functional recovery) after transplantation, it can be hypothesized that the growth rate and the carrying capacity in the original logistic equation are equal in the modified logistic equation. The following new generalized and deterministic equations for renal function and Scr can then be derived as- 6 -
( )
rt rtre
C t
e
a
(4)5
(
)
rt rte
m
at
k
r
y
v e
a
(5)where a is unitless constant and k5 is constant of integration (hr). Finally, the mathematical association between serum creatinine (y) and renal function (C) can be expressed as
2 5 ln ln 1 m c rk y r c r a r c vr r c a (6)E. Statistical analysis
The values calculated using the model equations and the measured values were included in a linear regression analysis to determine the R2 (R squared, coefficient of determination) and F-test values. A good curve fit with the measured Scr was strictly defined based on an R2 value greater than 0.95 for each equation. The unstandardized beta-coefficients for the constant and the coefficient were obtained with P value. The Durbin-Watson test values to measure auto-correlation in residuals from regression analysis were also obtained using SPSS version 20 (SPSS Inc, United States). Autocorrelation is the similarity of a time series over successive time intervals. The Durbin-Watson test reports a test statistics with a value from 0 to 4, where 2 is no autocorrelation.
III.
RESULTS
A. Demographic characteristics
All 623 patients who underwent kidney transplantation from January 2008 to June 2018 at a single institute were included to validate the mathematical equations for Scr, and 14,360 laboratory results for Scr from the time of transplantation (the time of re-perfusion) to 30 days post-transplantation were analysed. The mean ± standard deviation of the number of Scr measurements obtained from a patient at various time points post-transplantation is 23.05 ± 4.07. Two hundreds sixty-six patients received a kidney from live donors and 357 patients from deceased donors. Means ± standard deviations of recipient age and donor age were 46.8 ± 10.4 and 44.6 ± 14.5, respectively. Two hundreds fifty-six recipients and 246 donors were women. Means ± standard deviations of recipient weight (kg) and donor weight (kg) were 61.8 ± 11.34 and 65.7 ± 12.9, and those of recipient height (cm) and donor height (cm) were 164.7 ± 8.7 and 166.0 ± 9.0, respectively.
B. Validation of the model
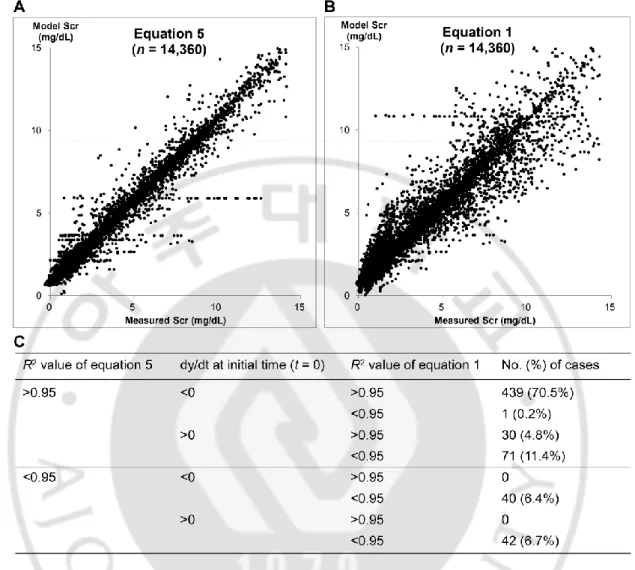
An overall linear regression analysis yielded R2 value for equation 5 of 0.972 (Fig. 1A), and the corresponding value for equation 1 were 0.925 (Fig. 1B). The F-test was then used to determine whether the model is good fit to the data, and the results yielded values of 504,146.461 (P < 0.001) for equation 5 and 176,290.156 (P < 0.001) for equation 1. The unstandardized beta-coefficient of equation 5 shows that constant is -0.010 and the coefficient is 1.002 (P < 0.001), and that of equation 1 shows that constant is -0.010 and the coefficient is 1.003 (P < 0.001). The Durbin-Watson test values to measure auto-correlation in residuals from
- 8 -
regression analysis demonstrate 1.962 for equation 5 and 1.856 for equation 1. Equation 5 for improving renal function is more generalized and more applicable than equation 1 for unchanged renal function (Fig. 1C).
An individual linear regression analysis of 623 patients showed that R2 values greater than 0.95 were obtained for equation 5 with 86.8% (541 cases) of patients and equation 1 with 75.3% (469 cases) of patients. The cases of poor fit between the values obtained with equation 5 and the measured values of Scr (R2 value < 0.95) were clinically reviewed to determine the causes of this discrepancy, and the results revealed 26 cases of post-transplant dialysis, 15 episodes of rejection, 11 postoperative complications, 24 calcineurin inhibitor nephrotoxicity, 1 systemic and local infection, and 5 transient graft dysfunction due to an undetermined cause.
Fig. 1. Validation of model equations for Scr in total population. A: distribution of measured
Scr values for the total population (n = 623) and values obtained using equation 5
𝑚(𝑒𝑟𝑡𝑟+𝑎 +𝑘5) 𝑣 (𝑒𝑟𝑡+𝑎) . The R2 value is 0.972, and F-test value is 504,146.461 (P < 0.001). B: distribution of measured Scr values for the total population (n = 623) and values obtained using equation 1 𝑚
𝑣𝑐
{ +
𝑒
−𝑐( +𝑘1)}
. The R2value is 0.925, and F-test value is 176,290.156 (P < 0.001). C: characteristics of the fitness of the model equations for the total population (n = 623). For each equation, good curve fit to the measured Scr values is defined as an adjusted R2 value greater
- 10 -
than 0.95. Among the 541 (86.9%) cases that showed good fit with equation 5, the initial 𝑦 values of 101 cases (18.7%) are greater than 0. Among the 101 cases with initial 𝑦
> 0, 71 cases (70.3%) show poor fit with equation 1. None of the cases that showed poor fit with equation 5 showed good fit with equation 1. Equation 5 for improving renal function is more generalized and more applicable than equation 1 for stable renal function. Scr, serum creatinine.
C. Classification of the functional recovery pattern based on equations
4 and 5
Using equation 4, the initial renal function immediately after re-perfusion following transplant surgery can be calculated as
( )
1+𝑎. The time at which a transplanted kidney recovers 99%of its functional capacity (r) is
( 𝑎), and in general terms, the time at which the kidney
recovers x% of its functional capacity (r) is
1
(1 − )𝑎 . The proportion of pre-transplant
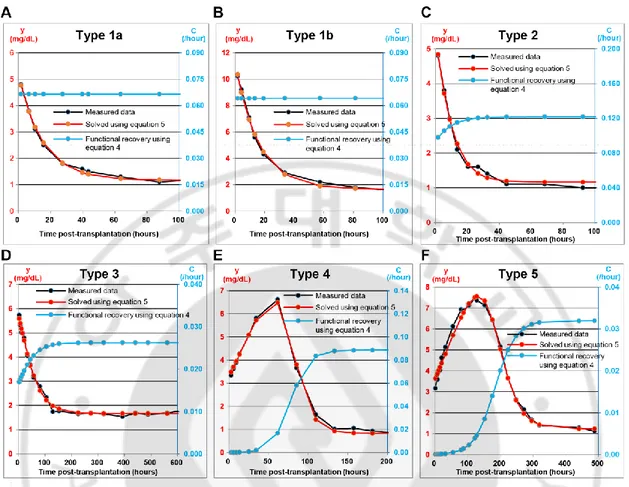
renal injury to expected full function of the graft can be calculated as − ( ) 1+𝑎𝑎 . Five types of functional recovery patterns were classified according to the severity of the pre-transplant injury and the speed of the functional recovery of the kidney graft post-transplantation (Fig. 2).
- 12 -
Fig. 2. Classification of the severity of pre-transplant renal injury and recovery time at post-transplantation. A: example of type 1a. r = 0.066472 (/hr), a = 0.000000, k5 = 51.572055
(hr), m/v = 0.077876 (mg/dL/hr). No pre-transplant injury: 129 cases (23.8%). The constant “a” in equation 5 is almost 0, and the constant “c” in equation 4 is equal to constant “r” in equation 5, which clinically suggests that the kidney graft reached full function immediately after re-perfusion, and that no further recovery of renal function was achieved after transplantation. B: example of type 1b. r = 0.064122 (/hr), a = 0.001416, k5 = 91.153870 (hr), m/v = 0.106519 (mg/dL/hr). Minimal (1%) transplant injury: 29 cases (5.4%). The proportion of pre-transplant renal injury to expected full function of the graft,
(
− ( ) 1+𝑎𝑎)
, is less than 1%. C:example of type 2. r = 0.121604 (/hr), a = 0.293297, k5 = 41.148330 (hr), m/v = 0.140837 (mg/dL/hr). Moderate (1–50%) pre-transplant injury and rapid functional recovery: 88 cases (16.3%). 0.01 < − ( ) 1+𝑎𝑎 ≤ 0.5, and the recovery time required to reach 99% of expected
full function (functional capacity),
( 𝑎) based on equation 4, is less than 36 hours. D: example of type 3. r = 0.026282 (/hr), a = 0.591045, k5 = 170.169239 (hr), m/v = 0.043779 (mg/dL/hr). Moderate (1–50%) pre-transplant injury and slow functional recovery: 90 cases (16.6%). 0.01 < − ( ) 1+𝑎𝑎 ≤ 0.5,
( 𝑎) ≥ 36 hours. E: example of type 4. r = 0.088510 (/hr), a = 983.131123, k5 = 43,805.651890 (hr), m/v = 0.073571 (mg/dL/hr). Severe (>50%) pre-transplant injury and rapid functional recovery: 103 cases (19.0%). − ( ) 𝑎
1+𝑎 > 0.5,
( 𝑎) < 144 hours (6 days). F: example of type 5. r = 0.031957 (/hr), a = 354.134151, k5 = 32,054.956071 (hr), m/v = 0.039461 (mg/dL/hr). Severe (>50%) pre-transplant injury slow functional recovery: 102 cases (18.9%). − ( ) 1+𝑎𝑎 > 0.5,
( 𝑎)
- 14 -
D. Distribution of the parameters, pre-transplant injury, and 99%
recovery time
The median interquartile range of the constants r (/h), a, k (h), and m/v (mg/dL/h) in the equation of Scr were 0.074 (0.039–0.120), 0.533 (0.000–2.141), 118.525 (61.936–313.240), and 0.090 (0.055–0.134), respectively. Those of the proportion of the amount of kidney injury to maximal functional reserve (%) and the time of 99% of functional recovery (h) were 34.79 (0.00–68.16) and 48.505 (27.107–152.751), respectively.
E. Comparison between commonly used eGFR formulas and creatinine
clearance calculated using the model
Most of the eGFR formulas are mathematically applicable only if 𝑦
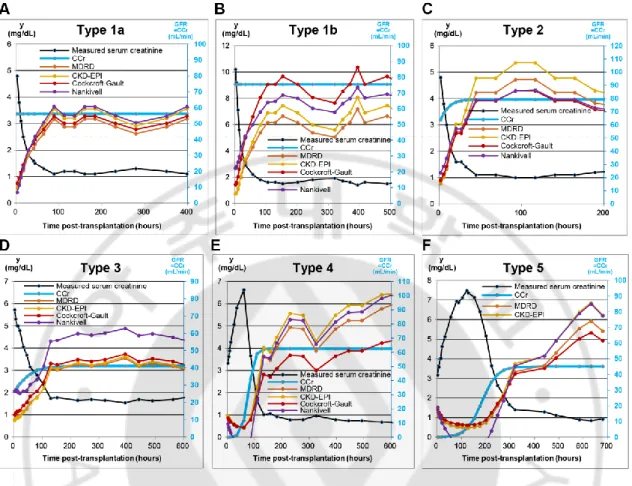
. For example, for the type 1 functional recovery pattern (Fig. 3), even though the renal function does not change continuously after transplantation, the Scr level decreases to a certain asymptote (baseline), which results in an increase in the eGFRs. The eGFRs calculated using Scr are not mathematically applicable until the Scr reaches a certain value (i.e., when 𝑦 approaches 0, which reflects an equilibrium state in which the rate of creatinine input equals the rate of creatinine output). Although renal graft function continuously increases in the type 4 and 5 cases, the Scr level can initially increase because the creatinine output is less than the creatinine input (Fig. 3). Until the Scr reaches a plateau or a certain level (i.e., when 𝑦
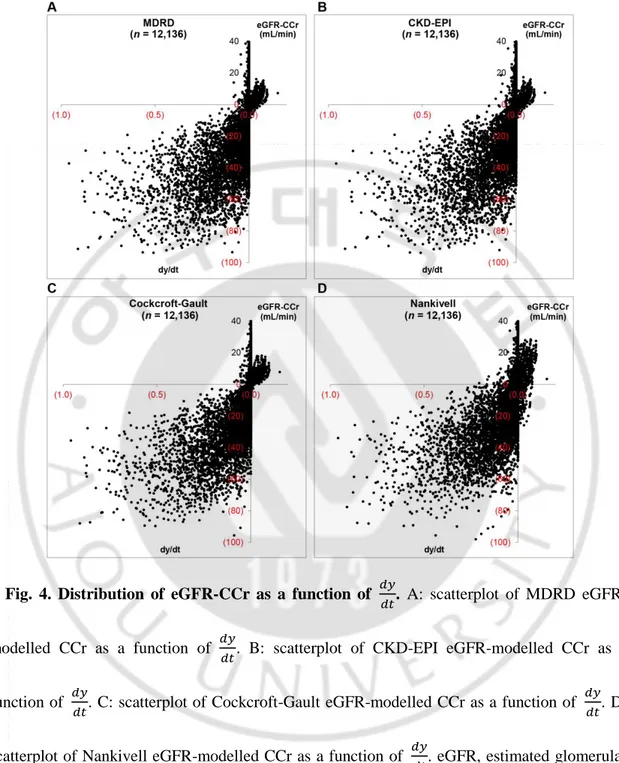
approaches 0), the eGFR equations are not mathematically applicable. The differences between eGFRs and CCr (eGFR-CCr) decrease as 𝑦 approaches 0 (Fig. 4). The difference between eGFRs and CCr
(eGFR-CCr) is greater and widely distributed as 𝑦 is far from 0. If 𝑦
<
, the eGFRequations provide an underestimation; in contrast, if 𝑦
>
, the eGFR equations overestimate the results.Within the narrow range of
. 2 <
𝑦< . 2
, 1,508 Scr levels were measured, and the corresponding eGFRs were calculated and compared with the CCr. Pearson‟s correlation coefficients for the correlations of the MDRD, CKD-EPI, Cockcroft-Gault,- 16 -
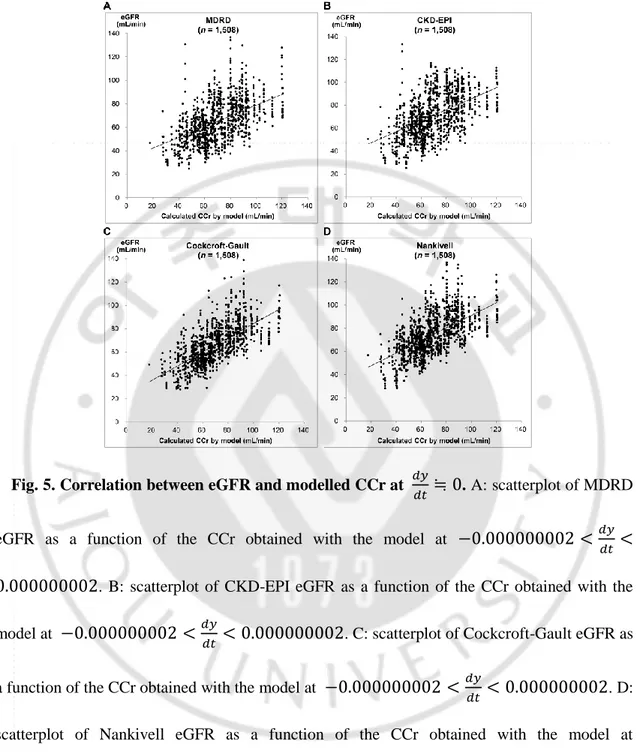
and Nankivell eGFRs with the CCr were 0.446 (P < 0.001), 0.459 (P < 0.001), 0.651 (P < 0.001), and 0.599 (P < 0.001), respectively. A linear regression analysis showed that R2 values for the MDRD eGFR were 0.199, and those for the CKD-EPI, Cockcroft-Gault and Nankivell eGFRs were 0.211, 0.423, and 0.359, respectively. The F-test yielded values of 373.735 (P < 0.001) for the MDRD eGFR, 402.860 (P < 0.001) for the CKD-EPI eGFR, 1,105.812 (P < 0.001) for the Cockcroft-Gault eGFR, and 842.871 (P < 0.001) for the Nankivell eGFR (Fig. 5).
Fig. 3. Comparison of eGFRs and modelled CCr for the example case of different types. A:
comparison of eGFRs and modelled CCr for type 1a case. r = 0.066472 (/hr), a = 0.000000. B: comparison of eGFRs and modelled CCr for type 1b case. r = 0.064122 (/hr), a = 0.001416. C: comparison of eGFRs and modelled CCr for type 2 case. r = 0.121604 (/hr), a = 0.293297. D: comparison of eGFRs and modelled CCr for type 3 case. r = 0.026282 (/hr), a = 0.591045. E: comparison of eGFRs and modelled CCr for type 4 case. r = 0.088510 (/hr), a = 983.131123. F: comparison of eGFRs and modelled CCr for type 5 case. r=0.031957 (/h), a=354.134151. eGFR, estimated glomerular filtration rate; CCr, creatinine clearance; MDRD, modification of diet in renal disease; CKD-EPI, chronic kidney disease-epidemiology collaboration.
- 18 -
Fig. 4. Distribution of eGFR-CCr as a function of 𝑦 . A: scatterplot of MDRD
eGFR-modelled CCr as a function of 𝑦 . B: scatterplot of CKD-EPI eGFR-modelled CCr as a
function of 𝑦 . C: scatterplot of Cockcroft-Gault eGFR-modelled CCr as a function of 𝑦 . D:
scatterplot of Nankivell eGFR-modelled CCr as a function of 𝑦 . eGFR, estimated glomerular filtration rate; CCr, creatinine clearance; MDRD, modification of diet in renal disease; CKD-EPI, chronic kidney disease-epidemiology collaboration.
Fig. 5. Correlation between eGFR and modelled CCr at 𝑦
≒
. A: scatterplot of MDRD eGFR as a function of the CCr obtained with the model at. 2 <
𝑦
<
. 2
. B: scatterplot of CKD-EPI eGFR as a function of the CCr obtained with the model at. 2 <
𝑦< . 2
. C: scatterplot of Cockcroft-Gault eGFR asa function of the CCr obtained with the model at
. 2 <
𝑦< . 2
. D: scatterplot of Nankivell eGFR as a function of the CCr obtained with the model at. 2 <
𝑦< . 2
. eGFR, estimated glomerular filtration rate; CCr,creatinine clearance; MDRD, modification of diet in renal disease; CKD-EPI, chronic kidney disease-epidemiology collaboration.
- 20 -
IV.
DISCUSSION
The measurement of Scr has been the most commonly used laboratory test for estimating the excretory function of the kidney. The mathematical or statistical association between Scr and renal function is important. The Kidney Disease Improving Global Outcomes statement proposes that creatinine-based eGFR equations should be used to evaluate renal function in the everyday management of renal transplant recipients (10). Most of the commonly used eGFR equations have been developed through a statistical analysis of patients with chronic kidney disease. However, kidney transplant recipients comprised only 4% of the cohort used to derive the CKD-EPI eGFR equation. Several studies of kidney transplantation have reviewed the efficiency of the MDRD, Cockcroft-Gault and Nankivell equations, and the results have shown significant heterogeneity between studies and indicated that the equations show low precision and thus limited accuracy (21). Scr-based eGFR equations have never been demonstrated to improve the clinical recognition of changes in transplant function (17). The basic assumption of the eGFR equations is that Scr does not change or only changes at a slow rate over time ( 𝑦
≒ )
. However, starting immediately after kidney transplantation, the Scr level usually changes very rapidly as the kidney graft exhibits functional recovery. The basic assumptions of the new equation should consider that Scr can change(
𝑦≠ )
over time and that the renalexcretory function can also change
(
≠ )
over time. The pattern of the change in renal function should represent the functional recovery of a transplanted kidney from pre-transplant orischemic injuries
(
≥ )
. Equation 5𝑦
𝑚(𝑒𝑟𝑡𝑟 +𝑎 +𝑘5)
changes in the measured Scr level over time in recipients with an uneventful post-transplant
course. If equation 5 explains the measured Scr, equation 4
( )
𝑒 𝑟𝑡𝑒𝑟𝑡+𝑎 is useful for calculating the renal excretory function at a certain time. Using equation 4, the degree of kidney injury before or during transplantation and the rate at which it recovers function after transplantation can be calculated, and these calculated values are essential for research on DGF. Due to the complexity of the pathophysiology of DGF, it is difficult to find a simple definition of DGF, which explains why more than 10 different definitions currently exist (18, 20). The most common definition of DGF is based on the post-transplant dialysis requirements (at least one dialysis session during the first week after transplantation). Although useful for data reporting, this definition suffers from many pitfalls, including clinically dependent decisions, dialysis requiring potassium or fluid overload, metabolic acidosis, and uremic symptoms, which might lead to misclassification or the large variations in DGF rates that are observed in multicentre trials (7). For more accurate data reporting, the mathematically derived equation 4 of the model can be used as the definition for DGF.
Among the mathematical models which authors described, the model equation for improving renal function was regarded as the most complex and important mathematical model in this study. The assumption of a renal recovery pattern is a key hypothesis of this study because the functional recovery of transplanted kidney is not justified as a simple equation. As mentioned in method section, the authors assumed that the functional recovery of transplanted kidney should be continuous, integrable, and yield a value equal to or higher than 0. Furthermore, we assumed that the functional recovery of transplanted kidney should be changing over time and
- 22 -
converging to zero when renal excretory function reaches the maximal functional capacity. As a result, it was appropriate that the logistic equation which explained a common model of population growth was the most suitable equation for our assumptions. Of course, there was a difference between the basic logistic equation and our equation that the rate of functional recovery and the maximal functional capacity were defined as an equal variable. The authors assumed that a graft kidney with a greater functional capacity would recover a graft function more quickly. One of the major evidence of this assumption is that, in situation of no post-transplant kidney injury, the grafts with different maximal functional capacity recover their function within a very short time after transplantation and reach the maximal functional capacity; therefore the rate of recovery of the graft with the greater functional capacity should be relatively faster than the rate of other grafts. Also, theoretically, there is no significant mathematical error in setting two variables as an equal value in this equation.
In this study, the authors assumed that there was no or little change in volume of distribution of creatinine within study period. This assumption would be arguable that perioperative volume resuscitation and fluid shifts can affect the volume of distribution in kidney transplant recipients. When the authors defined „v’ (volume in which creatinine is evenly distributed) in
𝑣
𝑦𝑚
𝑣𝑐𝑦
, „v’ was not a measured value but a calculated value by other variables. Also, the creatinine is produced mainly by body muscles, and each kidney transplant recipients have a different burden of muscles which mean that creatinine production may not be proportional to body weight. For example, the calculated „v’ of recipients who have a lot more muscles (more creatinine produced) can exceed their body weight theoretically. Admitting the volume changein the equation, the calculation of volume distribution is impossible. Yet the volume shift is existing in perioperative stage, the assumption that „v’ is a constant value through the equation is inevitable for supporting the equation in this study.
This study has several limitations. First, this study is based on a retrospective data collection of kidney transplantation recipients. In fitting the model equations, the same data was used to calculate the coefficients of the model for each individual. These coefficients vary significantly among individual recipients and these are not revealed until the data has been collected and can be calculated retrospectively. Therefore, this study is not suitable for predicting GFR in real time and is providing the concepts of renal graft function after transplantation along with a renal graft recovery pattern. Second, the mathematical models in this study have the following limitations: equation 5 cannot explain the measured Scr under two conditions. First, if the kidney graft is injured after transplantation, decreases to less than 0, and thus, the Scr level predicted with equation 5 does not fit the measured Scr (9.0% of population) because this equation was developed under the assumption that
>
at all times. Second, if a patient is treated with dialysis after transplantation, creatinine is artificially eliminated from blood, and the resulting substantial amount of extra-renal creatinine output results in a lack of fit with the predictions obtained with equation 5 (4.2% of population).- 24 -
V.
CONCLUSION
In conclusion, the proposed equations can be used to not only calculate the renal function at a certain time but also assess functional recovery after transplantation. Furthermore, these equations can be used to define and research DGF. Also, the relationship between renal recovery patterns discussed in this study and pre-transplant injury variables is need to be studied in future, and the correlation of renal recovery patterns and long-term graft outcome should be followed by this study.
REFERENCES
1. Aitken E, Cooper C, Dempster N, McDermott M, Ceresa C, Kingsmore D. Delayed graft function is a syndrome rather than a diagnosis. Exp Clin Transplant 13: 19-25, 2015.
2. Bouquegneau A, Vidal-Petiot E, Vrtovsnik F, Cavalier E, Rorive M, Krzesinski JM, Delanaye P, Flamant M. Modification of Diet in Renal Disease versus Chronic Kidney Disease Epidemiology Collaboration equation to estimate glomerular filtration rate in obese patients. Nephrol Dial Transplant 28 Suppl 4: iv122-iv130, 2013.
3. Ceriotti F, Boyd JC, Klein G, Henny J, Queralto J, Kairisto V, Panteghini M, IFCC Committee on Reference Intervals and Decision Limits (C-RIDL). Reference intervals for serum creatinine concentrations: assessment of available data for global application. Clin Chem 54: 559-566, 2008.
4. Cockcroft DW, Gault MH. Prediction of creatinine clearance from serum creatinine. Nephron 16: 31-41, 1976.
5. Delanaye P, Cavalier E, Cristol JP, Delanghe JR. Calibration and precision of serum creatinine and plasma cystatin C measurement: impact on the estimation of glomerular filtration rate. J Nephrol 27: 467-475, 2014.
6. Delanaye P, Cavalier E, Radermecker RP, Paquot N, Depas G, Chapelle JP, Scheen AJ, Krzesinski JM. Cystatin C or creatinine for detection of stage 3 chronic kidney disease in anorexia nervosa. Nephron Clin Pract 110: c158-c163, 2008.
- 26 -
7. Gaber AO, Mulgaonkar S, Kahan BD, Woodle ES, Alloway R, Bajjoka I, Jensik S, Klintmalm GB, Patton PR, Wiseman A, Lipshutz G, Kupiec-Weglinski J, Gaber LW, Katz E, Irish W, Squiers EC, Hemmerich S. YSPSL (rPSGL-Ig) for improvement of early renal allograft function: a double-blind, placebo-controlled, multi-center phase IIa study. Clin Transplant 25: 523-533, 2011.
8. Gregoir W. Congenital vesico-ureteral reflux [inFrench]. Acta Urol Belg 30: 286-300, 1962.
9. Levey AS, Bosch JP, Lewis JB, Greene T, Rogers N, Roth D. A more accurate method to estimate glomerular filtration rate from serum creatinine: a new prediction equation. Modification of Diet in Renal Disease Study Group. Ann Intern Med 130: 461-470, 1999.
10. Levey AS, Eckardt KU, Tsukamoto Y, Levin A, Coresh J, Rossert J, De Zeeuw D, Hostetter TH, Lameire N, Eknoyan G. Definition and classification of chronic kidney disease: a position statement from Kidney Disease: Improving Global Outcomes (KDIGO). Kidney Int 67: 2089-2100, 2005.
11. Levey AS, Stevens LA, Schmid CH, Zhang YL, Castro AF, 3rd, Feldman HI, Kusek JW, Eggers P, Van Lente F, Greene T, Coresh J, CKD-EPI (Chronic Kidney Disease Epidemiology Collaboration). A new equation to estimate glomerular filtration rate. Ann Intern Med 150: 604-612, 2009.
12. Lich R, Jr., Howerton LW, Davis LA. Childhood urosepsis. J Ky Med Assoc 59: 1177-1179, 1961.
13. Mitch WE, Walser M. A proposed mechanism for reduced creatinine excretion in severe chronic renal failure. Nephron 21: 248-254, 1978.
14. Nankivell BJ, Gruenewald SM, Allen RD, Chapman JR. Predicting glomerular filtration rate after kidney transplantation. Transplantation 59: 1683-1689, 1995.
15. Pottel H, Vrydags N, Mahieu B, Vandewynckele E, Croes K, Martens F. Establishing age/sex related serum creatinine reference intervals from hospital laboratory data based on different statistical methods. Clin Chim Acta 396: 49-55, 2008.
16. Preiss DJ, Godber IM, Lamb EJ, Dalton RN, Gunn IR. The influence of a cooked-meat meal on estimated glomerular filtration rate. Ann Clin Biochem 44: 35-42, 2007.
17. Santos J, Martins LS. Estimating glomerular filtration rate in kidney transplantation: still searching for the best marker. World J Nephrol 4: 345-353, 2015.
18. Schroppel B, Legendre C. Delayed kidney graft function: from mechanism to translation. Kidney Int 86: 251-258, 2014.
19. Sharif A, Borrows R. Delayed graft function after kidney transplantation: the clinical perspective. Am J Kidney Dis 62: 150-158, 2013.
20. Siedlecki A, Irish W, Brennan DC. Delayed graft function in the kidney transplant. Am J Transplant 11: 2279-2296, 2011.
- 28 -
21. White CA, Huang D, Akbari A, Garland J, Knoll GA. Performance of creatinine-based estimates of GFR in kidney transplant recipients: a systematic review. Am J Kidney Dis 51: 1005-1015, 2008.
-국문요약-