Electronic structure and anomalous band-edge absorption feature in multiferroic MnWO
4:
An optical spectroscopic study
Woo Seok Choi,1K. Taniguchi,2S. J. Moon,1,
*
S. S. A. Seo,1,†T. Arima,2H. Hoang,3,4I.-S. Yang,3 T. W. Noh,1and Y. S. Lee5,‡1ReCFI and FPRD, Department of Physics and Astronomy, Seoul National University, Seoul 151-747, Korea 2Institute of Multidisciplinary Research for Advanced Materials, Tohoku University, Sendai 980-8577, Japan 3Department of Physics and Division of Nano-Sciences, Ewha Womans University, Seoul 120-750, Korea
4Faculty of Physics, Hanoi National University of Education, 136 Xuanthuy, Caugiay, Hanoi, Vietnam 5Department of Physics, Soongsil University, Seoul 156-743, Korea
共Received 24 September 2009; revised manuscript received 20 January 2010; published 13 May 2010兲
We investigated the electronic structure and lattice dynamics of multiferroic MnWO4by optical spectros-copy. With variation in polarization, temperature, and magnetic field, we obtained optical responses over a wide range of photon energies. The electronic structure of MnWO4near to the Fermi level was examined with interband transitions identified in optical conductivity spectra above a band gap of 2.5 eV. As for the lattice dynamics, we identified all the infrared transverse optical-phonon modes available according to the group-theory analysis. Although we did not observe much change in global electronic structure across the phase-transition temperatures, an optical absorption at around 2.2 eV showed an evident change depending upon the spin configuration and magnetic field. The behavior of this band-edge absorption indicates that spin-orbit coupling plays an important role in multiferroic MnWO4.
DOI:10.1103/PhysRevB.81.205111 PACS number共s兲: 78.20.⫺e, 75.30.⫺m, 77.90.⫹k, 78.30.⫺j
I. INTRODUCTION
Magnetoelectric multiferroic oxides show not only simul-taneous orderings of both electric and magnetic order param-eters but also a coupling between them.1–3 Due to these
in-triguing physical properties, multiferroic oxides have recently been attracting considerable attentions. In particular, ferroelectricity can be induced through the noncollinear spin structure in several transition-metal oxides including RMnO3 共R=rare earth ions兲,4,5 Ni
3V2O8,6 CoCr2O4,7 LiCu2O2,8 and MnWO4,9 suggesting a strong magnetoelectric coupling. In these multiferroic oxides, noncollinear spiral spin structure without centrosymmetry may induce macroscopic spontane-ous electric polarization. This process works through the in-verse of the Dzyaloshinski-Moriya interaction, taking into account the strong spin-orbit coupling共SOC兲 effect.5,10
MnWO4is an outstanding multiferroic oxide that exhibits ferroelectricity induced by its spiral spin structure.9,11,12 One
of the advantages of studying MnWO4is that it has only one kind of magnetic ion 共Mn2+兲 whereas other multiferroic ox-ides usually have multiple magnetic ions, thus hindering in-vestigation of their magnetic properties. With the advantage of single magnetic ion, we are provided with a clear window into the electromagnetic coupling behavior and are able to make simple analyses of the magnetic field dependence and SOC effects. Structurally, MnWO4 has a wolframite crystal structure, containing WO6octahedra.9,13Its magnetic phases are characterized by various antiferromagnetic 共AF兲 states such that the first antiferromagnetic phase appears below TN3⬇13.5 K. Successive magnetic phase transitions occur at TN2⬇12.5 K and TN1⬇6.5–8 K, forming three different antiferromagnetically ordered phases: AF1 共TⱕTN1兲, AF2 共TN1ⱕTⱕTN2兲, and AF3 共TN2ⱕTⱕTN3兲.14,15 These
mag-netic phases have been characterized by neutron-scattering experiments, which have shown that AF1 has a collinear
up-up-down-down spin structure, AF2 has a noncollinear spiral spin structure, and AF3 has a sinusoidal collinear spin structure.14,15 Spontaneous electric polarization occurs at
AF2, which suggests that the noncollinear spiral structure might be the origin of the induced ferroelectricity in MnWO4.
Studies on magnetoelectric coupling in MnWO4 have quite recently started to expand their scope to multiple new aspects. The ferroelectric共FE兲 loop and domain dynamics of MnWO4 have been studied under a magnetic field.16–18 Ad-ditionally, suppression of the ferroelectric phase and change in magnetic ordering by doping Fe and Co ions has been observed.19,20More recently, the magnetoelectric memory ef-fect was identified in MnWO4 by applying a magnetic field.21In this series of works, much attention was paid to the
direct observation of the ferroelectric polarization and its be-havior under a magnetic field.
Despite such extensive studies on MnWO4, detailed opti-cal spectroscopic investigations have not been reported. Op-tical spectroscopy is an indispensable tool in studying the multiferroic oxides, for example, the electromagnon may be observed in the terahertz energy region for RMnO3 or RMn2O5, providing direct evidence of electromagnetic coupling.22,23 Also, changes in the electronic structure
yielded information on the lattice coupling or charge-spin coupling in some oxide multiferroics.24,25 Moreover, it
should be noted that optical spectroscopy is an excellent tool to investigate various interactions within materials, such as electron charge/spin/lattice/orbital coupling.26 In particular,
given that the SOC is an essential factor in the formation of ferroelectricity by the spiral spin structure in multiferroic ox-ides, optical investigation is crucial to understand the mag-netoelectric coupling in MnWO4.
In this paper, we present an optical spectroscopic study on single-crystal MnWO4. By varying light polarization and
temperature and by application of a high magnetic field, we characterized the electronic structure and lattice dynamics of MnWO4. The optical spectra of MnWO4indicate that Mn 3d and W 5d bands contribute to the electronic structure near the Fermi energy, generating a band gap at 2.5 eV. For the lattice dynamics, we recognized all of the 15 infrared-共IR-兲 active phonons calculated from the group-theory analyses. In addition to these features, we identified a tiny optical-absorption feature just below the fundamental band gap, which shows a strong temperature and magnetic field depen-dence. This band-edge absorption feature could be attributed to the intra-atomic d-d transition between the Mn states, im-plying the importance of the SOC in MnWO4.
II. EXPERIMENTS
We synthesized single crystals of MnWO4 using the floating-zone method. The crystals were oriented using Laue x-ray photographs and cleaved into thin plates with wide faces perpendicular to the crystallographic principal axis b 共010兲. To obtain the faces perpendicular to a 共100兲 and c 共001兲, the crystals were cut and then polished down to 0.3 m using diamond pastes. More details on the single-crystal growth have been described elsewhere.12 The thick-nesses of the single crystal were 500 m, 450 m, and 700 m for共100兲, 共010兲, and 共001兲 surfaces, respectively.
We measured near-normal incident reflectance关R共兲兴 and transmittance 关T共兲兴 spectra of MnWO4 in a wide photon energy共兲 range 共3.7 meV to 20 eV兲 for each axis. We chose the axes near the crystallographic axes that did not show any oscillation due to birefringence. We used Fourier-transformed infrared spectrophotometers 共Bomem DA8 and Bruker IFS66v/S with 4 – 8 cm−1 resolution兲 between 3.7 meV and 1.5 eV, a near-infrared-visible-ultraviolet grating monochromator共CARY 5G兲 between 0.6 and 5.9 eV, and an ultraviolet synchrotron spectrometer 共3B1 beamline兲 in the Pohang Light Source 共PLS, Korea兲 from 4.8 eV to 20 eV. The magnetic field 共H兲 dependent optical spectra between 1.11 eV 共1120 nm兲 and 3.26 eV 共380 nm兲 were measured using a grating spectrophotometer equipped with a 33 T re-sistive magnet at the National High Magnetic Field Labora-tory共Tallahassee, FL, USA兲.
III. RESULTS AND DISCUSSION A. Electronic structure of MnWO4
The thin MnWO4 samples had a transparent window be-tween⬃0.2 and ⬃2.0 eV, which determines the red color of the single crystal. In this spectral region, we obtained T共兲 along with R共兲 and used both to derive complex dielectric constants from a numerical iteration process 关the intensity transfer-matrix method共ITMM兲 共Ref.27兲兴. To obtain the op-tical conductivity spectra 关共兲兴 over the whole photon-energy region, we conducted Kramers-Kronig共KK兲 analysis using R共兲. For KK analyses, we extrapolated reflectance spectra in low-frequency regions below our measurements as a constant. For frequency regions above 20 eV, we extended reflectance at 20–30 eV as a constant and then assumed−4 dependence.28,29 We further confirmed that the results from
ITMM and KK analyses using R共兲 were consistent.30
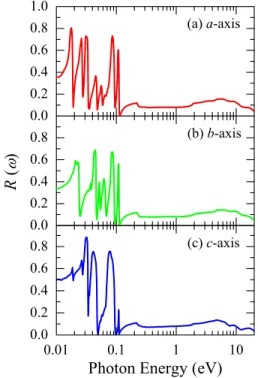
Figure1shows R共兲 for MnWO4on different axes at 300 K. The electric field of the incident light was polarized to show the optical responses of the crystallographic axes indi-cated in the figure. We observed that R共兲 for the 共001兲 and 共100兲 planes, with the light polarized along the b axis, were nearly identical, indicating a high quality of the single crys-tals and validating our optical experiment. The spectral fea-tures below 0.2 eV mostly come from the complex phonon structure in the system, which will be addressed in detail in the next section.
In MnWO4, Mn2+ ions have five electrons in the 3d or-bital with high spin configurations whereas no electron is present in the 5d orbital for W6+ ions. For this reason, the unoccupied electronic state of MnWO4 near the Fermi level should be composed of W 5d states and Mn 3d states, with the occupied state composed of Mn 3d states. Due to crystal-field splitting of MnO6and WO6octahedra, each state is split into t2gand egstates.
Figure2shows 共兲 of MnWO4at 300 K obtained from the KK analyses. Besides the low-phonon parts, we could observe larger peaks at higher energies, giving rise to a band gap at ⬃2.5 eV. We could well describe the higher-energy peaks with the sum of Lorentz oscillators as shown as dotted gray lines in Fig.2. The thin gray lines represent each oscil-lator. Our result indicates that the electronic structure of MnWO4 consists mainly of two broad peaks located at ⬃5 and ⬃6.5 eV. These two peaks might be attributed to a charge-transfer excitation from O 2p to Mn 3d and W 5d states, regarding their sizeable strength and very broad na-ture. There are also small peaklike structure at lower energies which could not be fully understood using Lorentz oscilla-tors. These peaks might originate from the interband d-d transitions, probably from Mn 3d to W 5d states. Resolution
FIG. 1. 共Color online兲 R共兲 of MnWO4at 300 K for共a兲 a-axis,
共b兲 b-axis, and 共c兲 c-axis responses.
of a more detailed electronic structure and an exact peak assignment would be possible by comparison to the band calculation, which is not currently available for MnWO4.
B. Optical-phonon structure of MnWO4
Focusing on phonon structure, MnWO4 has a wolframite crystal structure that belongs to the monoclinic space group P2/c and C2h point group, with 2 f.u. per primitive cell. Site-group and factor-group analyses provide us 18 共8Ag + 10Bg兲 Raman-active modes and 18 共8Au+ 10Bu兲 IR-active modes. The detailed analyses are summarized in Table I while study on the Raman-active phonons is summarized elsewhere.13,31By excluding the acoustic modes共one Auand
two Bu modes兲, we had a total of 15 共7Au+ 8Bu兲 IR-active modes. Figure 3 shows the expanded共兲 between 10 and 120 meV at 300 K, where all 15 IR-active transverse-optical 共TO兲 phonons were identified. The assignments of the ex-perimentally observed TO phonons are summarized in Table
II, showing all the phonon modes predicted by the theoretical analyses. Note that the phonon numbers 6, 7, 14, and 15 are observed for more than one axis, suggesting that these phonons are degenerate. Whereas the electronic structures in Fig.2 were rather isotropic, the phonon structures in Fig.3 show a striking anisotropy. This might be due to the complex crystal structure of MnWO4 which it determines most of phonon structure but not as much the electronic structure.
FIG. 2. 共Color online兲共兲 of MnWO4at 300 K for共a兲 a-axis,
共b兲 b-axis, and 共c兲 c-axis responses in the high- region. The dotted gray lines indicate the result of Lorentz oscillator fitting. The solid gray lines represent each oscillator. The triangles indicate the peak positions of the Lorentz oscillators.
TABLE I. Factor-group analyses for MnWO4with P2/c space
group and C2hpoint group.
Atom Position Site symmetry Raman active IR active
2W 2e C2共2兲 1Ag+ 2Bg 1Au+ 2Bu
2Mn 2f C2共2兲 1Ag+ 2Bg 1Au+ 2Bu
8O1 4g C1共4兲 6Ag+ 6Bg 6Au+ 6Bu
MnWO4 12 8Ag+ 10Bg 8Au+ 10Bu
FIG. 3. 共Color online兲共兲 of MnWO4at 300 K for共a兲 a-axis,
共b兲 b-axis, and 共c兲 c-axis responses in the low- region. The inset in 共a兲 shows the temperature-dependent positions and full width at half maximum共FWHM兲 for the phonon peak for phonons of number 14 共circle兲 and 15 共square兲. The size of the symbols represents the error bar.
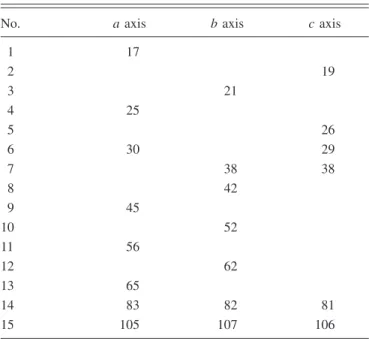
TABLE II. Phonon peaks in millielectron volt for each crystal-lographic axis.
No. a axis b axis c axis
1 17 2 19 3 21 4 25 5 26 6 30 29 7 38 38 8 42 9 45 10 52 11 56 12 62 13 65 14 83 82 81 15 105 107 106
It is also noteworthy that the TO phonons only exhibit monotonous changes with decreasing temperature, and no anomalies in their peak positions or spectral weight could be observed across the transition temperatures. In particular, we could not observe a distinct change in the phonon spectra in AF2 phase, possibly due to the limitation of our experimen-tal resolution. For example, temperature-dependent behav-iors of phonons number 14 and 15 are presented in the inset of Fig.3共a兲. The peak position and full width at half maxi-mum 共FWHM兲 of the phonon peak show only negligible changes. Such observation might seem to be opposed to the additional reflection appearing below the magnetic phase-transition temperature observed by the x-ray diffraction experiment.12 However, the optical-phonon spectra
charac-terize the lattice dynamics and is much less sensitive to the commensurate or incommensurate lattice spacing, as com-pared to the x-ray diffraction measurement. Moreover, our observation is consistent with the recent Raman studies, where Raman-active phonons likewise do not show an anomaly across the magnetic and ferroelectric transition temperatures.13,31 Therefore, a direct relation between the
phonon spectral features and the magnetoelectric coupling properties in MnWO4 could not be identified.
The nonexistence of the phonon spectra change across the phase-transition temperature is also consistent with the miss-ing electromagnon in MnWO4 in the terahertz region. The electromagnon is one of the most direct evidences for the multiferroic character having noncollinear spin structure, and it has previously been observed in the FE phase of ortho-rhombic RMnO3and RMn2O5.22,23To search for the electro-magnon feature in MnWO4, we measured the reflectance of MnWO4in the region between 5 and 80 cm−1, which corre-sponds to the region between 0.62 and 9.92 meV, using tera-hertz time-domain spectroscopy共data not shown兲. However, we could not observe any structure emerging in the AF2 phase, which corresponds to the FE phase. Rather, we ob-served several absorption features of unknown origin in this very low- region over the entire temperature range. Such absorption features might have come from lattice defects, or antiferromagnetic resonance remaining up to high tempera-ture, or other collective excitations. A more detailed and sys-tematic optical study on the terahertz region is required to clearly reveal the low-region spectra.
C. An anomalous band-edge absorption feature just below the fundamental band gap
We now turn our attention to a distinct optical absorption observed just below the band gap.32–34As shown in Fig.4共a兲,
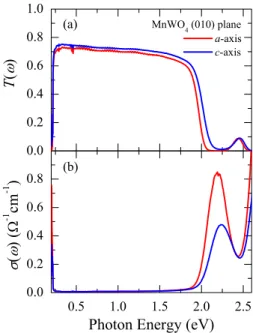
T共兲 of the MnWO4 共010兲 plane showed a dip structure at ⬃2.2 eV, before the fundamental gap at ⬃2.5 eV. This dip resulted in a peak in共兲 at ⬃2.2 eV, as shown in Fig.4共b兲. The strength of the peak is very small, with a peak height of less than 1 ⍀−1cm−1 obtained from the above-mentioned ITMM. Such a minute optical feature is only visible in T共兲, as it is comparatively much more sensitive than is R共兲. Contrary to the negligible temperature dependence of the overall electronic structure, we could observe a distinct change in the ⬃2.2 eV peak structure by varying
tempera-ture and/or applying a high magnetic field. To analyze the temperature and magnetic field dependence, we calculated optical-absorption spectra␣共兲 from T共兲 using the simple relation␣共兲=−log T共兲/d, where d is the thickness of the sample.35
Figure5共a兲shows␣共兲 of the a-, b-, and c-axis responses of MnWO4at 300 K. For the relative strength of the peak at ⬃2.2 eV for different polarizations, we note that the a-axis response is the strongest, followed by the c-axis and then b-axis responses. Figures 5共b兲–5共d兲, show the temperature dependence of ␣共兲 of the a-, b-, and c-axis responses of MnWO4, respectively. The⬃2.2 eV peak becomes sharper with decreasing temperature, down to 8 K, for all polariza-tions. However, when it enters the AF1 phase 共ⱕ7 K兲, which is known to be a commensurate collinear spin struc-ture, the peak structure becomes more susceptible to tem-perature, and its strength decreases quite drastically. Such a distinct change across the magnetic phase-transition tem-perature indicates a strong correlation between the magnetic spin structure and electronic structure in MnWO4.
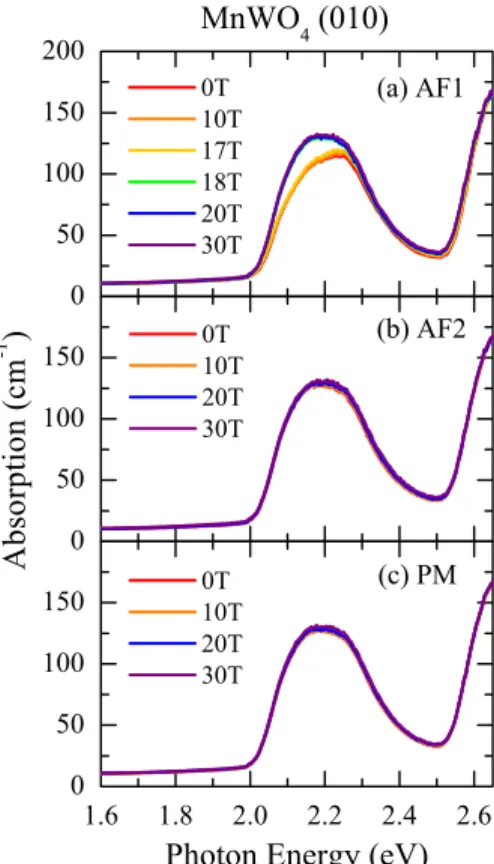
In addition to the temperature dependence, we noticed unusual magnetic field dependence for the⬃2.2 eV peak. A high magnetic field of 30 T was applied along H储c at 4, 9, and 15 K, which correspond to the AF1, AF2, and paramag-netic 共PM兲 phases of MnWO4, respectively. Figure 6shows the magnetic field dependent␣共兲 for MnWO4. Here, on the 共010兲 plane, MnWO4was measured without a polarizer, and we obtained a mixed optical response of the a axis and c axis. The spectral feature of the ⬃2.2 eV peak is invariant with increasing magnetic field strength up to 30 T, in both the PM and AF2 phases. However, in the AF1 phase, we observed a distinct change. The decreased peak intensity in the AF1 phase at 0 T is recovered to that observed at higher temperatures 共or other magnetic phases兲 with increasing magnetic field strength. The critical magnetic field strength required to recover the spectral features for the AF2 or PM phases was around 17 T共Ref.36兲.
FIG. 4. 共Color online兲 共a兲 T共兲 and 共b兲 共兲 of MnWO4at 300 K for共010兲 plane in the transparent region.
One possibility for the origin of the ⬃2.2 eV peak ob-served for MnWO4 is the exciton formed in a polar crystal. An exciton is a hydrogenlike bound state of an electron and hole arising from a long-range Coulomb interaction. It usu-ally appears just below the band gap in optical spectra and is due to the impurity levels located between the conduction band and the valence band. In addition, the typical strength of the quasiparticle is comparable to that observed for the ⬃2.2 eV peak.37However, the weak temperature and
polar-ization dependence cannot be explained with normal exci-tons. In addition, the peak profile is quite symmetric, con-trary to normal exciton peaks, which have an asymmetric peak profile.
Instead of the exciton model, it seems more plausible to attribute the⬃2.2 eV peak to the intra-atomic d-d transition assisted by the SOC. Because the optical transition is basi-cally an electric dipole transition, the d-d transition is origi-nally orbital forbidden, considering its parity.38,39In addition,
the intra-atomic d-d transition in the Mn site is also spin forbidden, meaning that only transitions between states with the same spin are allowed. Given that Mn2+in MnWO
4has a high spin configuration with five d electrons in the same spin orientation, the transition to the opposite unoccupied spin state is normally impossible. However, the orbital selection rule could be partially broken due to the noninversion centric
position of the Mn ion within the crystal structure of MnWO4. In this case, parity is no longer a good quantum number, and the even and odd states can become partially mixed.39Moreover, the spin-forbidden nature of the d-d
tran-sition could be overcome by the SOC. Through SOC, the spin directions become mixed with each other, modifying the spin states.40 Although SOC in 3d orbitals is generally not
very strong, it can play an important role in multiferroic oxides such as RMnO3 or MnWO4. Indeed, in these multi-ferroic manganites with noncollinear spin structure, ferro-electricity may be understood through a microscopic model involving SOC.10Due to this SOC, the high spin
configura-tion is disturbed such that the intra-atomic d-d transiconfigura-tion be-comes possible with a disordered/noncollinear spin configu-ration. A similar observation of the⬃2.2 eV peak has been made by Nogami et al. and also by Ejima et al., where both of them also attributed the peak to the intra-atomic d-d tran-sition within the Mn2+ion.32–34
Attribution of the ⬃2.2 eV peak to the intra-atomic d-d transition provides a clue in explaining our temperature-dependent and magnetic field temperature-dependent results. In particular, focusing on the drastically decreased peak intensity at the AF2-AF1 transition temperature, we suggest that the forma-tion of a long-range commensurate collinear spin structure in the AF1 phase would suppress the SOC-allowed transition. Because the spin structure for the AF1 phase is an up-up-down-down type, the SOC-allowed optical transition peak intensity would be decreased due to the rigid spin directions. However, when a high magnetic field is applied or the
tem-FIG. 5. 共Color online兲 共a兲 Optical-absorption spectra of the ⬃2.2 eV peak structure at 300 K for each axis. Temperature depen-dence of the structure is also shown for共b兲 a-axis, 共c兲 b-axis, and 共d兲 c-axis responses.
FIG. 6. 共Color online兲 Magnetic field dependent optical-absorption spectra of the⬃2.2 eV peak structure of MnWO4共010兲
plane. The spectra are measured at共a兲 4 K, 共b兲 9 K, and 共c兲 15 K, which correspond to the AF2, AF1, and PM phases, respectively.
perature is raised, the collinear antiferromagnetic spin struc-ture would be destroyed so that SOC may play a role in restoring the⬃2.2 eV peak intensity to that observed for the higher-temperature phases. In addition, the increasing inten-sity of the ⬃2.2 eV peak in the order of a, c, to b axis suggests that the SOC negates the spin-forbidden nature of intra-atomic d-d transition most strongly for the configura-tion where the electric field of the light is applied in the spin direction.
The ⬃2.2 eV peak did not show a significant change across the AF2-AF3 and AF3-PM phase transitions. This suggests that macroscopic electric polarization is irrelevant to the ⬃2.2 eV peak structure. The distinction of the AF1-AF2 phase transition may be related to the observation that only this transition is of first order whereas the other transi-tions are of second order.14 The associated energy of the
AF1-AF2 phase transition may have an influence on the ⬃2.2 eV peak. On the other hand, our results may signify that the local AF3 phase is not actually collinear, in that the band-edge absorption peak intensity in AF3 is stronger than that in AF1. Although the averaged magnetic structure is collinear, as observed in the neutron-diffraction experiments,14the actual coupling of the spins to the photons
may occur on a much shorter time scale. IV. SUMMARY
We identified the electronic and IR phonon structures of single-crystal multiferroic MnWO4 by optical spectroscopy.
Two main peaks were observed above the band gap that could be attributed to charge-transfer transitions between the oxygen and transition-metal states. We identified 15 IR-active phonon modes predicted by the group-theoretical analyses. Although the total electronic structure was quite isotropic, the phonon structure showed a large anisotropy. Just below the fundamental band gap, we additionally ob-served a band-edge optical transition peak. From the polar-ization, temperature, and magnetic field dependent evolution of this peak, we could confirm that the peak represented an intra-atomic d-d transition between the Mn states in MnWO4. Our results suggest that the multiferroic oxide MnWO4 involves strong spin-orbit coupling that is respon-sible for the magnetoelectric coupling.
ACKNOWLEDGMENTS
The authors are grateful to J.-Y. Kim, R. P. Prasankumar, K. S. Burch, and J. W. Kim for valuable discussions. This research was supported by the Basic Science Research Pro-gram through the National Research Foundation of Korea 共NRF兲 共Grant No. 2009-0080567兲 and the National Honor Scientist Program, both funded by the Ministry of Education, Science and Technology 共MEST兲. The experiments at PLS were supported in part by MEST and POSTECH. A portion of this work was performed at the National High Magnetic Field Laboratory, which is supported by NSF Cooperative Agreement No. DMR-0084173, by the State of Florida, and by the DOE.
*Present address: Department of Physics, University of California, San Diego, La Jolla, CA 92093, USA.
†Present address: Materials Sciences and Technology Division, Oak
Ridge National Laboratory, Oak Ridge, TN 37831, USA.
1M. Fiebig,J. Phys. D 38, R123共2005兲.
2W. Eerenstein, N. D. Mathur, and J. F. Scott, Nature共London兲
442, 759共2006兲.
3K. F. Wang, J. M. Liu, and Z. F. Ren,Adv. Phys. 58, 321共2009兲. 4T. Kimura, T. Goto, H. Shintani, K. Ishizaka, T. Arima, and Y.
Tokura,Nature共London兲 426, 55 共2003兲.
5T. Arima, A. Tokunaga, T. Goto, H. Kimura, Y. Noda, and Y.
Tokura,Phys. Rev. Lett. 96, 097202共2006兲.
6G. Lawes, A. B. Harris, T. Kimura, N. Rogado, R. J. Cava, A.
Aharony, O. Entin-Wohlman, T. Yildirim, M. Kenzelmann, C. Broholm, and A. P. Ramirez, Phys. Rev. Lett. 95, 087205 共2005兲.
7Y. Yamasaki, S. Miyasaka, Y. Kaneko, J. P. He, T. Arima, and Y.
Tokura,Phys. Rev. Lett. 96, 207204共2006兲.
8S. Park, Y. J. Choi, C. L. Zhang, and S. W. Cheong,Phys. Rev.
Lett. 98, 057601共2007兲.
9K. Taniguchi, N. Abe, T. Takenobu, Y. Iwasa, and T. Arima,
Phys. Rev. Lett. 97, 097203共2006兲.
10H. Katsura, N. Nagaosa, and A. V. Balatsky,Phys. Rev. Lett. 95,
057205共2005兲.
11A. H. Arkenbout, T. T. M. Palstra, T. Siegrist, and T. Kimura,
Phys. Rev. B 74, 184431共2006兲.
12K. Taniguchi, N. Abe, H. Sagayama, S. Ohtani, T. Takenobu, Y.
Iwasa, and T. Arima,Phys. Rev. B 77, 064408共2008兲.
13L. H. Hoang, N. T. M. Hien, W. S. Choi, Y. S. Lee, K.
Tanigui-chi, T. Arima, S. Yoon, X. B. Chen, and In-Sang Yang, J. Raman Spectrosc.共to be published兲.
14G. Lautenschläger, H. Weitzel, T. Vogt, R. Hock, A. Boehm, M.
Bonnet, and H. Fuess,Phys. Rev. B 48, 6087共1993兲.
15H. Ehrenberg, H. Weitzel, H. Fuess, and B. Hennion,J. Phys.:
Condens. Matter 11, 2649共1999兲.
16B. Kundys, C. Simon, and C. Martin,Phys. Rev. B 77, 172402
共2008兲.
17K. Taniguchi, N. Abe, H. Umetsu, H. A. Katori, and T. Arima,
Phys. Rev. Lett. 101, 207205共2008兲.
18D. Meier, M. Maringer, T. Lottermoser, P. Becker, L. Bohaty,
and M. Fiebig,Phys. Rev. Lett. 102, 107202共2009兲.
19F. Ye, Y. Ren, J. A. Fernandez-Baca, H. A. Mook, J. W. Lynn, R.
P. Chaudhury, Y. Q. Wang, B. Lorenz, and C. W. Chu, Phys. Rev. B 78, 193101共2008兲.
20Y.-S. Song, J.-H. Chung, J. M. S. Park, and Y.-N. Choi, Phys.
Rev. B 79, 224415共2009兲.
21K. Taniguchi, N. Abe, S. Ohtani, and T. Arima,Phys. Rev. Lett.
102, 147201共2009兲.
22A. Pimenov, A. A. Mukhin, V. Y. Ivanov, V. D. Travkin, A. M.
Balbashov, and A. Loidl,Nat. Phys. 2, 97共2006兲.
23A. B. Sushkov, R. V. Aguilar, S. Park, S. W. Cheong, and H. D.
Drew,Phys. Rev. Lett. 98, 027202共2007兲.
24W. S. Choi, D. G. Kim, S. S. A. Seo, S. J. Moon, D. Lee, J. H.
Lee, H. S. Lee, D.-Y. Cho, Y. S. Lee, P. Murugavel, J. Yu, and T. W. Noh,Phys. Rev. B 77, 045137共2008兲.
25W. S. Choi, S. J. Moon, S. S. A. Seo, D. Lee, J. H. Lee, P.
Murugavel, T. W. Noh, and Y. S. Lee,Phys. Rev. B 78, 054440 共2008兲.
26S. J. Moon, H. Jin, K. W. Kim, W. S. Choi, Y. S. Lee, J. Yu, G.
Cao, A. Sumi, H. Funakubo, C. Bernhard, and T. W. Noh,Phys. Rev. Lett. 101, 226402共2008兲.
27T. W. Noh, P. H. Song, S.-I. Lee, D. C. Harris, J. R. Gaines, and
J. C. Garland,Phys. Rev. B 46, 4212共1992兲.
28S. J. Kim, S. S. A. Seo, S. J. Moon, W. S. Choi, N. H. Hur, Y. K.
Seo, and Y. S. Lee,J. Korean Phys. Soc. 51, 161共2007兲.
29H. J. Lee, J. H. Jung, Y. S. Lee, J. S. Ahn, T. W. Noh, K. H. Kim,
and S. W. Cheong,Phys. Rev. B 60, 5251共1999兲.
30Using the complex dielectric constants obtained from ITMM in
the transparent photon-energy region, we calculated a modified R共兲 which should be measured for a thick sample where trans-mittance is negligible. The modified R共兲 was used for the KK analyses.
31M. N. Iliev, M. M. Gospodinov, and A. P. Litvinchuk,Phys. Rev.
B 80, 212302共2009兲.
32A. Nogami, T. Suzuki, and T. Katsufuji, J. Phys. Soc. Jpn. 77,
115001共2008兲.
33T. Ejima, T. Banse, H. Takatsuka, Y. Kondo, M. Ishino, N.
Kimura, M. Watanabe, and I. Matsubara,J. Lumin. 119-120, 59 共2006兲.
34K. Taniguichi, M. Saito, and T. Arima,Phys. Rev. B 81, 064406
共2010兲.
35W. S. Choi, S. J. Moon, B. C. Jeon,J. H. Lee, and Y. S. Lee,J.
Korean Phys. Soc. 55, 754共2009兲.
36Previously, the magnetoelectric phase diagram of MnWO 4 for
H储c was reported from electric and structural property measure-ments 共Ref. 12兲. It showed a transition at around 4 T at low
temperature. However, our optical data do not show any change at⬃4 T, again suggesting that the electric property is irrelevant to the⬃2.2 eV peak. Because other relevant data on MnWO4
up to ⬃17 T are absent, we cannot assign the origin of the ⬃17 T phase transition at this moment.
37S. Nakajima, Y. Toyozawa, and R. Abe, The Physics of
Elemen-tary Excitations共Springer, Berlin, 1980兲.
38J. S. Lee, M. W. Kim, and T. W. Noh, New J. Phys. 7, 147
共2005兲.
39R. Rückamp, E. Benckiser, M. W. Haverkort, H. Roth, T.
Lo-renz, A. Freimuth, L. Jongen, A. Möller, G. Meyer, P. Reutler, B. Büchner, A. Revcolevschi, S.-W. Cheong, C. Sekar, G. Krab-bes, and M. Grüninger,New J. Phys. 7, 144共2005兲.
40J. Stöehr and H. C. Siegmann, Magnetism 共Springer, Berlin,