저작자표시-비영리-변경금지 2.0 대한민국 이용자는 아래의 조건을 따르는 경우에 한하여 자유롭게 l 이 저작물을 복제, 배포, 전송, 전시, 공연 및 방송할 수 있습니다. 다음과 같은 조건을 따라야 합니다: l 귀하는, 이 저작물의 재이용이나 배포의 경우, 이 저작물에 적용된 이용허락조건 을 명확하게 나타내어야 합니다. l 저작권자로부터 별도의 허가를 받으면 이러한 조건들은 적용되지 않습니다. 저작권법에 따른 이용자의 권리는 위의 내용에 의하여 영향을 받지 않습니다. 이것은 이용허락규약(Legal Code)을 이해하기 쉽게 요약한 것입니다. Disclaimer 저작자표시. 귀하는 원저작자를 표시하여야 합니다. 비영리. 귀하는 이 저작물을 영리 목적으로 이용할 수 없습니다. 변경금지. 귀하는 이 저작물을 개작, 변형 또는 가공할 수 없습니다.
Role of interleukin-17 production of
fatty acid binding protein 5-expressing
CD4+ T cells in atopic dermatitis
showing systemic involvement
Jungsoo Lee
Department of Medicine
Role of interleukin-17 production of
fatty acid binding protein 5-expressing
CD4+ T cells in atopic dermatitis
showing systemic involvement
Directed by Professor Kwang Hoon Lee
Doctoral Dissertation
submitted to the Department of Medicine
the Graduate School of Yonsei University
in partial fulfillment of the requirements for the degree
of Doctor of Philosophy
Jungsoo Lee
This certifies that the Doctoral
Dissertation of Jungsoo Lee is approved.
---
Thesis Supervisor : Kwang Hoon Lee
---
Thesis Committee Member#1 : In-Hong Choi
---
Thesis Committee Member#2 : Min-Geol Lee
---
Thesis Committee Member#3 : Jung-Won Park
---
Thesis Committee Member#4 : Jin Young Kim
The Graduate School
Yonsei University
ACKNOWLEDGEMENTS
First of all, I would like to show my deepest gratitude to my supervisor, Professor Kwang Hoon Lee, M.D., Ph.D. for the full support and genuinely excellent guidance in order to successively finish my doctoral degree. He has been the one who inspired me the most as a dermatology researcher at all times and without his persistent help, this dissertation would not have been possible. I would also like to thank my committee chair, Professor In-Hong Choi and committee members, Professor Min-Geol Lee, Professor Jung-Won Park and Doctor Jin Young Kim. Their valuable advices on my dissertation by sparing enormous precious time conveyed strength to my research.
In addition, I would like to express my appreciation to Professor Chang Ook Park for giving me the great scientific ideas and detailed academic advices. I am also grateful to my laboratory colleagues; Doctor Ji Yeon Noh for giving a major help to choose the target protein, Ji Hye Kim, Hyeran Kim, Seo Hyeong Kim, and Bo-Mi Kim for their time and efforts to help me with my experiments. For the continuous encouragement and advices, I would like to thank Professor Jung U Shin and my resident colleagues Hong Sun Jang and Min Ju Choi. Also, thank you so much for your help, Howard Chu. And I’m truly thankful to Professor Lars E. French, who is a Chairman of Department of Dermatology, Zurich University Hospital, for the warm support and providing motivations to keep up my scientific work.
I am sending a special thanks to my dearest family; father and mother, you were always there for me throughout my entire life, supporting me with infinite love and sacrifice. Paul, you are the best and I truly, deeply love you with all of my heart. And my adorable daughter Yegyo, I love you so much! Not only as my precious family, but also as a great medical doctor and an admirable leader, a former Speaker of the National Assembly, I sincerely respect you Ui Hwa Chung, my father-in-law. Thank you for your warm-hearted support and love, my mother-in-law. Love you sister! You’ve always been brighter than me.
And last but not least, I thank God from the beginning till the end, for giving me a fundamental strength and courage to go on and for everything he has done for me. I dedicate my dissertation to you.
<TABLE OF CONTENTS>
ABSTRACT ··· 1
I. INTRODUCTION ··· 3
II. MATERIALS AND METHODS ··· 7
1. Blood samples ··· 7
2. Experimental animals ··· 7
3. Development of SAD model in NC/Nga mice ··· 7
4. Flow cytometric analysis··· 9
5. Measurement of immunoglobulins, and cytokines in sera by
enzyme-linked immunosorbent assay (ELISA) ··· 9
6. Quantitative real-time PCR analysis ··· 9
7. Microarray analysis ··· 10
8. Tissue preparation and immunofluorescence staining ··· 11
9. Statistical analysis ··· 11
III. RESULTS ··· 12
1. Expression of IL-17 in NL, PAD and SAD mouse model ··· 12
2. The RNA microarray result reveals up-regulation of IL-17 cytokine
family and fatty acid binding protein (FABP) 5 in human SAD skin
··· 14
3. Confirmation of FABP4/5 expression in SAD mouse skin and
visualization of FABP4/5 in human SAD skin ··· 17
4. Visualization of FABP4/5 in mouse SAD lung tissue ··· 20
5. Demonstrations of CD4+ CD69+ FABP4/5+ T
RM(tissue-resident
memory T) cells and CD4+ IL-17+ FABP4/5+ T cells in the human
SAD skin by using triple immunofluorescence staining ··· 23
IV. DISCUSSION ··· 31
V. CONCLUSION ··· 36
REFERENCES ··· 37
LIST OF FIGURES
Figure 1. Development of PAD and SAD murine models using
NC/Nga mice ··· 8
Figure 2. Results of flow cytometry analysis of CD4+ T cells
and qRT-PCR of mouse models ··· 13
Figure 3. Overview of microarray data analysis using human NL,
SAD and PAD skin ··· 15
Figure 4. Microarray analysis of IL-17 and other cytokines
related to IL-17 inflammation in human skin ··· 16
Figure 5. Relative fold changes of FABP family in SAD ··· 16
Figure 6. qRT-PCR result displayed increased FABP5
expression in SAD mouse skin ··· 18
Figure 7. Immunofluorescence staining of FABP5 in NL, PAD
and SAD human skin ··· 19
Figure 8. Airway hyperresponsiveness examination by
methacholine challenge after establishing
OVA-induced asthma mouse model ··· 21
Figure 9. Increased FABP4 and FABP5 expression in lungs of
OVA-induced asthma model ··· 22
Figure 10. CD4+ CD69+ T
RMcells in the human SAD skin
expressed significant FABP4 and FABP5 ··· 24
Figure 11. CD4+ IL-17+ T cells in the human SAD skin
Figure 12. Images of 2D-Western blot to identify allergen
fractions in SAD and PAD ··· 27
Figure 13. Result of ELISA for IL-4 after the co-culture of
dendritic cells and CD4+ T cells ··· 28
Figure 14. The ELISA result of Der f 1-specific IgE level from
NL, PAD and SAD group using human blood samples
··· 29
Figure 15. FABP5 expression in T cells under Der f 1, Der f 14
and whole Der f extract treatment ··· 30
Figure 16. Possible role of Th17 immune responses of CD4+
FABP5+ T cells in the development of SAD ··· 35
LIST OF TABLE
Table 1. Comparisons of clinical and laboratory characteristics
between PAD and SAD patients ··· 5
1
ABSTRACT
Role of interleukin-17 production of fatty acid binding protein
5-expressing CD4+ T cells in atopic dermatitis showing systemic
involvement
Jungsoo Lee
Department of Medicine
The Graduate School, Yonsei University
(Directed by Professor Kwang Hoon Lee)
Evidences that support the recent increase of systemic atopic
dermatitis (SAD) patients related with other inflammatory conditions are
growing. The most definite is the so-called “atopic march (AM).” It is a
natural history of atopic manifestations, showing a sequence of
progression of clinical signs of atopic disease. But still, the mechanism
underlying the development of SAD is not fully understood and many
researchers are exploring to find the exact mechanism to explain the
pathogenesis of SAD including AM. Thus, to find a possible mechanism
of SAD, we designed a study in search of immune signatures and specific
biomarker for SAD.
We developed murine models of pure atopic dermatitis (PAD) by skin
sensitization only, and both skin and lung sensitization mimicking SAD
patients respectively by using NC/Nga mice. Then, we performed RNA
microarray,
quantitative
real-time
PCR
(qRT-PCR)
and
immunofluorescence staining using PAD and SAD human skin tissues
and T cells.
We found that SAD displayed higher IL-17 production in lung and
lymph nodes by flow cytometry analysis, which was further validated by
qRT-PCR using PAD and SAD skin. We focused on fatty acid binding
2
protein 5 (FABP5), which was significantly expressed in SAD human
skin in the RNA microarray analysis. We further confirmed the result in
mouse and human SAD skin compared with PAD skin using qRT-PCR
and confocal microscopy. Finally, we observed that CD4+ CD69+ T
RM(tissue-resident memory T) cells and CD4+ IL-17+ T cells in the human
SAD skin had expressed FABP4/5 significantly than those cells in PAD
skin.
Taken together, IL-17-mediated cutaneous inflammation of FABP5+
CD4+ T cells in SAD may explain the possible mechanism. Further study
will be necessary to see the function of FABP5 in SAD.
---
Key words: systemic atopic dermatitis, fatty acid binding protein 5, IL-17,
T
RMcells
3
Role of interleukin-17 production of fatty acid binding protein
5-expressing CD4+ T cells in atopic dermatitis showing systemic
involvement
Jungsoo Lee
Department of Medicine
The Graduate School, Yonsei University
(Directed by Professor Kwang Hoon Lee)
I. INTRODUCTION
Atopic dermatitis (AD) is a chronic, relapsing inflammatory skin disease with severe itching sensation, followed by disturbances of quality of life.1 There are many clinical evidences that support the idea of AD as a systemic disease. Descriptions of eye involvement2-3, gastrointestinal involvement4-5, renal involvement6-7 and autoimmune disease8-11 had been reported, but the most explicit evidence that had been illustrated was a phenomenon called ‘atopic march’.12
Atopy is defined as a familial or personal propensity to produce IgE antibodies, sensitization to inhalant and food allergens13,14 and underlying atopy has been considered to be critical in linking AD, allergic rhinitis and allergic asthma.15,16 In its classic description, AD composes only a part of the atopic complex which comprises beyond skin changes and usually combines with airway involvement including lung and nasal mucosa, which explains the progression from atopic eczema to respiratory allergic diseases such as allergic rhinitis and allergic asthma.15-17These conditionscan be unrelated disorders that sequentially develop along an atopic pathway or there might be a causal link between early eczematous skin lesion and the later-onset respiratory disorders. 17 However, the concept of the atopic march which represents AD as a systemic disease has been supported by cross-sectional and longitudinal studies.18-23 Currently, there are studies trying to explore the pathogenesis of systemic
4
atopic dermatitis (SAD), emphasizing the relationship between AD and onset of other respiratory allergic diseases; defective skin barrier during childhood eczema opens a way for epidermal water loss, and entry of high molecular weight allergens, bacteria, and viruses leads to eventual onset of airway hyperresponsiveness.24 In order to explain the proposed molecular mechanism for the epicutaneous sensitization that promotes AM which represents SAD, several studies have provided evidence that T cells are essential for inflammation and airway sensitivity25-27 and suggested that the epicutaneous entry of environmental allergens through barrier-disrupted skin inducing thymic stromal lymphopoietin (TSLP) expression is strongly associated with the induction of Type 2 helper T cells (Th2)-dominant immunologic responses followed by sensitized airways and airway inflammation.28-29
Pacciani V et al. characterized in vitro T-cell responses to group 2 major allergen of Dermatophagoides pteronyssinus (Der p 2), which was known to be one of the most potent allergens in AM.30 As a result, Der p 2 specific Th2 response showed significant correlation with both clinical and immunologic parameters in SAD group and higher levels of T-cell proliferation was observed in SAD group when compared with NL (normal) group.
While other studies were focused on Th2 responses in SAD, an experiment using allergic asthma mouse model was performed.31 Since genome-wide association study identified a significant association between a single nucleotide polymorphism in the IL-6 receptor gene in allergic asthma, the authors pitches into the IL-6 signaling pathway and related immunologic reactions. The experiment confirmed that allergen-induced IL-6 trans-signaling activated γδ T cells to promote Th2 and Th17 airway inflammation, offering additional information of Th17 response and its possible relationship with SAD.
Current genome-wide association study done by many researchers provided the relationship between IL-6 polymorphism and AD32 but IL-17 polymorphism was never reported. However, Th17 differentiation stimulated by IL-6 and other cytokines, and the production of a plethora of cytokines, including IL-17 regulate local and systemic inflammation with vasculitis had been well-illustrated.33
5
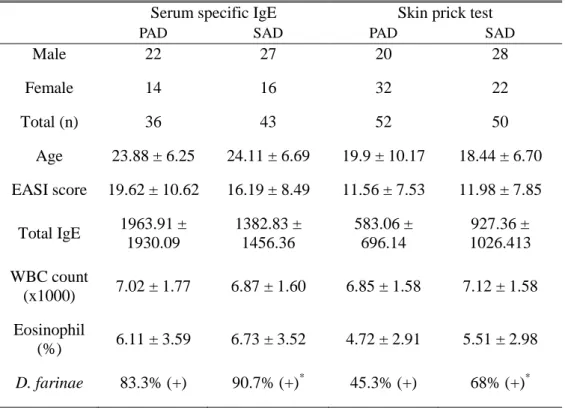
In our previous study, we observed phenotypes in SAD patients and pure AD (PAD) patients at a single point in time since the characterization of SAD patients who retain AD beyond childhood has not been fully explored before (Table 1).34 Comparison of skin lesion severity with Eczema Area and Severity Index, serum total IgE, and presence of family history between the two groups revealed no evident differences. There was no difference in the level of serum eosinophil as well. This finding displayed no remarkable phenotype difference between those two groups based on clinical characteristics. The only apparent difference between SAD patients to PAD patients was a presence of “greater” degree of sensitization to Dermatophagoides farinae (D. farinae).
Table 1. Comparisons of clinical and laboratory characteristics between PAD and SAD patients
Serum specific IgE Skin prick test
PAD SAD PAD SAD
Male 22 27 20 28 Female 14 16 32 22 Total (n) 36 43 52 50 Age 23.88 ± 6.25 24.11 ± 6.69 19.9 ± 10.17 18.44 ± 6.70 EASI score 19.62 ± 10.62 16.19 ± 8.49 11.56 ± 7.53 11.98 ± 7.85 Total IgE 1963.91 ± 1930.09 1382.83 ± 1456.36 583.06 ± 696.14 927.36 ± 1026.413 WBC count (x1000) 7.02 ± 1.77 6.87 ± 1.60 6.85 ± 1.58 7.12 ± 1.58 Eosinophil (%) 6.11 ± 3.59 6.73 ± 3.52 4.72 ± 2.91 5.51 ± 2.98 D. farinae 83.3% (+) 90.7% (+)* 45.3% (+) 68% (+)*
* p < 0.05 when compared with PAD group.
6
Overall, since there are only a few clues of immune responses in SAD and as an exact mechanism underlying the development of SAD still debatable, we determined to explore the immune signatures and biomarkers for SAD. In the present study, we investigated immunological mechanisms for SAD by using SAD NC/Nga mouse model and human skin.
7 II. MATERIALS AND METHODS 1. Blood samples
Peripheral blood monocytes from healthy donors, PAD and SAD patients were isolated using Ficoll-Hypaque technique.
2. Experimental animals
All animal procedures were approved by the Institutional Animal Care and Use Committee of Department of Laboratory Animal Resources, Yonsei Biomedical Research Institute, Yonsei University College of Medicine. Seventeen female NC/Nga mice (6 weeks old) were purchased from SLC Japan (Shizuoka, Japan). Mice were kept under controlled humidity (40%) and temperature (22±2°C) conditions. House dust mite (HDM) ointment was purchased from the Biostir Inc. (Kobe, Japan). One g of ointment contains 234 μg of group 1 major allergen of D.
farinae (Der f 1), 7 μg of Der f 2 and 134.4 mg of other proteins.
3. Development of SAD model in NC/Nga mice
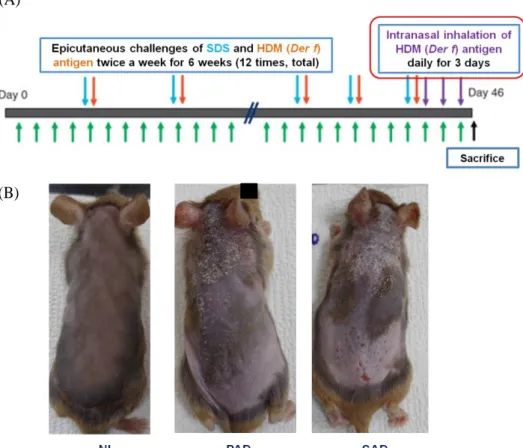
A total of seventeen NC/Nga mice was used in this experiment. Four mice were used as normal control, 5 mice were used to induce skin lesion only and 8 mice were used to develop the SAD model. On the first week, all of NC/Nga mice were anesthetized by intra-abdominal injection of zoletil (30-40 mg/kg) and the hair on their dorsal skin was shaved and completely removed by using hair removal cream and razors once a week. To induce skin inflammation, we applied 200 μl of 4% sodium dodecyl sulfate on PAD and SAD murine models’ back and posterior auricular area to disrupt the skin barrier. After 2 hours, 100 μg HDM ointment was applied. Epicutaneous challenges of SDS and HDM were done twice a week for 6 weeks (a total of 12 applications). During the last 3 days of the experiment, to induce SAD murine model, 100 μg of D. farinae antigen was given daily by intranasal inhalation (Fig. 1). Twenty-four hours after the last challenge, specimens of skin, blood, lymph nodes, spleen and lung were collected to evaluate the immune responses. Animal experiments were done with the approval of the Research Ethics Committee of Severance Hospital.
8
(A)
(B)
Figure 1. Development of PAD and SAD mouse models using NC/Nga mice.
(A) To induce skin inflammation in both PAD and SAD murine models, SDS was applied two hours prior to 100 μg HDM (D. fariane) antigen topical application in order to disrupt the skin barrier. Epicutaneous challenges of HDM antigen were done twice a week for 6 weeks. To develop SAD models with respiratory allergic inflammation, additional intranasal inhalations of the 100 μg HDM were done for the last 3 days of the experiment. (B) Clinical photographs of NL, PAD and SAD mouse model after 6 weeks of the challenge. Normal skin was observed in the NL group while PAD and SAD group displayed eczematous skin lesion with erosion and scales.
Abbreviations: NL, normal; PAD, pure atopic dermatitis; SAD, systemic atopic dermatitis; SDS, sodium dodecyl sulfate; HDM, house dust mite
9 4. Flow cytometric analysis
Cells were isolated from skin, lymph nodes, spleen and lung from murine models to prepare single cell suspensions from each tissue. For T cell activation, single cells were cultured in the anti-CD3 (eBioscience, Waltham, MA, USA) and anti-CD28 (eBioscience) coated plates. Next, cells were treated with Cell Stimulation Cocktail (plus protein transport inhibitors) (eBioscience) for 16 hours and then stained by using fixable viability dye for 30 min at 4℃. After washing, cells were labeled with anti-CD4 (eBioscience) and anti-CD-25 antibodies (eBioscience) conjugated with fluorescent dye (eBioscience). To perform intracellular labeling, cells were fixed and permeabilized with a cytofix/cytoperm buffer (eBioscience) and labeled with anti-mouse IL-4 (eBioscience), IL-10 (eBioscience), IL-17 (eBioscience), interferon-γ (IFN-γ) (eBioscience) and Foxp3 (eBioscience) conjugated with fluorescent dye. Labeled cell quantification was done by using a BD LSR FortessaTM flow cytometer. Flow Jo Software (BD Bioscience, San Jose, CA, USA) was used for data analysis.
5. Measurement of immunoglobulins, and cytokines in sera by enzyme-linked immunosorbent assay (ELISA)
Mouse sera were obtained from cardiac puncture. Immunoglobulin concentration was determined with a mouse IgE ELISA kit (BioLegend, San Diego, CA, USA) according to the manufacturer’s instructions. IL-4 (BioLegend) ELISA was done.
6. Quantitative real-time PCR analysis
Skin samples from mice were homogenized by using a Precellys 24 Homogenizer (Bertin Technologies, Montigny-le-Bretonneux, France). For the total RNA extraction, RNeasy Plus Mini kit (Qiagen, Hilden, Germany) was used following the manufacturer’s instructions and then subjected to a reverse transcription. At least two times of quantitative real-time PCR (qRT-PCR) were done for each sample using 2 μl of cDNA, supplemented with appropriate primers (Applied Biosystems, Foster City, CA, USA). Primers specific for mice -
10
IL-4 (Mm00445259_m1), IFN-γ (Mm01168134_m1), Foxp3 (Mm00475162_m1), IL-10 (Mm01288386_m1), IL-17a (Mm00439618_m1), FABP4 (Mm00445878_m1), FABP5 (Mm00783731_s1) and GAPDH (Mm99999915_g1) - were mixed with cDNA and qPCR master mix (Applied Biosystems) in 20 μl reaction. To perform qRT-PCR, StepOnePlus PCR system (Applied Biosystems) was used. The 2-ΔΔCT method was used to calculate
expression levels of mRNA. Additional qRT-PCR was done using D. farinae treated T cell for cDNA synthesis, 100 ng of total RNA was used and FABP5 primer (Qiagen) was supplemented for qRT-PCR.
7. Microarray analysis
All microarray analysis was performed at ProteomeTech Inc. in Yonsei University. RNA integrity and purity were evaluated by ND-1000 Spectrophotometer (NanoDrop, Wilmington, DE, USA), Agilent 2100 Bioanalyzer (Agilent Technologies, Palo Alto, CA, USA). Total RNA was amplified and purified by using TargetAmp-Nano Labeling Kit for Illumina Expression BeadChip (Epicentre, Madison, WI, USA) for biotinylated cRNA according to the manufacturer’s instructions. Four hundred ng of total RNA were reverse-transcribed using a T7-oligo (dT) promoter primer. After second-strand cDNA systhesis and purification, the cRNA quantification was done using the ND-1000 Spectrophotometer (NanoDrop). Seven hundred fifty ng of labeled cRNA samples were hybridized to each Human HT-12 v4.0 Expression Beadchip for 17 hours at 58°C, according to the manufacturer's instructions (Illumina, Inc., San Diego, CA, USA). Detection of array signal was performed using Amersham fluorolink streptavidin-Cy3 (GE Healthcare Bio-Sciences, Little Chalfont, UK) following the bead array-manual. Arrays were scanned with an Illumina bead array Reader confocal scanner according to the manufacturer's instructions. Raw data extraction was carried out using the software provided by the manufacturer (Illumina GenomeStudio v2011.1 (Gene Expression Module v1.9.0)). Array probes were transformed by the logarithm and normalized by quantile method. The statistical significance of the expression data was determined using fold
11
change.
8. Tissue preparation and immunofluorescence staining
Tissue samples were routinely fixed with formalin and processed to paraffin blocks. Six μm sections were cut, mounted on slides and dried, deparaffinized in xylene and ethanol. For antigen retrieval, slides were boiled for 20 min in 10 mM sodium citrate buffer (pH 6.0) and cooled for 30 min at room temperature. Overnight incubation of sections at 4ºC was performed for triple immunofluorescence with a mixture of primary antibodies in a humid chamber. Sections were rinsed for 10 min in PBS and incubated for 1 h at room temperature with a mixture of secondary antibodies in a humid chamber. Sections were mounted in VECTASHILED mounting media and images were acquired by laser scanning confocal microscopy (LSM 780; Zeiss, Oberkochen, Germany). The antibody lists are described as follows; Primary antibody lists; CD4: bs-0647R-A555 (Bioss, Alexa 555 conjugated, 1:100), FABP4: ab93945 (abcam, 1:200), FABP5: ab84028 (abcam, 5 ug/ml), Secondary antibody lists; Anti-mouse Alexa.633 (A21070, ThermoFisher scientific, Waltham, MA, USA, 1:500) for FABP4, Anti-rabbit Alexa.633 (A21126, ThermoFisher scientific, 1:500) for FABP5.
9. Statistical analysis
Statistical analysis was conducted using SPSS version 20 software (SPSS, Inc, Chicago, IL, USA). Statistical differences were considered to be significant at a value p < 0.05 and the correlation of nonparametric paired data was tested using Spearman’s rho, and the significance was evaluated using the t-tests and analysis of variance (ANOVA) statistics with Bonferroni’s multiple comparison test. Graphs were expressed as mean ± SEM using Prism software (Graphpad software, San Diego, CA, USA).
12 III. RESULTS
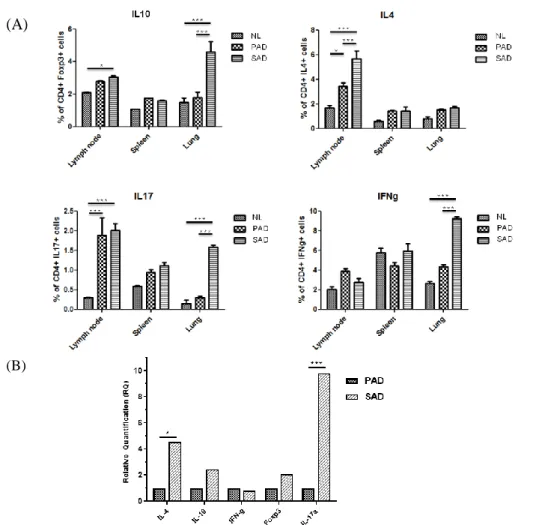
1. Expression of IL-17 in NL, PAD and SAD mouse model
The SAD group displayed statistically higher IL-17 in SAD mouse model by flow cytometry analysis, especially from lymph nodes and lung tissue. In spleen, even though the result was not significant, the same trend was observed. Similar results were observed for IL-4, but the result was only significant in lymph nodes (Fig. 2A). IL-10 expression was significant in lymph nodes and lung of SAD. For IFN-γ, the same result was only exhibited in the lung, with a marked expression in SAD. To extend these observations, further validation was performed by qRT-PCR using PAD and SAD skin (Fig. 2B). Pronounced gene expression of IL-17 in SAD skin than in PAD was confirmed with statistical significance, and IL-4 expression was also significantly increased by a lesser degree.
13
(A)
(B)
Figure 2. Results of flow cytometry analysis of CD4+ T cells and qRT-PCR of mouse models. (A) Flow cytometry analysis of lymph nodes, spleen, and lung
were performed. Higher expression of IL-17 in CD4+ T cells was detected from the SAD mouse model with statistical significance in lymph nodes and lung. IL-10, which has a function as a counterpart of IL-17 has demonstrated similar results in lymph nodes and lung. For IL-4, its expression was significant in the lymph nodes of SAD and IFN-γ expression was significant only in the lung of SAD. (B) Significantly higher level of IL-17A gene expression was exhibited by QRT-PCR of SAD mouse skin. Significant expression of IL-4 genes, with a lesser degree was also observed in SAD. *p < 0.05, ***p < 0.001.
Abbreviations: NL, normal; PAD, pure atopic dermatitis; SAD, systemic atopic dermatitis
14
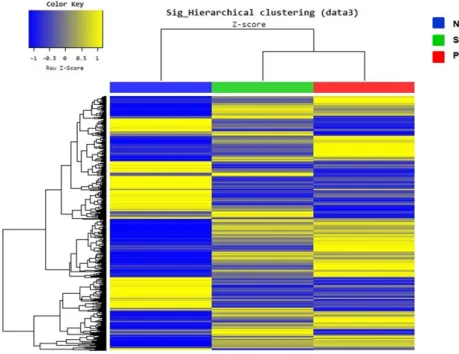
2. The RNA microarray result reveals up-regulation of IL-17 cytokine
family and fatty acid binding protein (FABP) 5 in human SAD skin
Microarray analysis using human samples exhibited distinguishable gene expression patterns in NL, SAD and PAD group (Fig. 3). Also, up regulation of IL-17 cytokine family, including IL-17a and IL-17f in SAD were demonstrated when compared with PAD and NL samples although statistical significance was not observed. Fold changes of IL-6, IL-21 and TGF-β1, which are related with IL-17 mediated inflammation, were also increased in SAD group (Fig. 4).
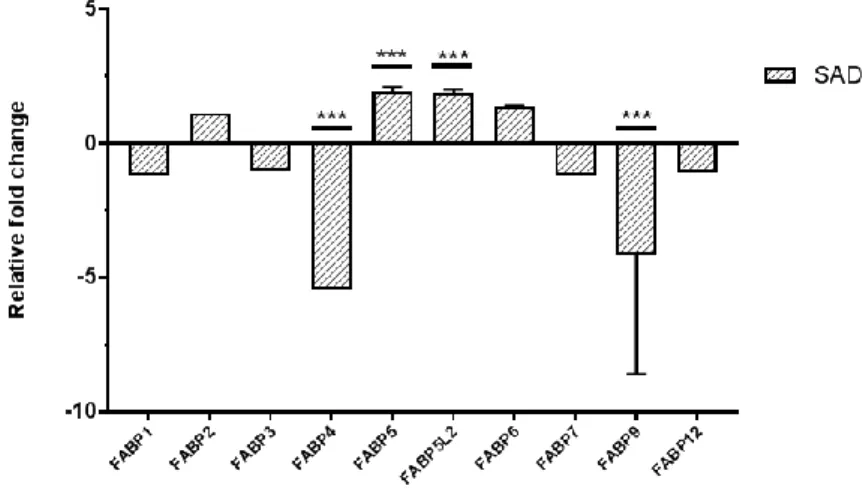
In search of a candidate biomarker protein, we selected the genes with significant fold changes. Among approximately 100 genes displaying at least two-fold up or down, as IL-17 was related to systemic inflammation in fat-rich environments, including skin, we screened for proteins involved in fatty acid metabolism and discovered a set of genes demonstrating significant fold changes. According to data analysis, fatty acid binding protein (FABP) family, including FABP5 and FABP5-like protein 2 (FABP5L2) showed significant fold increase and FABP4 and FABP9 displayed significant fold decrease (Fig. 5). Among these FABPs, FABP5 was selected as a candidate biomarker protein as it was an epidermal FABP, directly related to skin inflammation.
15
Figure 3. Overview of microarray data analysis using human NL, SAD and PAD skin. NL vs. SAD vs. PAD groups also exhibited distinct gene expression
patterns, even though the NL group showed the most distinctive features with the opposite color key when compared with other groups.
Abbreviations: NL, normal; PAD, pure atopic dermatitis; SAD, systemic atopic dermatitis
16
Figure 4. Microarray analysis of IL-17 and other cytokines related to IL-17 inflammation in human skin. Although statistical significances were not
observed, IL-17 cytokine family, including IL-17A, IL-17F and its receptor IL-17RC showed fold increase. IL-21R, IL-6 and TGF- β1 that are related to IL-17 inflammation also exhibited fold increase in the SAD human skin.
Abbreviations: PAD, pure atopic dermatitis; SAD, systemic atopic dermatitis
Figure 5. Relative fold changes of FABP family in SAD. According to the
human skin microarray analysis, FABP5 and FABP5L2 showed significant fold increase, whereas FABP4 and FABP9 exhibited significant fold decrease. FABP2 and FABP6 revealed relatively increased fold change and FABP1, while FABP1, FABP3, FABP7 and FABP12 displayed relatively decreased fold change. ***p < 0.001.
17
3. Confirmation of FABP4/5 expression in SAD mouse skin and visualization of FABP4/5 in human SAD skin
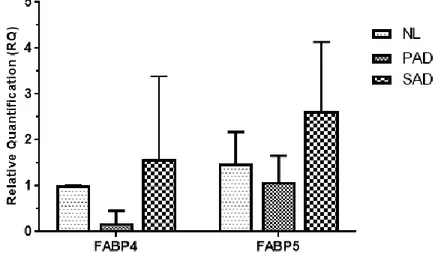
We performed qRT-PCR to see the gene expression of FABP4/5, as FABP4 and FABP5 share highly homologous sequence and structure with similar selectivity to fatty acids. As a result, higher expression of FABP5 was demonstrated in skin of SAD mouse, when compared to that of NL and PAD mouse models (Fig. 6). FABP4 was also increased in SAD mouse, but no statistical significance was observed when compared to the results of the NL and PAD mouse models.
In order to visualize the FABP expression in tissues, we used confocal microscopy to see FABP5 in human skin using immunofluorescence staining and confirmed a prominent FABP5 expression in SAD, while moderate FABP5 expression was seen in PAD skin, and minimal expression in NL skin (Fig. 7).
18
Figure 6. qRT-PCR result displayed increased FABP5 expression in the SAD mouse skin. As reported by qRT-PCR result to find the FABP4/5 expressions in
skin of NL, PAD and SAD mouse models, FABP5 was elevated in SAD skin when compared with NL and PAD group. FABP4 was also highly expressed in SAD skin relatively, but no statistical significance was observed in both FABPs. Abbreviations: NL, normal; PAD, pure atopic dermatitis; SAD, systemic atopic dermatitis; FABP, fatty acid binding protein
19
Group1
Group 2
Figure 7. Immunofluorescence staining of FABP5 in NL, PAD and SAD human skin. Two skin samples from each group were collected and FABP5 was
stained in green color. SAD skin samples revealed the most prominent FABP5 expression compared with NL and PAD samples. In PAD skin, moderate FABP5 expression was exhibited and NL skin displayed a minimal expression of FABP5. (x 200)
Abbreviations: FABP, fatty acid binding protein; NL, normal; PAD, pure atopic dermatitis; SAD, systemic atopic dermatitis
20
4. Visualization of FABP4/5 in mouse SAD lung tissue
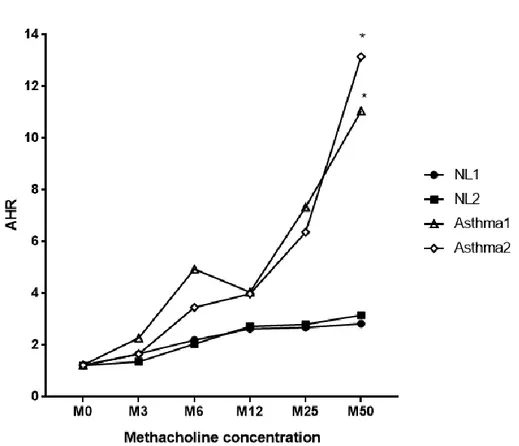
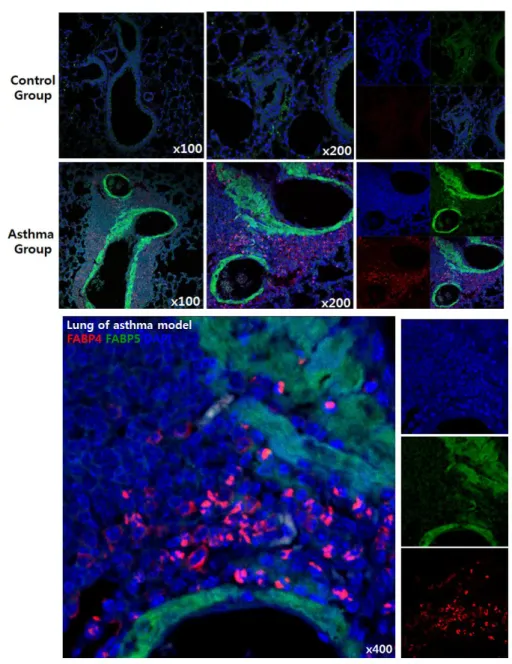
In order to investigate more evidences supporting the relationship between systemic inflammation and FABP expression, we obtained lung tissue from the OVA (ovalbumin) -induced asthma mouse model from a laboratory in Yonsei University College of Medicine, Institute of Allergy (Seoul, Korea) under Professor Jung-Won Park’s supervision. Airway hyperresponsivenss was evaluated by methacholine challenge, according to increased concentrations of methacholine and the results were compared between NL and allergic asthma group. As a result, AA models showed significant airway hyperresponsivenss change, especially at 50 mg/ml of methacholine concentration in contrast to NL mouse models, clearly suggesting an exaggerated airway hyperresponsivenss in allergic asthma group (Fig. 8). Confocal microscopy with immunofluorescence staining was also used to visualize FABP expressions in lung tissues, which confirmed increased FABP4/5 expressions in the lung tissues of allergic asthma model (Fig. 9). FABP5 was mostly observed in respiratory bronchiole lining cells and FABP4 was stained in cellular portion around alveoli.
21
Figure 8. AHR examination by methacholine challenge after establishing OVA-induced asthma mouse model. AHR changes according to methacholine
concentration were evaluated in both NL and allergic asthma groups. As a result, allergic asthma models showed a significant AHR change, especially at 50 mg/ml of methacholine concentration in contrast to NL mouse models. *p < 0.05 Abbreviations: AHR, airway hyperresponsiveness; NL, normal
22
Figure 9. Increased FABP4 and FABP5 expression in lungs of OVA-induced asthma model. Immunofluorescence staining results were obtained by confocal
microscopy (FABP4 in red and FABP5 in green, shown in x 100, x 200 and x 400). Note that FABP4 was mostly found in the cellular portion of lung tissue and FABP5 was observed in respiratory bronchiole lining cells.
23
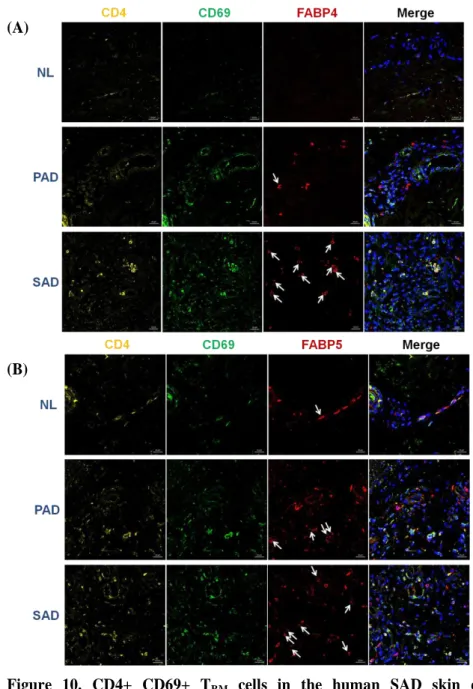
5. Demonstrations of CD4+ CD69+ FABP4/5+ positive TRM (tissue-resident memory T) cells and CD4+ IL-17+ FABP4/5+ T cells in the human SAD skin by using triple immunofluorescence staining
Additional triple immunofluorescence staining using human NL, PAD and SAD skin confirmed that CD4+ CD69+ TRM cells in the human SAD skin expressed
apparently significant FABP4/5 than in both NL and PAD skin (Fig. 10). Also, CD4+ IL-17+ T cells showed the same results, confirming the possible role of FABP4/5+ T cells expressing IL-17 in SAD (Fig. 11).
24 (A)
(B)
Figure 10. CD4+ CD69+ TRM cells in the human SAD skin expressed significant FABP4 and FABP5. CD4+ CD69+ TRM cells strongly expressing
FABP4 (A) and FABP5 (B) were noted in SAD skin when compared with PAD and NL skin. Co-localization of CD4+ (yellow), CD69+ (green) TRM cells with
FABP4/5 (red) expression were indicated by white arrows. (x 400)
Abbreviations: TRM, tissue-resident memory T; FABP, fatty acid binding protein;
25 (A)
(B)
Figure 11. CD4+ IL-17+ T cells in the human SAD skin expressed significant FABP4 and FABP5. CD4+ IL-17+ T cells strongly expressing FABP4 and
FABP5 were noted in SAD skin when compared with PAD and NL skin. Co-localization of CD4+ (red), IL-17+ (yellow) T cells with FABP4/5 (green) expression were indicated by white arrows. (x 400)
Abbreviations: SAD, systemic atopic dermatitis; FABP, fatty acid binding protein;
26
6. FABP5 expression after the treatment of Der f 1 in T cells
As mentioned previously, there was an apparent difference of D. farinae sensitization degree between SAD patients and PAD patients. And according to our previous study using 2D-western blot and ELISA, Der f 1 showed a specific relationship with SAD while Der f 14 displayed strong relationship with PAD (Fig. 12 to Fig. 14). So in the meantime, we carried out additional experiments to observe the expression of FABP5 induced by Der f 1 in SAD. The most significant FABP5 gene expression in T cells was confirmed in SAD by Der f 1 treatment (Fig. 15).
27 (A)
(B)
Figure 12. Images of 2D-Western blot to identify allergen fractions in SAD and PAD. (A) In SAD group, Der f 1 was the only detected allergen fraction
among various HDM allergen fractions. (B) In PAD group, three allergen fractions, including Der p 14, Der f 11, Der f 14 were identified.
Abbreviations: SAD, systemic atopic dermatitis; PAD, pure atopic dermatitis;
28
Figure 13. Result of ELISA for IL-4 after the co-culture of dendritic cells and CD4+ T cells. CD4+ T cells, pre-activated with IL-2, were co-culture with CD14+ PBMCs for 6 days at 37 ºC and then 10μg/ml of each D. farinae fractions, including Der f 1, Der f 2, Der f 6, Der f 11, Der f 14 were treated and incubated for 48 hours at the same temperature. IL-4 ELISA was done by using the supernatant. Among various responses, Der f 1-treated T cells from SAD expressed strong immune responses. A similar response was shown by the whole
D. farinae extract treatment. However, Der f 14 induced strongest immune
responses in T cells from PAD. ***p < 0.05.
Abbreviations: NL, normal; PAD, pure atopic dermatitis; SAD, systemic atopic dermatitis
29
Figure 14. The ELISA result of Der f 1-specific IgE level of NL, PAD and SAD group using human blood samples. To confirm the specific IgE
responses to Der f 1 in SAD, additional ELISA was done. Significant expression of Der f 1-specific IgE was observed in SAD when compared with both NL and PAD group. Also, the PAD group exhibited significant Der f 1-specific IgE in contrast to NL group. ***p < 0.05.
Abbreviations: NL, normal; PAD, pure atopic dermatitis; SAD, systemic atopic dermatitis
30
Figure 15. FABP5 expression in T cells under Der f 1, Der f 14 and whole D.
farinae extract treatment. Dendritic cells and CD4+ T cells from human NL,
PAD and SAD patients were co-cultured and D. farinae extracts including whole
D. farinae extract, Der f 1, Der f 14 were treated and incubated for 48 hours for
qRT-PCR. Der f 1 treated T cells from SAD expressed significant FABP5. In PAD group, Der f 14 treatments exhibited the most pronounced FABP5 expression. **p < 0.01, ***p < 0.001.
Abbreviations: NL, normal; PAD, pure atopic dermatitis; SAD, systemic atopic dermatitis; FABP, fatty acid binding protein
31 IV. DISCUSSION
While there are many supporting literatures verifying the idea of AD as a systemic disease, its pathomechanism is still unclear. Nonetheless, the possible role of IL-17 in SAD was previously reported.34 In the experiment, IL-4/IL-13 double knockout mice were used and after epicutaneous sensitization with OVA, systemic immune responses to OVA including skin and airway inflammation, and AHR were measured. While Th2-driven responses were impaired and absent, intact dermal CD4+ cells were observed and an exaggerated IL-17 response mediated airway inflammation and AHR, which were reversed by IL-17 blockade. The study confirmed that epicutaneous sensitization in the absence of Th2 induced an intensified Th17 response systemically after antigen challenge resulting airway inflammation and AHR.35
As shown in our experiments, the SAD mouse model exhibited a significant IL-17 elevation both in the skin and other systemic organs, including lymph nodes and lung when compared with PAD and NL group. IL-4 representing Th2 cytokine was also increased in the SAD group, but it was less prominent than IL-17 elevation and statistical significance was only observed in skin and lymph nodes. These results were consistent with the allergic asthma mouse model experiment described in introduction part11 and also shares common results with double knockout mice experiments which was mentioned above. Collectively, our result confirmed that not only Th2 but also Th17 immune responses take part in SAD.
RNA microarray analysis using human skin samples revealed similar results. There was a tendency toward fold increase of IL-17 family and Th17 pathway-related cytokines. By reviewing the approximately 100 genes with significant fold changes to find a candidate biomarker in SAD, we found a set of genes in relationship with fatty acid metabolism. Among these FABPs, FABP5 was chosen as a candidate protein.
FABP5 is also known as epidermal FABP (E-FABP) and psoriasis-associated FABP (PA-FABP).36 FABP5 is detected in the granular layer of normal skin, where lipid synthesis is active so as to establish skin barriers. FABP5 is also
32
enhanced and expanded in psoriatic skin with hyperproliferation, impaired lipid metabolism and abnormal differentiation.37 Besides, FABP5 null mice demonstrated barrier disruption and delayed wound healing due to impaired keratinocyte motility.38
FABP5 play roles in fatty acid uptake, transport and metabolism. Currently, FABP5 polymorphism only is known to be associated with type 2 diabetes mellitus. Nonetheless, there were several evidences supporting the relationship between FABP5 and AD. According to mass spectrometry study of AD skin, significant FABP5 expression was observed in acute and chronic AD lesion, minimal expression in non-lesional AD skin and no expression were founded by NL group.39 Also, FABP5 showed correlation with local severity of AD involved skin, which implied FABP5 as a new horny layer marker protein for evaluating skin conditions in AD.40
In our study, FABP5 was selected as a candidate protein for several reasons in combination with the features of FABP5 that are described above. First, skin provides lipid-rich but nutrient-poor microenvironments and permeability barrier function of cornified layers requires lipid component which is acting as ‘mortar.’ in the skin barrier system. Also, lipid spillover is known to be a main initiator of IL-17 proinflammatory reaction in adipose tissue41 which offers a possible relationship with Th17 pathway and fatty acid metabolism. According to current studies, the role of IL-17 is emphasized in the skin of psoriasis. It emerged as an IL-23/Th17-skewed disease and IL-17 promote keratinocytes proliferation and inflammatory responses. FABP5, which is a PA-FABP is highly expressed in psoriatic epidermis, suggesting the possible association with FABP5 and IL-17 immune responses.42 Furthermore, according to the previous study which our group had participated, Asian AD phenotype demonstrated not only well-known Th2 predominance immune responses but also exhibited psoriatic phenotype with increased Th17 polarization, higher induction of Th17-related cytokines and IL-17-induced markers according to RT-PCR.43 Extended experiments on SAD group were also performed before. One study analyzed sputum and nasal lavage from 4 groups: allergic rhinitis group, allergic rhinitis + allergic asthma group,
33
non- allergic rhinitis group and NL group. In allergic rhinitis + allergic asthma group, significant FABP5 expression was demonstrated and concluded that FABP5 might have contributed to airway remodeling and inflammation in allergic rhinitis + allergic asthma group.44
When we evaluated FABP5 expression by qRT-PCR, SAD mouse model skin revealed higher expression of FABP5 than PAD and NL skin. FABP5 immunofluorescence staining in human epidermis displayed none to minimal FABP5 expression in NL skin, moderate expression in PAD and prominent expression in SAD skin. To confirm the FABP5 expression in allergen-induced systemic inflammation, we used OVA-induced asthma mouse model. No FABP expression was shown in the control group and striking expressions of FABP4/5 were observed in asthma model.
The reason for FABP4/5 evaluation from the latter part of experiments is that current literatures had pointed out the similarities between those two genes; genes encoding FABP4 and FABP5 are closely related and they have highly homologous in sequence and structure, and bind to fatty acids with similar selectivity and affinity.45 Furthermore, in a recent study to confirm FABP expression in TRM cells
using OVA-expressing vaccinia virus infected mouse model, FABP4/5 expression was significantly increased in CD8+ TRM cells and FABP4/5 deficiency reduced
long-term survival of TRM cells in mouse skin, while having no effect on survival
of central memory T cells.46 These results were also observed in lung CD8+ TRM
cells with increased FABP4/5 expression after the intra-tracheal infection of OVA-expressing vaccinia virus, demonstrating the T-cell specific FABP4/5 expression after the airway inflammation. Enhanced extracellular free fatty acid uptake and increased FABP4/5 expression was conjointly shown in normal and psoriatic human CD8+ TRM cells in the skin.
In triple immunofluorescence staining using human skin, no CD4+ CD69+ FABP4+ TRM cells were shown in NL skin, only a few in PAD skin and significant
cells were observed in SAD skin. The same result was demonstrated with CD4+ CD69+ FABP5+ TRM cells. When we stained CD4+ IL-17+ FABP4+ T cells and
34
the relationship between SAD and FAPB5 expressing T cells showing Th17 differentiation. Since TRM cells play roles in tissue-specific inflammatory
disease,47 skin inflammation might have induced Th17 response in this experiment. The relationship between IL-17 and FABP5 had been previously reported. The literature explained that FABP5 expression in CD4+ T cells promoted Th17 cell differentiation.48 IL-6 and TGF-β combination are well-known to up-regulate IL-17 production49 and IL-6 is stimulated IL-21 induction and it sequentially induces retinoic acid-related orphan receptor (ROR) γt and RORα which in turn induces T cell expression of IL-17. However, impaired Th17 differentiation was demonstrated by FABP5-deficient CD4+ T cells under IL-6 stimulation, demonstrating the regulation of Th17 cell differentiation by FABP5.
Additional investigation using qRT-PCR in accordance with our preliminary study that Der f 1 was the only identified allergen fraction of the SAD group was done to confirm the FABP5 expression in T cells under Der f 1 treatment. The
SAD group exhibited the most notable Der f 1 specific IgE and FABP5 expression. However, in PAD group, Der f 14 treatment induced the most prominent FABP5
expression, displaying consistent result with our preliminary study.
According to current knowledge, pathomechanism to explain AD in immune dysregulation aspects provide Th2-skewed immune responses resulting in down- regulation of epidermal barrier protein expressions, modulating IgE class switching, supporting Th2 cell survival and exacerbating pruritus, while Th22 cells and IL-22 inhibits terminal differentiation and induces epidermal hyperplasia.50-52 Activated Th1 cells take a relatively partial role, especially in chronic AD. However, Th17 cells and IL-17 were thought to be less significant in AD.50
Nevertheless, based on our results, we assume that FABP5 expression in immature CD4+ T cells promote Th17 cell differentiation and IL-17 expression in SAD, whereas mainly Th2 cell differentiation and Th2-related cytokine expression takes place in PAD. All things considered, we illustrated a possible role of FABP5+ Th17 immune responses in the development of SAD (Fig. 16).
35
Figure 16. Possible role of Th17 immune responses of CD4+ FABP5+ T cells in the development of SAD. Genetic susceptibility, including mutations in barrier
proteins (e.g. filaggrin mutation) and environmental factors such as sensitization to allergens and infection induce Th2-skewed immune dysregulation and impaired skin barriers. Skin inflammation and eczematous lesion develop, and additional allergen entry through defective skin barrier and epicutaneous sensitization takes a place. Th2 memory cells are produced and such as Der f 14 allergen fraction re-entry exacerbates and maintains PAD. However, in SAD, Der f 1 re-entry through impaired barrier promotes Th17 differentiation and IL-17 production of CD4+ FABP5+ T cells, which in turn induces lung and airway inflammation, eventually leading to SAD development.
Abbreviations: SAD, systemic atopic dermatitis; AD, atopic dermatitis; AA, allergic asthma; AR, allergic rhinitis; PAD, pure atopic dermatitis; FABP, fatty acid binding protein
36 CONCLUSION
Taken together, IL-17-mediated cutaneous inflammation of CD4+ FABP5+ T cells in SAD may explain a possible pathomechanism of atopic dermatitis as a systemic disease. Further study will be necessary for evaluating the role of FABP5 in SAD.
37
REFERENCES
1. Boguniewicz M, Leung DY. Atopic dermatitis: a disease of altered skin barrier and immune dysregulation. Immunol Rev. 2011;242:233-46. 2. Bawazeer AM, Hodge WG, Lorimer B. Atopy and keratoconus: a
multivariate analysis. Br J Ophthalmol. 2000;84:834-6.
3. Bair B, Dodd J, Heidelberg K, Krach K. Cataracts in atopic dermatitis: a case presentation and review of the literature. Arch Dermatol. 2011;147:585-8.
4. Tzanakis NE, Tsiligianni IG, Siafakas NM. Pulmonary involvement and allergic disorders in inflammatory bowel disease. World J Gastroenterol. 2010;16:299-305.
5. Niwa Y, Sumi H, Akamatsu H. An association between ulcerative colitis and atopic dermatitis, diseases of impaired superficial barriers. J Invest Dermatol. 2004;123:999-1000.
6. Salsano ME, Graziano L, Luongo I, Pilla P, Giordano M, Lama G. Atopy in childhood idiopathic nephrotic syndrome. Acta Paediatr. 2007;96:561-6.
7. Yap HK, Yip WC, Lee BW, Ho TF, Teo J, Aw SE, et al. The incidence of atopy in steroid responsive nephrotic syndrome: clinical and immunological parameters. Ann Allergy. 1983;51:590-4.
8. Kokkonen J, Niinimaki A. Increased incidence of autoimmune disorders as a late complication in children with early onset dermatitis and/or milk allergy. J Autoimmun. 2004;22:341-4.
9. Pedulla M, Miraglia Del Giudice M, Fierro V, Arrigo T, Gitto E, et al. Atopy as a risk factor for thyroid autoimmunity in children. J Biol Regul Homeost Agents. 2012;26:S9-S14.
10. Rabin RL, Levinson AI. The nexus between atopic disease and autoimmunity: a review of the epidemiological and mechanistic literature. Clin Exp Immunol. 2008;153:19-30.
11. Mittermann I, Aichberger KJ, Bunder R, Mothes N, Renz H, Valenta R. Autoimmunity and atopic dermatitis. Curr Opin Allergy Clin Immunol. 2004;4:367-71.
12. Darlenski R, Kazandjieva J, Hristakieva E, Fluhr JW. Atopic dermatitis as a systemic disease. Clin Dermatol. 2014;32:409-13.
38
13. Johansson SG, Bieber T, Dahl R, Friedmann PS, Lanier BQ, Lockey RF, et al. Revised nomenclature for allergy for global use: Report of the Nomenclature Review Committee of the World Allergy Organization, October 2003. J Allergy Clin Immunol. 2004;113:832-6.
14. Plotz SG, Ring J. What's new in atopic eczema? Expert Opin Emerg Drugs. 2010;15:249-67.
15. Spergel JM, Paller AS. Atopic dermatitis and the atopic march. J Allergy Clin Immunol. 2003;112:S118-27.
16. Spergel JM. Atopic march: link to upper airways. Curr Opin Allergy Clin Immunol. 2005;5:17-21.
17. Bantz SK, Zhu Z, Zheng T. The atopic march: progression from atopic dermatitis to allergic rhinitis and asthma. J Clin Cell Immunol. 2014;5:202.
18. Guilbert TW, Morgan WJ, Zeiger RS, Bacharier LB, Boehmer SJ, Krawiec M, et al. Atopic characteristics of children with recurrent wheezing at high risk for the development of childhood asthma. J Allergy Clin Immunol. 2004;114:1282-7.
19. Kapoor R, Menon C, Hoffstad O, Bilker W, Leclerc P, margolis DJ. The prevalence of atopic triad in children with physician-confirmed atopic dermatitis. J Am Acad Dermatol. 2008;58:68-73.
20. Kulig M, Bergmann R, Klettke U, Wahn V, Tacke U, Wahn U. Natural course of sensitization to food and inhalant allergens during the first 6 years of life. J Allergy Clin Immunol. 1999;103:1173-9.
21. Martinez FD, Wright AL, Taussig LM, Holberg CJ, Halonen M, Morgan WJ. Asthma and wheezing in the first six years of life. The Group Health Medical Associates. N Engl J Med. 1995;332:133-8.
22. Ricci G, Patrizi A, Baldi E, Menna G, Tabanelli M, Masi M. Long-term follow-up of atopic dermatitis: retrospective analysis of related risk factors and association with concomitant allergic diseases. J Am Acad Dermatol. 2006;55:765-71.
23. van der Hulst AE, Klip H, Brand PL. Risk of developing asthma in young children with atopic eczema: a systematic review. J Allergy Clin Immunol. 2007;120:565-9.
39
24. Hogan MB, Peele K, Wilson NW. Skin barrier function and its importance at the start of the atopic march. J Allergy (Cairo) 2012;2012:901940.
25. Woodward AL, Spergel JM, Alenius H, Mizoguchi E, Bhan AK, Castigli E, et al. An obligate role for T-cell receptor alphabeta+ T cells but not T-cell receptor gammadelta+ T cells, B cells, or CD40/CD40L interactions in a mouse model of atopic dermatitis. J Allergy Clin Immunol 2001;107:359-66.
26. Herrick CA, MacLeod H, Glusac E, Tigelaar RE, Bottomly K. Th2 responses induced by epicutaneous or inhalational protein exposure are differentially dependent on IL-4. J Clin Invest 2000;105:765-75.
27. Herrick CA, Bottomly K. To respond or not to respond: T cells in allergic asthma. Nat Rev Immunol 2003;3:405-12.
28. Leyva-Castillo JM, Hener P, Jiang H, Li M. TSLP produced by keratinocytes promotes allergen sensitization through skin and thereby triggers atopic march in mice. J Invest Dermatol 2013;133:154-63. 29. Dharmage SC, Lowe AJ, Matheson MC, Burgess JA, Allen KJ,
Abramson MJ. Atopic dermatitis and the atopic march revisited. Allergy 2014;69:17-27.
30. Pacciani V, Corrente S, Gregori S, Pierantozzi A, Silenzi R, Chianca M, et al. Correlation of Der p 2 T-cell responses with clinical characteristics of children allergic to house dust mite. Ann Allergy Asthma Immunol. 2012;109:442-7.
31. Ullah MA, Revez JA, Loh Z, Simpson J, Zhang V, Bain L, et al. Allergen-induced IL-6 trans-signaling activates γδ T cells to promote type 2 and type 17 airway inflammation. J Allergy Clin Immunol. 2015;134:1065-73.
32. Bin L, Leung DY. Genetic and epigenetic studies of atopic dermatitis. Allergy Asthma Clin Immunol. 2016;12:52. eCollection 2016.
33. Weyand CM, Goronzy JJ. Immune mechanisms in medium and large-vessel vasculitis. Nat Rev Rheumatol. 2013;9:731-40.
34. Lee H, Shin JU, Lee J, Chu H, Lee KH. Characteristics of Atopic Dermatitis in a Post-childhood Atopic March Group. Korean J Dermatol. 2017;55:110-5.
40
35. He R, Kim HY, Yoon J, Oyoshi MK, MacGinnitie A, Goya S, et al. Exaggerated IL-17 response to epicutaneous sensitization mediates airway inflammation in the absence of IL-4 and IL-13. J Allergy Clin Immunol. 2009;124:761-70.
36. Furuhashi M, Hotamisligil GS. Fatty acid-binding proteins: role in metabolic diseases and potential as drug targets. Nat Rev Drug Discov. 2008;7:489-503.
37. Siegenthaler G, Hotz R, Chatellard-Gruaz D, Didierjean L, Hellman U, Saurat JH. Purification and characterization of the human epidermal fatty acid-binding protein: localization during epidermal cell differentiation in vivo and in vitro. Biochem J. 1994;302:363-71.
38. Owada Y, Takano H, Yamanaka H, Kobayashi H, Sugitani Y, Tomioka Y, et al. Altered water barrier function in epidermal-type fatty acid binding protein-deficient mice. J Invest Dermatol. 2002;118:430-5. 39. Broccardo CJ, Mahaffey SB, Strand M, Reisdorph NA, Leung DY.
Peeling off the layers: skin taping and a novel proteomics approach to study atopic dermatitis.J Allergy Clin Immunol. 2009;124:1113-5. 40. Yamane Y, Moriyama K, Yasuda C, Miyata S, Aihara M, Ikezawa Z, et
al. New horny layer marker proteins for evaluating skin condition in atopic dermatitis. Int Arch Allergy Immunol. 2009;150:89-101.
41. Mraz M, Haluzik M. The role of adipose tissue immune cells in obesity and low-grade inflammation.J Endocrinol. 2014;222:R113-27.
42. Dallaglio K, Marconi A, Truzzi F, Lotti R, Palazzo E, Petrachi T, et al. E-FABP induces differentiation in normal human keratinocytes and modulates the differentiation process in psoriatic keratinocytes in vitro. Exp Dermatol. 2013;22:255-61.
43. Noda S, Suárez-Fariñas M, Ungar B, Kim SJ, de Guzman Strong C, Xu H, et al. The Asian atopic dermatitis phenotype combines features of atopic dermatitis and psoriasis with increased TH17 polarization. J Allergy Clin Immunol. 2015;136:1254-64.
44. Suojalehto H, Kinaret P, Kilpeläinen M, Toskala E, Ahonen N, Wolff H, et al. Level of fatty acid binding protein 5 (FABP5) is increased in sputum of allergic asthmatics and links to airway remodeling and inflammation. PLoS One. 2015;10:e0127003.
41
45. Furuhashi M, Saitoh S, Shimamoto K, Miura T. Fatty Acid-Binding Protein 4 (FABP4): Pathophysiological insights and potent clinical biomarker of metabolic and cardiovascular diseases. Clin Med Insights Cardiol. 2015;8:23-33.
46. Pan Y, Tian T, Park CO, Lofftus SY, Mei S, Liu X, et al. Survival of tissue-resident memory T cells requires exogenous lipid uptake and metabolism. Nature. 2017;543:252-6.
47. Park CO, Kupper TS. The emerging role of resident memory T cells in protective immunity and inflammatory disease. Nat Med. 2015;21:688-97.
48. Li B, Reynolds JM, Stout RD, Bernlohr DA, Suttles J. Regulation of Th17 differentiation by epidermal fatty acid-binding protein. J Immunol. 2009;182:7625-33.
49. McGeachy MJ, Bak-Jensen KS, Chen Y, Tato CM, Blumenschein W, McClanahan T, et al. TGF-beta and IL-6 drive the production of IL-17 and IL-10 by T cells and restrain T(H)-17 cell-mediated pathology. Nat Immunol. 2007;8:1390-7.
50. Guttman-Yassky E, Dhingra N, Leung DY. New era of biologic therapeutics in atopic dermatitis. Expert Opin Biol Ther. 2013;13:549-61. 51. Wolf R, Wolf D. Abnormal epidermal barrier in the pathogenesis of
atopic dermatitis. Clin Dermatol. 2012;30:329-34.
52. Gittler JK, Shemer A, Suárez-Fariñas M, Fuentes-Duculan J, Gulewicz KJ, Wang CQ, et al. Progressive activation of T(H)2/T(H)22 cytokines and selective epidermal proteins characterizes acute and chronic atopic dermatitis. J Allergy Clin Immunol. 2012;130:1344-54.
42
ABSTRACT (IN KOREAN)
전신질환을 동반한 아토피피부염에서 fatty acid binding protein 5를
발현하는 CD4+ T 세포가 생성하는 interleukin-17의 역할
<지도교수 이 광 훈>
연세대학교 대학원 의학과
이 정 수
단순한 피부질환이 아닌, 전신 질환으로서의 아토피피부염을
설명하는 근거들이 증가하는 가운데 가장 명확한 증거로
‘아토피 행진’을 꼽을 수 있다. 이는 시간이 흐름에 따라
영유아기 피부 습진으로 시작하여 유소아기의 천식, 비염등의
호흡기 알레르기 증상을 보이는 순차적 이행을 보이는 현상을
의미한다. 그러나 현재까지 전신질환으로서의 아토피피부염의
기전에 대해 명확이 밝혀진 바가 없어 이를 규명하기 위해 전신
아토피피부염의 면역학적 특징과 생물학적 표지자를 찾기 위한
연구를 진행하였다.
먼저 NC/Nga 쥐를 이용하여, 집먼지 진드기의 반복적인 피부
감작을 통해 단순아토피피부염 모델을 유발하였으며, 추가적인
호흡기 감작을 이용한 전신아토피피부염 모델을 유발하였다.
이후 정상 대조군, 단순아토피피부염, 전신아토피피부염 쥐 모델
및
인간의
조직과
T
세포를
이용한
RNA
유전자미세배열(microarray) 분석법, 정량적 실시간 중합효소
연쇄반응 (qRT-PCR) 및 면역형광 염색을 시행하였다.
다양한 실험을 통해 단순아토피피부염과 전신아토피피부염
사이에 의미있는 면역학적 특징의 차이를 관찰할 수 있었는데,
먼저 전신아토피피부염 쥐 모델의 피부 및 다기관 조직에서
IL-17의 증가 소견이 뚜렷하게 나타났다. 또한 인간 피부를
43