R E S E A R C H
Open Access
Association between intake of B vitamins and
cognitive function in elderly Koreans with
cognitive impairment
Hyesook Kim
1, Ggotpin Kim
1, Won Jang
1, Seong Yoon Kim
2and Namsoo Chang
1*Abstract
Background: It is possible that blood B vitamins level and cognitive function may be affected by dietary intake of these vitamins, no study however has yet been conducted on relationships between B vitamins intake and cognitive function among elderly population in Korea. This study examined the relationship between B vitamins intake and cognitive function among elderly in South Korea.
Methods: Participants consisted of 100 adults with mild cognitive impairment (MCI), 100 with Alzheimer’s disease (AD), and 121 normal subjects. Dietary intake data that included the use of dietary supplements were obtained using a 24-hour recall method by well-trained interviewers. Plasma folate and vitamin B12 concentrations were analyzed by radioimmunoassay, and homocysteine (Hcy) was assessed by a high performance liquid chromatography-fluorescence method.
Results: Plasma levels of folate and vitamin B12 were positively correlated with B vitamins intake; and plasma Hcy was negatively correlated with total intake of vitamin B2, vitamin B6, vitamin B12 and folate. In the AD group, a multiple regression analysis after adjusting for covariates revealed positive relationships between vitamin B2 intake and test scores for the MMSE-KC, Boston Naming, Word Fluency, Word List Memory and Constructional Recall Tests; and between vitamin B6 intake and the MMSE-KC, Boston Naming, Word Fluency, Word List Memory, Word List Recognition, Constructional Recall and Constructional Praxis Tests. Positive associations were observed between vitamin B12 intake and the MMSE-KC, Boston Naming, Constructional Recall and Constructional Praxis Tests, and between folate intake and the Constructional Recall Test. In the MCI group, vitamin B2 intake was positively associated with the MMSE-KC and Boston Naming Test, vitamin B6 intake was positively associated with the Boston Naming Test, and folate intake was positively associated with the MMSE-KC and Word List Memory test. No associations were observed in the normal group.
Conclusion: These results suggested that total B vitamins intake is associated with cognitive function in cognitively impaired AD and MCI elderly, and the association is stronger in AD patients.
Keywords: B vitamins, Total intake, Cognitive function, Mild cognitive impairment, Alzheimer’s disease Background
A decline in cognitive function occurs as a normal part of the aging process [1]. However, a degree of cognitive impairment can be influenced by modifiable health behavior, including diet and nutrition [2]. B vitamins of folate, vitamin B2, vitamin B6 and vitamin B12 are involved in one-carbon transfer reactions such as
methylation, which is necessary for the production of monoamine neurotransmitters, phospholipids and nucleo-tides [3] in the brain. Low levels of these B vitamins have been associated with increased homocysteine (Hcy) [4], known to have a direct neurotoxic effect [5]. Several cross-sectional [6-9] and longitudinal studies [10-13] have proposed that elevated Hcy levels may be an independent risk factor for impaired cognitive function or Alzheimer’s disease (AD). In an elderly Korean population study, it has been reported that hyperhomocysteinemia may * Correspondence:[email protected]
1
Department of Nutritional Science and Food Management, Ewha Womans University, Seoul 120-750, Korea
Full list of author information is available at the end of the article
© 2014 Kim et al.; licensee BioMed Central. This is an Open Access article distributed under the terms of the Creative Commons Attribution License (http://creativecommons.org/licenses/by/4.0), which permits unrestricted use, distribution, and reproduction in any medium, provided the original work is properly credited. The Creative Commons Public Domain Dedication waiver (http://creativecommons.org/publicdomain/zero/1.0/) applies to the data made available in this article, unless otherwise stated.
Kim et al. Nutrition Journal 2014, 13:118 http://www.nutritionj.com/content/13/1/118
be a significant related risk factor for mild cognitive impairment (MCI) [14].
As in Western countries [15,16], several studies conducted in South Korea [17-19] have found relationships between the level of B vitamins in blood and cognitive function. In Korean elderly subjects, the serum folate level shows a significant positive correlation with MMSE-K [19]. The folate level in plasma and red blood cells was signifi-cantly correlated with test scores for several domains of cognitive function. Vitamin B1, vitamin B2, and vitamin B6 were positively correlated with neuropsychological function test scores, although not as strongly as folate [18].
Our previous study [20] showed that plasma folate, vitamin B12, and Hcy are associated with cognitive function in cognitively impaired (AD and MCI) elderly, and the association was stronger in patients with AD. A study in Australia investigated the relationship of serum B vitamins level and cognitive function, according to the degree of cognitive damage in AD, MCI and normal subjects [21]. However, these studies [20,21] did not contain dietary information.
The level of B vitamins in blood, especially folate, is affected by dietary intake [22,23]. Prospective [24] and case–control studies [25,26] have shown that low dietary intake of B vitamins was associated with cognitive decline [24] or an increased risk of AD [25,26]. However, null findings have been reported [27]. There is little or no data on the relationship between B vitamins intake and cognitive function among elderly population in Korea, where a folic acid fortification policy is not yet mandated.
South Korea has one of the most rapidly aging popula-tions in the world [28]. According to a 2012 Ministry of Health and Welfare report [29], it is estimated that 9.2% of elderly aged≥ 65 years have dementia and 27.8% have MCI. Given that the proportion of elderly with MCI and dementia in South Korea has drastically increased, more research on the correlation between B vitamins and cognitive function is needed.
This study investigated the relationship between B vitamins intake and cognitive function among normal, MCI, and AD groups in Korean elderly over 60 years of age.
Methods
Study participants and data collection
Study subjects aged≥ 60 years were recruited from April 2010 to June 2011 in the Songpa district, one of 25 districts in Seoul, South Korea. All participants completed the Korean version of the Consortium to Establish a Registry for Alzheimer’s Disease (CERAD-K) assessment packet, which consists of a neuropsychological and clinical assessment battery. A total of 321 subjects, including 121 normal subjects (37.7%), 100 MCI patients (31.2%) and 100 AD patients (31.2%) were included in the final analysis.
Comprehensive information is available in a previous study [20]. All subjects were interviewed by trained interviewers with caregivers present. The questionnaire was designed to obtain information on general characteristics, including age, gender, education, marital status, smoking status, and alcohol use. Disease prevalence was also investigated for vascular risk factors, including hypertension, diabetes mellitus, dyslipidemia, stroke, cardiovascular disease, and thyroid disease. Height and weight were measured,
and body mass index (BMI) (kg/m2) was calculated as
weight in kilograms divided by the square of the height in meters (kg/m2).
Dietary assessment
Dietary data were collected with a 24-hour recall for intake on the day before blood sampling. Experienced, well-trained dietary interviewers instructed respondents to describe all foods and beverages consumed over the past 24 hours. The most frequently eaten food items were set as models in a defined unit and shown to subjects to increase the accuracy of reporting. Household portions in each subject’s record were converted to mass weight (in grams). Dietary intake data were analyzed using the computer-aided nutritional analysis program software (CAN-Pro version 3.0; Nutritional Assessment Program, 2006, The Korean Nutrition Society, Seoul, Korea). Evidence-based vitamin B12 values from a book of Food Values [30] and a study in South Korea [31] were added to the Can-Pro 3.0 database.
Information on brand names and consumption frequency was collected from subjects ingesting dietary supplements. Daily nutrient intake from dietary supplements was calcu-lated using frequency and nutrient content of supplements. Dietary folate equivalent (DFE) was calculated based on 1.0 mg DFE = 1.0 mg of food folate or 0.6 mg of folic acid added to food [32]. Folate and other B vitamins intake data, including supplements, were compared with estimated average requirements (EARs) of Korean Dietary Reference Intakes (KDRI) [33].
Statistical analysis
Data are expressed as means with standard deviation. Values for plasma folate, vitamin B12 and Hcy, and nutrient intake, were log-transformed to satisfy assumptions of normality. To examine differences in nutrient intake among the three groups, a general linear model (GLM) procedure was performed after adjusting for age, gender, BMI, marital status, education, current smoking, energy intake, thyroid disease, and vascular risk factors such as hypertension, diabetes mellitus, dyslipidemia, stroke and cardiovascular disease. Possible confounding factors were considered on the association between B vitamins intake and cognitive function; Variables 1) which were significantly different among diagnostic groups, and previously reported
Kim et al. Nutrition Journal 2014, 13:118 Page 2 of 11
to have a relationship with AD (age, gender, marital status, education and current smoking), 2) which had no significant difference among diagnostic groups in the present study, nevertheless, previous studies reported to have a relationship with AD {thyroid disease and vascular risk factors (whether or not a given subject had 1≥ of diseases, including hypertension, diabetes mellitus, dyslipidemia, stroke and cardiovascular disease)}, and 3) which affect nutrient intake from diet {BMI, energy intake (ln)} were adjusted as covariates. Pearson’s correlation test was used to analyze correlations between nutrient intake and plasma folate, vitamin B12 and Hcy levels by group. Multiple linear regression analyses were used to examine the relationship between nutrient intake and cognitive function scores by group after adjusting for confounders. A two-tailed p-value < 0.05 was considered significant. Statistical analyses were performed using SAS software version 9.3 (SAS Institute, Cary, NC, USA). Results
General characteristics and nutrient intakes
The general characteristics of participants are described in a previous study [20]. The mean age of subjects was 74.8 ± 7.2 years, and patients with AD were older than those without AD. Patients with AD were less educated, lived less often with a spouse, and comprised a higher
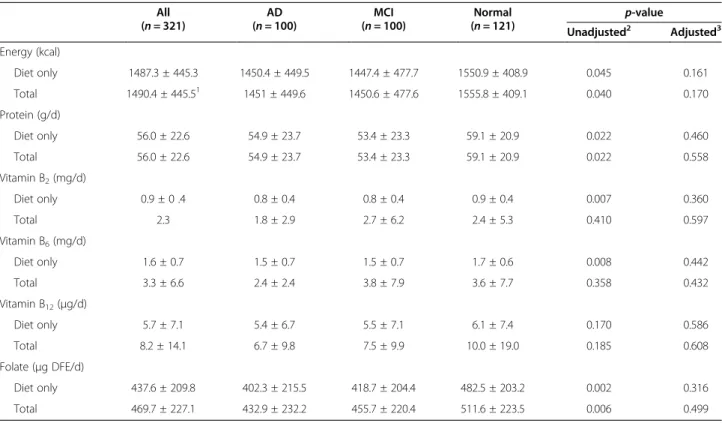
proportion of females than those without AD. The average dietary and total nutrient intake including supplements is presented in Table 1. The total energy intake of subjects was 1490.4 ± 445.5 kcal, which was 75.1% less than the estimated energy requirement (EER) for KDRI. Mean intake of total energy, protein and folic acid was signifi-cantly lower in MCI and AD groups compared to the nor-mal group. However, no significant difference in nutrient intake was found among all groups after adjustment for covariates of age, gender, BMI, marital status, education, current smoking, energy intake, thyroid disease, and vascular risk factors, such as hypertension, diabetes mellitus, dyslipidemia, stroke and cardiovascular disease.
Correlation between B vitamins intake and plasma concentrations of folate, vitamin B12, and Hcy
The plasma levels of folate, vitamin B12, and Hcy are reported in our previous study [20].
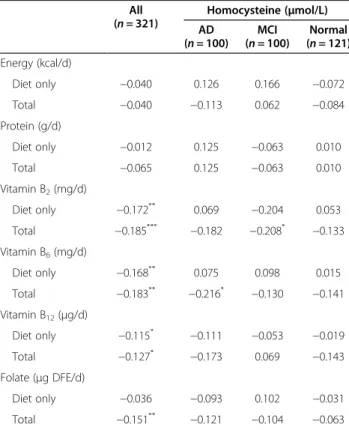
For total (all) subjects, after adjustment for covariates, plasma folate was positively correlated with total intake of protein (r = 0.141, p-value < 0.05), vitamin B2 (r = 0.276, p-value < 0.001), vitamin B6 (r = 0.279, p-value < 0.001) and folic acid (r = 0.339, p-value < 0.001). Plasma vitamin B12 was positively correlated with total vitamin B2 intake (r = 0.129, p-value < 0.05). Plasma Hcy was negatively correlated with total intake of vitamin B2
Table 1 Comparison of mean intake of each nutrient among AD, MCI and normal groups
All (n = 321) AD (n = 100) MCI (n = 100) Normal (n = 121) p-value Unadjusted2 Adjusted3 Energy (kcal) Diet only 1487.3 ± 445.3 1450.4 ± 449.5 1447.4 ± 477.7 1550.9 ± 408.9 0.045 0.161 Total 1490.4 ± 445.51 1451 ± 449.6 1450.6 ± 477.6 1555.8 ± 409.1 0.040 0.170 Protein (g/d) Diet only 56.0 ± 22.6 54.9 ± 23.7 53.4 ± 23.3 59.1 ± 20.9 0.022 0.460 Total 56.0 ± 22.6 54.9 ± 23.7 53.4 ± 23.3 59.1 ± 20.9 0.022 0.558 Vitamin B2(mg/d) Diet only 0.9 ± 0 .4 0.8 ± 0.4 0.8 ± 0.4 0.9 ± 0.4 0.007 0.360 Total 2.3 1.8 ± 2.9 2.7 ± 6.2 2.4 ± 5.3 0.410 0.597 Vitamin B6(mg/d) Diet only 1.6 ± 0.7 1.5 ± 0.7 1.5 ± 0.7 1.7 ± 0.6 0.008 0.442 Total 3.3 ± 6.6 2.4 ± 2.4 3.8 ± 7.9 3.6 ± 7.7 0.358 0.432 Vitamin B12(μg/d) Diet only 5.7 ± 7.1 5.4 ± 6.7 5.5 ± 7.1 6.1 ± 7.4 0.170 0.586 Total 8.2 ± 14.1 6.7 ± 9.8 7.5 ± 9.9 10.0 ± 19.0 0.185 0.608 Folate (μg DFE/d) Diet only 437.6 ± 209.8 402.3 ± 215.5 418.7 ± 204.4 482.5 ± 203.2 0.002 0.316 Total 469.7 ± 227.1 432.9 ± 232.2 455.7 ± 220.4 511.6 ± 223.5 0.006 0.499 1
Values are mean ± SD.
2
Analyzed by ANOVA after log transformed.
3
Analyzed by GLM at p < 0.05 after log transformed, adjusted for age, sex, BMI, marital status, education, current smoking, energy intake(ln), thyroid disease and vascular risk factors (hypertension, diabetes mellitus, dyslipidemia, stroke and cardiovascular disease) as covariates.
Kim et al. Nutrition Journal 2014, 13:118 Page 3 of 11
(r =−0.185, p-value < 0.001), vitamin B6 (r = −0.183, p-value < 0.01), vitamin B12 (r =−0.127, p-value < 0.05) and folic acid (r =−0.151, p-value < 0.01).
In the AD group, plasma folate was positively correlated with total folic acid intake only, and Hcy was negatively cor-related with total vitamin B6 intake. No significant correl-ation was found between plasma vitamin B12 and intake of any B vitamins. In the MCI group, plasma folate was posi-tively correlated with total intake of protein, vitamin B2, vitamin B6 and folic acid, similar to results for total subjects. Plasma vitamin B12 was positively correlated with total folic acid intake, and Hcy was negatively correlated with total vitamin B2 intake. In the normal group, plasma folate and vitamin B12 were positively correlated with total intake of protein, vitamin B2, vitamin B6 and folic acid, similar to results for total subjects. However, there was no correlation between plasma Hcy and B vitamins intake (Table 2).
Association between B vitamins intake and cognitive function
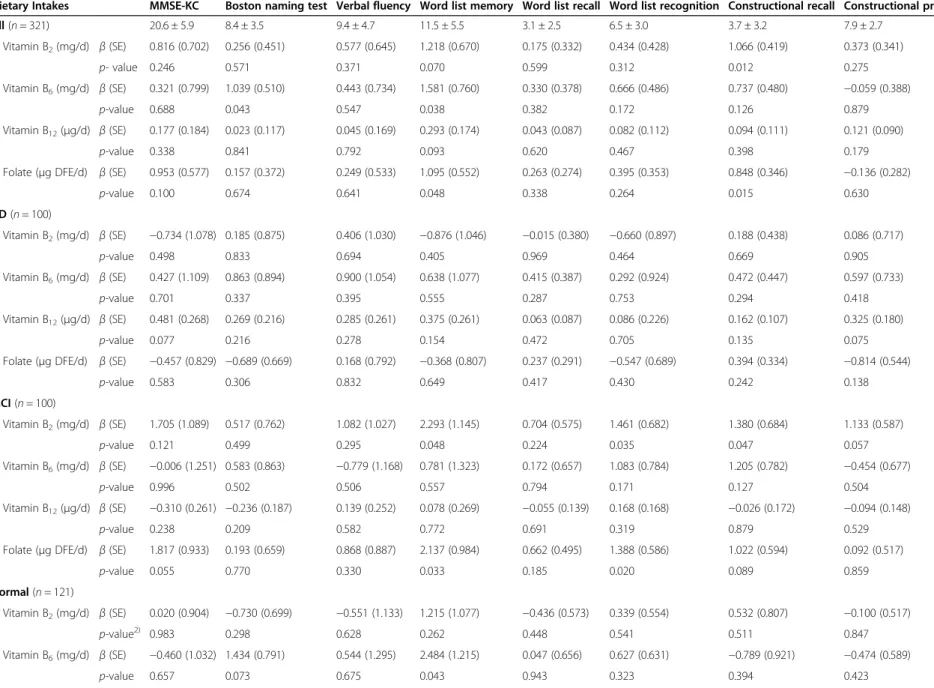
In total subjects, dietary vitamin B2 intake was positively associated with the Constructional Recall Test scores,
and dietary vitamin B6 intake was associated with the Boston Naming Test and Word List Memory Test scores. Folate intake was positively associated with the Word List Memory Test and Constructional Recall Test scores (Table 3).
In AD subjects, no association was observed between cognitive function scores and any dietary parameters. In MCI subjects, dietary vitamin B2 intake was positively associated with the Word List Memory, Word List Recognition and Constructional Recall Test scores; and dietary folate intake was positively associated with the Word List Memory and Word List Recognition Test scores. In normal subjects, dietary vitamin B6 intake was positively associated with the Word List Memory Test scores.
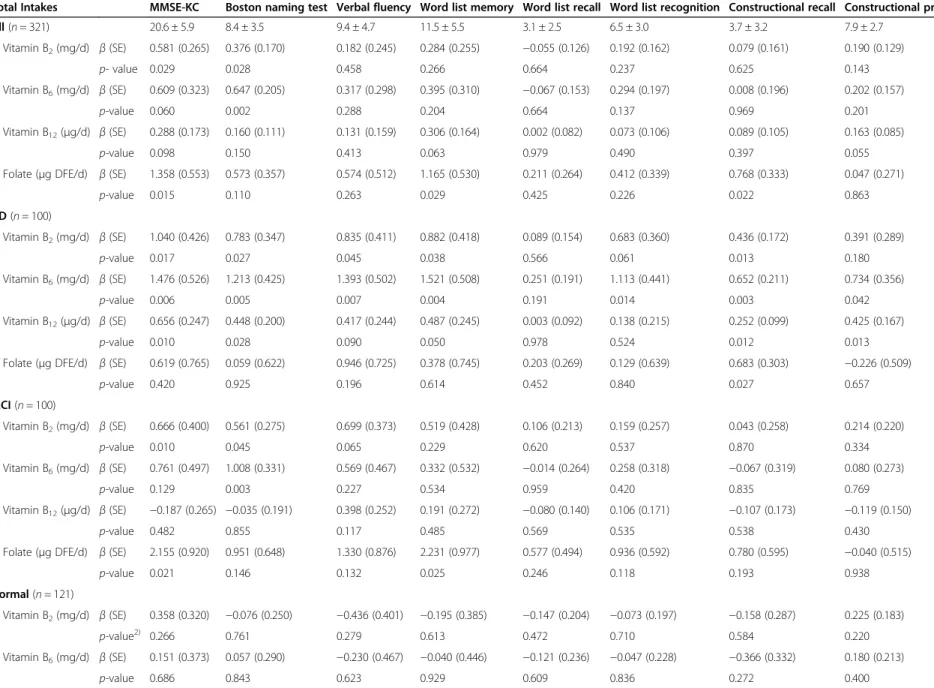
The association between total B vitamins intake and cognitive function scores in each group is presented in Table 4. In total subjects, total vitamin B2 intake was positively associated with the MMSE-KC and Boston Naming Test scores, and total vitamin B6 intake was associated with the Boston Naming Test scores. Folic acid intake was positively associated with the MMSE-KC, Word List Memory Test and Constructional Recall Test scores. In AD subjects, total vitamin B2 intake was positively associated with the MMSE-KC, Boston Naming Test, Word Fluency, Word List Memory Test and Constructional Recall Test scores; and total vitamin B6 intake was positively associated with the MMSE-KC, Boston Naming Test, Word Fluency, Word List Memory, Word List Recognition Test, Constructional Recall Test and Constructional Praxis Test scores. Total vitamin B12 intake was positively associated with the MMSE-KC, Boston Naming Test, Constructional Recall Test and Constructional Praxis Test scores; and total folic acid intake was positively associated with the Constructional Recall Test scores. In MCI subjects, total vitamin B2 intake was positively associated with the MMSE-KC and Boston Naming Test scores; and total vitamin B6 intake was positively associated with the Boston Naming Test scores. Total folic acid intake was positively associated with the MMSE-KC and Word List Memory Test scores. No association was observed between cognitive function scores and any dietary parameters in the normal group.
When we additionally adjusted for intakes of antioxidant
nutrient such as vitamin C, vitamin E and β-carotene,
the positive association between B vitamins intake and cognitive function still existed. A stronger association was shown in patients with AD compared to normal and MCI subjects. This suggests that the positive association between B vitamins intake and cognitive function in our study was not likely due to an increased B vitamins intake in these elderly whose antioxidant nutrient consumption was high compared with their counterparts (data not shown).
Table 2 Correlation coefficients between B vitamins intake and plasma homocysteine levels according to AD, MCI and normal groups
All (n = 321) Homocysteine (μmol/L) AD (n = 100) MCI (n = 100) Normal (n = 121) Energy (kcal/d) Diet only −0.040 0.126 0.166 −0.072 Total −0.040 −0.113 0.062 −0.084 Protein (g/d) Diet only −0.012 0.125 −0.063 0.010 Total −0.065 0.125 −0.063 0.010 Vitamin B2(mg/d) Diet only −0.172** 0.069 −0.204 0.053 Total −0.185*** −0.182 −0.208* −0.133 Vitamin B6(mg/d) Diet only −0.168** 0.075 0.098 0.015 Total −0.183** −0.216* −0.130 −0.141 Vitamin B12(μg/d) Diet only −0.115* −0.111 −0.053 −0.019 Total −0.127* −0.173 0.069 −0.143 Folate (μg DFE/d) Diet only −0.036 −0.093 0.102 −0.031 Total −0.151** −0.121 −0.104 −0.063
Data on intake and plasma level are log transformed. Adjusted for age, sex, BMI, marital status, education, current smoking, energy intake(ln), thyroid disease and vascular risk factors (hypertension, diabetes mellitus, dyslipidemia, stroke and cardiovascular disease) as covariates (*p < 0.05,
**p < 0.01, ***p < 0.001).
Kim et al. Nutrition Journal 2014, 13:118 Page 4 of 11
Table 3 Coefficients from multiple regression analysis between dietary B vitamins intake and neuropsychological test scores according to AD, MCI and normal groups
Dietary Intakes MMSE-KC Boston naming test Verbal fluency Word list memory Word list recall Word list recognition Constructional recall Constructional praxis All (n = 321) 20.6 ± 5.9 8.4 ± 3.5 9.4 ± 4.7 11.5 ± 5.5 3.1 ± 2.5 6.5 ± 3.0 3.7 ± 3.2 7.9 ± 2.7 Vitamin B2(mg/d) β (SE) 0.816 (0.702) 0.256 (0.451) 0.577 (0.645) 1.218 (0.670) 0.175 (0.332) 0.434 (0.428) 1.066 (0.419) 0.373 (0.341) p- value 0.246 0.571 0.371 0.070 0.599 0.312 0.012 0.275 Vitamin B6(mg/d) β (SE) 0.321 (0.799) 1.039 (0.510) 0.443 (0.734) 1.581 (0.760) 0.330 (0.378) 0.666 (0.486) 0.737 (0.480) −0.059 (0.388) p-value 0.688 0.043 0.547 0.038 0.382 0.172 0.126 0.879 Vitamin B12(μg/d) β (SE) 0.177 (0.184) 0.023 (0.117) 0.045 (0.169) 0.293 (0.174) 0.043 (0.087) 0.082 (0.112) 0.094 (0.111) 0.121 (0.090) p-value 0.338 0.841 0.792 0.093 0.620 0.467 0.398 0.179
Folate (μg DFE/d) β (SE) 0.953 (0.577) 0.157 (0.372) 0.249 (0.533) 1.095 (0.552) 0.263 (0.274) 0.395 (0.353) 0.848 (0.346) −0.136 (0.282)
p-value 0.100 0.674 0.641 0.048 0.338 0.264 0.015 0.630 AD (n = 100) Vitamin B2(mg/d) β (SE) −0.734 (1.078) 0.185 (0.875) 0.406 (1.030) −0.876 (1.046) −0.015 (0.380) −0.660 (0.897) 0.188 (0.438) 0.086 (0.717) p-value 0.498 0.833 0.694 0.405 0.969 0.464 0.669 0.905 Vitamin B6(mg/d) β (SE) 0.427 (1.109) 0.863 (0.894) 0.900 (1.054) 0.638 (1.077) 0.415 (0.387) 0.292 (0.924) 0.472 (0.447) 0.597 (0.733) p-value 0.701 0.337 0.395 0.555 0.287 0.753 0.294 0.418 Vitamin B12(μg/d) β (SE) 0.481 (0.268) 0.269 (0.216) 0.285 (0.261) 0.375 (0.261) 0.063 (0.087) 0.086 (0.226) 0.162 (0.107) 0.325 (0.180) p-value 0.077 0.216 0.278 0.154 0.472 0.705 0.135 0.075
Folate (μg DFE/d) β (SE) −0.457 (0.829) −0.689 (0.669) 0.168 (0.792) −0.368 (0.807) 0.237 (0.291) −0.547 (0.689) 0.394 (0.334) −0.814 (0.544)
p-value 0.583 0.306 0.832 0.649 0.417 0.430 0.242 0.138 MCI (n = 100) Vitamin B2(mg/d) β (SE) 1.705 (1.089) 0.517 (0.762) 1.082 (1.027) 2.293 (1.145) 0.704 (0.575) 1.461 (0.682) 1.380 (0.684) 1.133 (0.587) p-value 0.121 0.499 0.295 0.048 0.224 0.035 0.047 0.057 Vitamin B6(mg/d) β (SE) −0.006 (1.251) 0.583 (0.863) −0.779 (1.168) 0.781 (1.323) 0.172 (0.657) 1.083 (0.784) 1.205 (0.782) −0.454 (0.677) p-value 0.996 0.502 0.506 0.557 0.794 0.171 0.127 0.504 Vitamin B12(μg/d) β (SE) −0.310 (0.261) −0.236 (0.187) 0.139 (0.252) 0.078 (0.269) −0.055 (0.139) 0.168 (0.168) −0.026 (0.172) −0.094 (0.148) p-value 0.238 0.209 0.582 0.772 0.691 0.319 0.879 0.529
Folate (μg DFE/d) β (SE) 1.817 (0.933) 0.193 (0.659) 0.868 (0.887) 2.137 (0.984) 0.662 (0.495) 1.388 (0.586) 1.022 (0.594) 0.092 (0.517)
p-value 0.055 0.770 0.330 0.033 0.185 0.020 0.089 0.859 Normal (n = 121) Vitamin B2(mg/d) β (SE) 0.020 (0.904) −0.730 (0.699) −0.551 (1.133) 1.215 (1.077) −0.436 (0.573) 0.339 (0.554) 0.532 (0.807) −0.100 (0.517) p-value2) 0.983 0.298 0.628 0.262 0.448 0.541 0.511 0.847 Vitamin B6(mg/d) β (SE) −0.460 (1.032) 1.434 (0.791) 0.544 (1.295) 2.484 (1.215) 0.047 (0.656) 0.627 (0.631) −0.789 (0.921) −0.474 (0.589) p-value 0.657 0.073 0.675 0.043 0.943 0.323 0.394 0.423 Kim et al. Nutrition Journal 2014, 13 :118 Page 5 o f 1 1 http://ww w.nutritionj.co m/conten t/13/1/118
Table 3 Coefficients from multiple regression analysis between dietary B vitamins intake and neuropsychological test scores according to AD, MCI and normal groups (Continued)
Vitamin B12(μg/d) β (SE) 0.139 (0.259) −0.083 (0.194) −0.620 (0.316) 0.212 (0.309) 0.063 (0.163) −0.146 (0.156) 0.038 (0.230) 0.213 (0.145)
p-value 0.593 0.670 0.052 0.495 0.700 0.351 0.870 0.146
Folate (μg DFE/d) β (SE) 0.480 (0.741) 0.074 (0.576) −1.373 (0.922) 0.630 (0.887) −0.550 (0.468) −0.230 (0.455) 0.067 (0.664) 0.262 (0.424)
p-value 0.518 0.898 0.139 0.479 0.242 0.615 0.920 0.538
Data on intake and plasma level are log transformed. Adjusted for age, gender, BMI, marital status, education, current smoking, energy intake (ln), thyroid disease and vascular risk factors (hypertension, diabetes mellitus, dyslipidemia, stroke and cardiovascular disease).
Kim et al. Nutrition Journal 2014, 13 :118 Page 6 o f 1 1 http://ww w.nutritionj.co m/conten t/13/1/118
Table 4 Coefficients from multiple regression analysis between total B vitamins intake and neuropsychological test scores according to AD, MCI and normal groups
Total Intakes MMSE-KC Boston naming test Verbal fluency Word list memory Word list recall Word list recognition Constructional recall Constructional praxis All (n = 321) 20.6 ± 5.9 8.4 ± 3.5 9.4 ± 4.7 11.5 ± 5.5 3.1 ± 2.5 6.5 ± 3.0 3.7 ± 3.2 7.9 ± 2.7 Vitamin B2(mg/d) β (SE) 0.581 (0.265) 0.376 (0.170) 0.182 (0.245) 0.284 (0.255) −0.055 (0.126) 0.192 (0.162) 0.079 (0.161) 0.190 (0.129) p- value 0.029 0.028 0.458 0.266 0.664 0.237 0.625 0.143 Vitamin B6(mg/d) β (SE) 0.609 (0.323) 0.647 (0.205) 0.317 (0.298) 0.395 (0.310) −0.067 (0.153) 0.294 (0.197) 0.008 (0.196) 0.202 (0.157) p-value 0.060 0.002 0.288 0.204 0.664 0.137 0.969 0.201 Vitamin B12(μg/d) β (SE) 0.288 (0.173) 0.160 (0.111) 0.131 (0.159) 0.306 (0.164) 0.002 (0.082) 0.073 (0.106) 0.089 (0.105) 0.163 (0.085) p-value 0.098 0.150 0.413 0.063 0.979 0.490 0.397 0.055
Folate (μg DFE/d) β (SE) 1.358 (0.553) 0.573 (0.357) 0.574 (0.512) 1.165 (0.530) 0.211 (0.264) 0.412 (0.339) 0.768 (0.333) 0.047 (0.271)
p-value 0.015 0.110 0.263 0.029 0.425 0.226 0.022 0.863 AD (n = 100) Vitamin B2(mg/d) β (SE) 1.040 (0.426) 0.783 (0.347) 0.835 (0.411) 0.882 (0.418) 0.089 (0.154) 0.683 (0.360) 0.436 (0.172) 0.391 (0.289) p-value 0.017 0.027 0.045 0.038 0.566 0.061 0.013 0.180 Vitamin B6(mg/d) β (SE) 1.476 (0.526) 1.213 (0.425) 1.393 (0.502) 1.521 (0.508) 0.251 (0.191) 1.113 (0.441) 0.652 (0.211) 0.734 (0.356) p-value 0.006 0.005 0.007 0.004 0.191 0.014 0.003 0.042 Vitamin B12(μg/d) β (SE) 0.656 (0.247) 0.448 (0.200) 0.417 (0.244) 0.487 (0.245) 0.003 (0.092) 0.138 (0.215) 0.252 (0.099) 0.425 (0.167) p-value 0.010 0.028 0.090 0.050 0.978 0.524 0.012 0.013
Folate (μg DFE/d) β (SE) 0.619 (0.765) 0.059 (0.622) 0.946 (0.725) 0.378 (0.745) 0.203 (0.269) 0.129 (0.639) 0.683 (0.303) −0.226 (0.509)
p-value 0.420 0.925 0.196 0.614 0.452 0.840 0.027 0.657 MCI (n = 100) Vitamin B2(mg/d) β (SE) 0.666 (0.400) 0.561 (0.275) 0.699 (0.373) 0.519 (0.428) 0.106 (0.213) 0.159 (0.257) 0.043 (0.258) 0.214 (0.220) p-value 0.010 0.045 0.065 0.229 0.620 0.537 0.870 0.334 Vitamin B6(mg/d) β (SE) 0.761 (0.497) 1.008 (0.331) 0.569 (0.467) 0.332 (0.532) −0.014 (0.264) 0.258 (0.318) −0.067 (0.319) 0.080 (0.273) p-value 0.129 0.003 0.227 0.534 0.959 0.420 0.835 0.769 Vitamin B12(μg/d) β (SE) −0.187 (0.265) −0.035 (0.191) 0.398 (0.252) 0.191 (0.272) −0.080 (0.140) 0.106 (0.171) −0.107 (0.173) −0.119 (0.150) p-value 0.482 0.855 0.117 0.485 0.569 0.535 0.538 0.430
Folate (μg DFE/d) β (SE) 2.155 (0.920) 0.951 (0.648) 1.330 (0.876) 2.231 (0.977) 0.577 (0.494) 0.936 (0.592) 0.780 (0.595) −0.040 (0.515)
p-value 0.021 0.146 0.132 0.025 0.246 0.118 0.193 0.938 Normal (n = 121) Vitamin B2(mg/d) β (SE) 0.358 (0.320) −0.076 (0.250) −0.436 (0.401) −0.195 (0.385) −0.147 (0.204) −0.073 (0.197) −0.158 (0.287) 0.225 (0.183) p-value2) 0.266 0.761 0.279 0.613 0.472 0.710 0.584 0.220 Vitamin B6(mg/d) β (SE) 0.151 (0.373) 0.057 (0.290) −0.230 (0.467) −0.040 (0.446) −0.121 (0.236) −0.047 (0.228) −0.366 (0.332) 0.180 (0.213) p-value 0.686 0.843 0.623 0.929 0.609 0.836 0.272 0.400 Kim et al. Nutrition Journal 2014, 13 :118 Page 7 o f 1 1 http://ww w.nutritionj.co m/conten t/13/1/118
Table 4 Coefficients from multiple regression analysis between total B vitamins intake and neuropsychological test scores according to AD, MCI and normal groups (Continued)
Vitamin B12(μg/d) β (SE) 0.115 (0.224) −0.093 (0.168) −0.273 (0.270) −0.020 (0.268) −0.008 (0.141) −0.154 (0.134) −0.027 (0.199) 0.246 (0.125)
p-value 0.609 0.579 0.054 0.942 0.957 0.254 0.892 0.051
Folate (μg DFE/d) β (SE) 0.455 (0.585) 0.042 (0.561) −1.425 (0.895) 0.348 (0.864) −0.358 (0.457) −0.313 (0.441) 0.057 (0.646) 0.470 (0.410)
p-value 0.438 0.941 0.114 0.688 0.435 0.479 0.930 0.255
Data on intake are log transformed. Adjusted for age, gender, BMI, marital status, education, current smoking, energy intake (ln), thyroid disease and vascular risk factors (hypertension, diabetes mellitus, dyslipidemia, stroke and cardiovascular disease).
Kim et al. Nutrition Journal 2014, 13 :118 Page 8 o f 1 1 http://ww w.nutritionj.co m/conten t/13/1/118
Discussion
Dietary and total B vitamins intake was negatively correlated with plasma Hcy levels and positively associated with cognitive function scores, with different associations according to cognitive status. Positive associations between total B vitamins intake and cognitive function were observed for vitamin B2, vitamin B6, vitamin B12 and folic acid in the AD group, and for vitamin B2, vitamin B6 and folate in the MCI group. No association was observed between vitamin B intake and cognitive function in the normal group. Results are similar to our previous finding [20] that plasma folate, vitamin B12, and Hcy are associated with cognitive function in cognitively impaired (AD and MCI) elderly. A stronger association was shown in patients with AD compared to normal and MCI subjects and cannot be explained. Results indicated that plasma folate and vitamin B12 were associated with Hcy and cognitive function as reported by previous studies [7,9,15,20], and dietary intake of Hcy-lowering vitamins of vitamin B2, vitamin B6, vitamin B12 and folate was also related.
A negative correlation between plasma Hcy and B vitamins intake among elderly is supported by previous reports [34,35]. As vitamin B2, vitamin B6, vitamin B12 and folate are metabolically interrelated in one-carbon metabolism, it is not surprising that the intake of vitamin B2, vitamin B6, vitamin B12 and folate is inversely related to plasma Hcy. Hcy is a byproduct of a sulfur-containing amino acid methionine, which is formed from the universal methyl donor SAM during methylation of biomolecules and hydrolysis of S-adenosylhomocysteine to Hcy. The resulting Hcy is remethylated to methionine by methylene-tetrahydrofolate, generated in the one-carbon metabolism cycle where Hcy-lowering B vitamins are metabolically interrelated [36].
Plasma Hcy level was differed significantly among diagnostic groups; however, no differences in dietary intake of vitamin B2, vitamin B6, vitamin B12 and folate were observed among three groups. A U.K. study reported that the mean intake of folate, vitamin B6, and B12 did not differ significantly between normal and AD patients, but plasma Hcy levels were influenced by intake of these vitamins [37]. The Baltimore Longitudinal Study of Aging reported that folate intake at or above the recommended dietary allowance (RDA) is associated with a reduced risk of AD, but no association was found to vitamin B6 and B12 intake [26]. Other prospective studies found no relationship between the intake of other B vitamins and AD risk [27,38].
Cognitive function test scores were positively asso-ciated with intake of vitamin B2, vitamin B6, vitamin B12 and folate in the AD group; vitamin B2, vitamin B6 and folate in the MCI group; and none in the normal group.
To the best of our knowledge, no study had previously investigated an association between B vitamins intake and cognitive function in AD patients. Intervention studies reported that B vitamins supplementation {Folic acid (5 mg/day) and B12 (1 mg/day)} could improve cognitive performance, but only in mild to moderately demented AD patients with elevated Hcy levels at the baseline [39,40]. Aisen et al. [41] reported that in mild AD treat-ment with high-dose B vitamins suppletreat-ments {Folic acid (5 mg/day), B6 (25 mg/day) and B12 (1 mg/day)} did slow cognitive decline, whereas in moderate AD it did not.
In the MCI group, intake of vitamin B2, vitamin B6 and folate was positively associated with cognitive function test scores. There have been no reports on the relationship between B vitamins intake and cognitive function in MCI patients. However, a study in Korea inves-tigating associations with serum vitamin levels and cogni-tive function found a relationship between serum folate level and MMSE-K scores [19]. An intervention study on MCI subjects reported that B vitamins supplementation {folic acid (0.8 mg/day), B12 (0.5 mg/day), B6 (20 mg/day)} stabilized the executive function and improved global cognition, episodic and semantic memory, and global clinical dementia rating scores in patients with elevated baseline Hcy levels [42]. In contrast, another study found that supplementation did not improve cognitive function [43]. These negative results could be explained that the subjects were not stratified for baseline homocysteine.
In the normal group, no association was observed between B vitamins intake and cognitive function scores. This is in line with conflicting results of previous studies. A UK study [27] reported no association between B vitamins intake and cognitive function scores in normal elderly patients. In Korea, two studies reported a positive relationship between vitamin B2 intake and cognitive function scores including MMSE-K in normal Korean elderly subjects [44,45]. Studies demonstrated that supplementation with folic acid, B12, and B6 improved cognitive function such as immediate and delayed memory, information processing speed, and sensorimotor speed [46-48]; and vitamin B12 supplementation in elderly with cobalamin deficiency resulted in reduced motor function scores [49].
Results of this study showed that vitamin B6 intake was associated with the greatest number of cognitive function indicators. Daily intake of vitamin B6 was 1.6 ± 0.7 mg, and 33% of subjects consumed less than EAR for KDRI (data not shown). Seo et al. [50] reported that the average daily intake of vitamin B6 in Korean elderly residing in rural areas was 1.1 ± 0.7 mg (80.1% of RNI, Recommended Nutrient Intake), lower than our study. Chang et al. [51] reported that more than 70% of elderly people in rural Korea had inadequate functional vitamin B6 status, as measured by erythrocyte aspartate transaminase activity
Kim et al. Nutrition Journal 2014, 13:118 Page 9 of 11
coefficients. Therefore, significant measures to improve nutritional status in folate, vitamin B12, and vitamin B6 among Korean elderly must be considered, including the promotion of consuming a diet rich in folate and B vitamins.
This study had potential limitations, in addition to those presented in our previous study. First, our study was observational in nature and cannot prove causality. Although we attempted to control for the effects of the major identified predictors of cognitive function, B vitamins consumption could be a marker for unrecognised factors that affect cognitive function. Second, results may be difficult to interpret and apply to the general population, as a random sample was not utilized. Third, holotranscobala-mine, a better indicator of vitamin B12 status, was not measured; and serum vitamin B2 and B6 levels were not measured, only data on dietary intake. Despite limitations, and to the best of our knowledge, this is the first study investigating the relationship between cognitive function scores and dietary intake by cognitive status.
Conclusion
An association between B vitamins intake and cognitive function was stronger in cognitively impaired AD and MCI patients than in normal elderly in Korea. Further prospective studies are warranted to investigate causal relationships of cognitive function with nutritional status, including B vitamins intake.
Competing interests
All authors, H. Kim, G. Kim, W. Jang, S.Y. Kim, and N. Chang, declare that they have no competing interests.
Authors’ contributions
NC designed the research; HK, GK, WJ, and SYK conducted the research; HK and GK analyzed the data; HK and NC wrote the manuscript; and NC was primarily responsible for the final content. All the authors read and approved the final manuscript.
Acknowledgments
This study was supported by the Brain Korea 21 Plus. Author details
1Department of Nutritional Science and Food Management, Ewha Womans
University, Seoul 120-750, Korea.2Department of Psychiatry, Asan Medical Center, University of Ulsan, Medical College, Seoul 138-736, Korea. Received: 12 August 2014 Accepted: 12 December 2014 Published: 17 December 2014
References
1. Smith AD, Earles JL: Memory changes in normal aging. In Cognitive changes in adulthood and aging. Edited by Hess T, Blanchard Fields F. New York: McGraw Hill; 1996:192–220.
2. Ogawa S: Nutritional management of older adults with cognitive decline and dementia. Geriatr Gerontol Int 2014, 14(Suppl 2):17–22.
3. Ueland PM, Hustad S, Schneede J, Refsum H, Vollset SE: Biological and clinical implications of the MTHFR C677T polymorphism. Trends Pharmacol Sci 2001, 22:195–201.
4. Hutto BR: Folate and cobalamin in psychiatric illness. Compr Psychiatry 1997, 38:305–314.
5. Ho PI, Collins SC, Dhitavat S, Ortiz D, Ashline D, Rogers E, Shea TB: Homocysteine potentiates beta-amyloid neurotoxicity: role of oxidative stress. J Neurochem 2001, 78:249–253.
6. Clarke R, Smith AD, Jobst KA, Refsum H, Sutton L, Ueland PM: Folate, vitamin B12, and serum total homocysteine levels in confirmed Alzheimer disease. Arch Neurol 1998, 55:1449–1455.
7. Quadri P, Fragiacomo C, Pezzati R, Zanda E, Forloni G, Tettamanti M, Lucca U: Homocysteine, folate, and vitamin B-12 in mild cognitive impairment, Alzheimer disease, and vascular dementia. Am J Clin Nutr 2004, 80:114–122. 8. Ravaglia G, Forti P, Maioli F, Muscari A, Sacchetti L, Arnone G, Nativio V,
Talerico T, Mariani E: Homocysteine and cognitive function in healthy elderly community dwellers in Italy. Am J Clin Nutr 2003, 77:668–673. 9. Mooijaart SP, Gussekloo J, Frolich M, Jolles J, Stott DJ, Westendorp RG,
de Craen AJ: Homocysteine, vitamin B-12, and folic acid and the risk of cognitive decline in old age: the Leiden 85-Plus study. Am J Clin Nutr 2005, 82:866–871.
10. Haan MN, Miller JW, Aiello AE, Whitmer RA, Jagust WJ, Mungas DM, Allen LH, Green R: Homocysteine, B vitamins, and the incidence of dementia and cognitive impairment: results from the Sacramento Area Latino Study on Aging. Am J Clin Nutr 2007, 85:511–517.
11. Ravaglia G, Forti P, Maioli F, Martelli M, Servadei L, Brunetti N, Porcellini E, Licastro F: Homocysteine and folate as risk factors for dementia and Alzheimer disease. Am J Clin Nutr 2005, 82:636–643.
12. Seshadri S, Beiser A, Selhub J, Jacques PF, Rosenberg IH, D’Agostino RB, Wilson PW, Wolf PA: Plasma homocysteine as a risk factor for dementia and Alzheimer’s disease. N Engl J Med 2002, 346:476–483.
13. Beydoun MA, Beydoun HA, Gamaldo AA, Teel A, Zonderman AB, Wang Y: Epidemiologic studies of modifiable factors associated with cognition and dementia: systematic review and meta-analysis. BMC Public Health 2014, 14:643.
14. Kim J, Park MH, Kim E, Han C, Jo SA, Jo I: Plasma homocysteine is associated with the risk of mild cognitive impairment in an elderly Korean population. J Nutr 2007, 137:2093–2097.
15. Riggs KM, Spiro A 3rd, Tucker K, Rush D: Relations of vitamin B-12, vitamin B-6, folate, and homocysteine to cognitive performance in the Normative Aging Study. Am J Clin Nutr 1996, 63:306–314.
16. Prins ND, Den Heijer T, Hofman A, Koudstaal PJ, Jolles J, Clarke R, Breteler MM: Homocysteine and cognitive function in the elderly: the Rotterdam Scan Study. Neurology 2002, 59:1375–1380.
17. Kim JM, Stewart R, Kim SW, Shin IS, Yang SJ, Shin HY, Yoon JS: Changes in folate, vitamin B12, and homocysteine associated with incident dementia. J Neurol Neurosurg Psychiatry 2008, 79:864–868. 18. Chang N, Kim E, Kim KN, Kim H, Kim SY, Jeong BS: Folate nutrition is
related to neuropsychological functions in the elderly. Nutr Res Pract 2009, 3:43–48.
19. Lee JH, Lee KJ, Kim HJ: Serum levels of homocysteine, folate, and vitamin B12 and cognitive function in mild cognitive impairment and Alzheimer's disease. Korean Geriatr Psychiatry 2010, 14:44–49.
20. Kim G, Kim H, Kim KN, Son JI, Kim SY, Tamura T, Chang N: Relationship of cognitive function with B vitamin status, homocysteine, and tissue factor pathway inhibitor in cognitively impaired elderly: a cross-sectional survey. J Alzheimers Dis 2013, 33:853–862.
21. Faux NG, Ellis KA, Porter L, Fowler CJ, Laws SM, Martins RN, Pertile KK, Rembach A, Rowe CC, Rumble RL, Szoeke C, Taddei K, Taddei T, Trounson BO, Villemagne VL, Ward V, Ames D, Masters CL, Bush AI: Homocysteine, vitamin B12, and folic acid levels in Alzheimer's disease, mild cognitive impairment, and healthy elderly: baseline characteristics in subjects of the Australian Imaging Biomarker Lifestyle study. J Alzheimers Dis 2011, 27:909–922.
22. Brussaard JH, Löwik MR, van den Berg H, Brants HA, Goldbohm RA: Folate intake and status among adults in the Netherlands. Eur J Clin Nutr 1997, 51:S46–S50.
23. Planells E, Sánchez C, Montellano MA, Mataix J, Llopis J: Vitamins B6 and B12 and folate status in an adult Mediterranean population. Eur J Clin Nutr 2003, 57:777–785.
24. Tucker K, Qiao N, Scott T, Rosenberg I, Spiro A: High homocysteine and low B vitamins predict cognitive decline in aging men: the Veterans affairs normative aging study. Am J Clin Nutr 2005, 82:627–635. 25. Mizrahi EH, Jacobsen DW, Debanne SM, Traore F, Lerner AJ, Friedland RP,
Petot GJ: Plasma total homocysteine levels, dietary vitamin B6 and folate intake in AD and healthy aging. J Nutr Health Aging 2003, 7:160–165.
Kim et al. Nutrition Journal 2014, 13:118 Page 10 of 11
26. Corrada MM, Kawas CH, Hallfrisch J, Muller D, Brookmeyer R: Reduced risk of Alzheimer's disease with high folate intake: the Baltimore Longitudinal Study of Aging. Alzheimers Dement 2005, 1:11–18. 27. McNeill G, Jia X, Whalley LJ, Fox HC, Corley J, Gow AJ, Brett CE, Starr JM,
Deary IJ: Antioxidant and B vitamin intake in relation to cognitive function in later life in the Lothian Birth Cohort 1936. Eur J Clin Nutr 2011, 65:619–626.
28. Woo EK, Han C, Jo SA, Park MK, Kim S, Kim E, Park MH, Lee J, Jo I: Morbidity and related factors among elderly people in South Korea: results from the Ansan Geriatric (AGE) cohort study. BMC Public Health 2007, 7:10. 29. Korean Ministry of Health and Welfare: The Korean National Health Nutrition
Examination Survey 2011. Seoul: Korean Ministry of Health and Welfare; 2012. 30. The Korean Nutrition Society: Food Values. Seoul: The Korean Nutrition
Society; 2009.
31. Kwak CS, Hwang JY, Watanabe F, Park SC: Vitamin B12 contents in some Korean fermented foods and edible seaweeds. J Nutr Health 2008, 41:430–447.
32. Institute of Medicine: Dietary reference intakes for thiamin, riboflavin, niacin, vitamin B6, folate, vitamin B12, panthothenic acid, biotin, and choline. Washington, DC: National Academy Press; 2000:196–305.
33. The Korean Nutrition Society: Dietary reference intakes for Koreans. Seoul: The Korean Nutrition Society; 2010.
34. Selhub J, Jacques PF, Wilson PW, Rush D, Rosenberg IH: Vitamin status and intake as primary determinants of homocysteinemia in an elderly population. JAMA 1993, 270:2693–2698.
35. Ganji V, Kafai MR: Frequent consumption of milk, yogurt, cold breakfast cereals, peppers, and cruciferous vegetables and intakes of dietary folate and riboflavin but not vitamins B-12 and B-6 are inversely associated with serum total homocysteine concentrations in the US population. Am J Clin Nutr 2004, 80:1500–1507.
36. Selhub J: Homocysteine metabolism. Annu Rev Nutr 1999, 19:217–246. 37. Nilforooshan R, Broadbent D, Weaving G, Gurton J, Moore V, Houston L,
Tabet N: Homocysteine in Alzheimer's disease: role of dietary folate, vitamin B6 and B12. Int J Geriatr Psychiatry 2011, 26:876–877.
38. Morris MC, Evans DA, Schneider JA, Tangney CC, Bienias JL, Aggarwal NT: Dietary folate and vitamins B-12 and B-6 not associated with incident Alzheimer's disease. J Alzheimers Dis 2006, 9:435–443.
39. Nilsson K, Gustafson L, Hultberg B: Improvement of cognitive functions after cobalamin/folate supplementation in elderly patients with dementia and elevated plasma homocysteine. Int J Geriatr Psychiatry 2001, 16:609–614.
40. Kwok T, Lee J, Law CB, Pan PC, Yung CY: A randomized placebo controlled trial of homocysteine lowering to reduce cognitive decline in older demented people. Clin Nutr 2011, 30:297–302.
41. Aisen PS, Schneider LS, Sano M, Diaz-Arrastia R, van Dyck CH, Weiner MF, Bottiglieri T, Jin S, Stokes KT, Thomas RG, Thal LJ: High-dose B vitamin supplementation and cognitive decline in Alzheimer disease: a randomized controlled trial. JAMA 2008, 300:1774–1783.
42. de Jager C, Oulhaj A, Jacoby R, Refsum H, Smith AD: Cognitive and clinical outcomes of homocysteine-lowering B-vitamin treatment in mild cognitive impairment: a randomized controlled trial. Int J Geriatr Psychiatry 2012, 27:592–600.
43. van Uffelen J, Chinapaw M, van Mechelen W, Hopman-Rock M: Walking or vitamin B for cognition in older adults with mild cognitive impairment? A randomised controlled trial. Br J Sports Med 2008, 42:344.
44. Lee L, Kang SA, Lee HO, Lee BH, Park JS, Kim JH, Jung IK, Park YJ, Lee JE: Relationships between dietary intake and cognitive function level in Korean elderly people. Public Health 2001, 115:133–138.
45. Kim JH, Kang SA, Ahn HS, Jung IK: Relationship between cognitive function and dietary patterns in Korean elderly women. J Nutr Health 1998, 31:1457–1467.
46. Bryan J, Calvaresi E, Hughes D: Short-term folate, vitamin B-12 or vitamin B-6 supplementation slightly affects memory performance but not mood in women of various ages. J Nutr 2002, 132:1345–1356.
47. Durga J, van Boxtel M, Schouten E, Kok F, Jolles J, Katan M: Effect of 3-year folic acid supplementation on cognitive function in older adults in the FACIT trial: a randomised, double blind, controlled trial. Lancet 2007, 369:208–216.
48. Walker JG, Batterham PJ, Mackinnon AJ, Jorm AF, Hickie I, Fenech M, Kljakovic M, Crisp D, Christensen H: Oral folic acid and vitamin B12 supplementation to prevent cognitive decline in community-dwelling
older adults with depressive symptoms-the Beyond Ageing Project: a randomized controlled trial. Am J Clin Nutr 2012, 95:194–203. 49. Kwok T, Tang C, Woo J, Lai W, Law L, Pang C: Randomized trial of the
effect of supplementation on the cognitive function of older people with subnormal cobalamin levels. Int J Geriatr Psychiatry 1998, 13:611–616. 50. Eussen S, de Groot L, Joosten L, Bloo R, Clarke R, Ueland P: Effect of oral
vitamin B-12 with or without folic acid on cognitive function in older people with mild vitamin B-12 deficiency: a randomized, placebo-controlled trial. Am J Clin Nutr 2006, 84:361–370.
51. Lewerin C, Matousek M, Steen G, Johansson B, Steen B, Nilsson-Ehle H: Significant correlations of plasma homocysteine and serum methylmalonic acid with movement and cognitive performance in elderly subjects but no improvement from short-term vitamin therapy: a placebo-controlled randomized study. Am J Clin Nutr 2005, 81:1155–1162.
doi:10.1186/1475-2891-13-118
Cite this article as: Kim et al.: Association between intake of B vitamins and cognitive function in elderly Koreans with cognitive impairment. Nutrition Journal 2014 13:118.
Submit your next manuscript to BioMed Central and take full advantage of:
• Convenient online submission
• Thorough peer review
• No space constraints or color figure charges
• Immediate publication on acceptance
• Inclusion in PubMed, CAS, Scopus and Google Scholar
• Research which is freely available for redistribution
Submit your manuscript at www.biomedcentral.com/submit
Kim et al. Nutrition Journal 2014, 13:118 Page 11 of 11