저작자표시-비영리-변경금지 2.0 대한민국 이용자는 아래의 조건을 따르는 경우에 한하여 자유롭게 l 이 저작물을 복제, 배포, 전송, 전시, 공연 및 방송할 수 있습니다. 다음과 같은 조건을 따라야 합니다: l 귀하는, 이 저작물의 재이용이나 배포의 경우, 이 저작물에 적용된 이용허락조건 을 명확하게 나타내어야 합니다. l 저작권자로부터 별도의 허가를 받으면 이러한 조건들은 적용되지 않습니다. 저작권법에 따른 이용자의 권리는 위의 내용에 의하여 영향을 받지 않습니다. 이것은 이용허락규약(Legal Code)을 이해하기 쉽게 요약한 것입니다. Disclaimer 저작자표시. 귀하는 원저작자를 표시하여야 합니다. 비영리. 귀하는 이 저작물을 영리 목적으로 이용할 수 없습니다. 변경금지. 귀하는 이 저작물을 개작, 변형 또는 가공할 수 없습니다.
Master’s Thesis of Nursing Science
Patient-Related Factors to Pain
Management among Mongolian
Cancer Patients
몽골
암환자의 통증 관리에 영향을 미치는 환
자
관련 요인
August 2016
서울대학교
대학원
간호학과 간호학 전공
Oyunbileg Bayarsaikhan
1
Abstract
Pain is one of the most common symptoms of cancer and approximately 25-75% of cancer patients experience pain. A patient who is experiencing pain plays an important role in identifying and assessing pain as well as in managing it. This study aimed to identify levels of anxiety, depression, beliefs on pain and analgesics, pain intensity, pain interference and adequacy of a pain management index and to examine their relationships among Mongolian cancer patients.
A descriptive, cross-sectional design was used in this research. Data from convenience sampling of 145 cancer patients were collected from three hospitals and three hospices from February 19 to March 5, 2016. The independent t-test, one-way ANOVA, and Pearson’s correlation were performed using the SPSS 23.0 program.
Among the participants, levels of both anxiety and depression were mild. Middle-aged patients were more anxious, while lung cancer patients, stage-IV cancer patients, and palliative care patients were more depressed. The highest concerns were fatalism, tolerance of analgesics, and monitoring disease progression. Patients who experienced cancer recurrence had fewer misbeliefs on pain and analgesics. Patients who were middle-aged, had completed high school education, lived in an urban setting, or were receiving hospice care reported higher levels of pain intensity and interferences.
2
Patients who were religious or were receiving curative treatment had less pain intensity. High-income patients reported more pain interference. Fifty (34.4%) patients were under-treated for pain control, and they had higher rates of anxiety, depression, concern on immune system, fear of addiction, pain intensity, and pain interference. Patients who were female, non-religious, diagnosed with lung or cervical cancer, or were receiving curative treatment were more likely to be inadequately treated for pain control.
As correlational study, patients who had higher levels of misbeliefs on pain and analgesics, pain intensity and interference were inadequately treated.
The findings of the present study can be used to enhance effective communication between patients and their health professionals, provide guidance for educating patients on their illness and pain, and develop interventions to reduce patient-related factors influencing inadequate pain management. This study enriches knowledge in pain management among Mongolian cancer patients and may help health care providers and patients be aware of patient-related factors influencing pain management.
Key words: Anxiety, Depression, Pain Severity, Pain Management, Cancer, Mongolia
3
Table of Contents
Abstract ... ⅰ
CHAPTER I. INTRODUCTION... 1
1. Background ... 1 2. Purpose of Study ... 3 3. Definition of Terms ... 4CHAPTER II. LITERATURE REVIEW ... 6
1. Pain and Pain Management ... 6
2. Anxiety and Depression ... 7
3. Belief on Pain and Analgesics... 8
CHAPTER III. METHODS ... 11
1. Study Design ... 11
2. Setting and Sampling ... 11
3. Instruments... 12
4. Data Collection Procedures... 16
5. Data Analysis ... 17
6. Ethical Consideration ... 17
CHAPTER IV. RESULTS ... 19
1. Demographic and Disease-Related Characteristics of the Participants .. 19
2. Level of Variables ... 21
3. Differences of the Variables by Demographic and Disease-Related Characteristics ... 26
4
CHAPTER V. DISCUSSION ... 40
CHAPTER VI. CONCLUSION ... 46
REFERENCES ... 50
5
List of Tables
Table 1. Demographic and Disease-Related Characteristics of Participants ... 20
Table 2. Levels of Anxiety and Depression ... 21
Table 3. Levels of Beliefs on Pain and Analgesics ... 22
Table 4. Levels of Pain Intensity and Interferences ... 23
Table 5. Pain Management Index... 24
Table 6. Comparison of Variables by Pain Management Index ... 25
Table 7. Anxiety by Demographic/Disease-Related Characteristics... 27
Table 8. Depression by Demographic/Disease-Related Characteristics ... 29
Table 9. Beliefs on Pain and Analgesics by Demographic/Disease-Related Characteristics ... 31
Table 10. Pain Intensity by Demographic and Disease-Related Characteristics . 33 Table 11. Pain Interference by Demographic and Disease-Related Characteristics ... 35
Table 12. Pain Management Index by Demographic/Disease-Related Characteristics ... 37
6
APPENDICES
APPENDIX A: Informed Consent ... 57
APPENDIX B: Demographic and Disease-Related Information ... 60
APPENDIX C: Barriers Questionnaire-II ... 61
APPENDIX D: Brief Pain Inventory-SF... 63
APPENDIX E: Hospital Anxiety and Depression ... 65
APPENDIX F: Institutional Review Board Approval... 66
1
CHAPTER I. I1NTRODUCTION
1.1 Background
Pain is one of the most common symptoms of cancer patients (van den Beuken-van Everdingen et al., 2007) and can also influence a person’s functioning (Gilson, Joranson, & Maurer, 2007) and quality of life (Breivik et al., 2009; Olufade, Gallicchio, MacDonald, & Helzlsouer, 2015). Nearly 25% of early stage cancer patients experience pain, and this increases to 60% during treatment and 75% in advanced stages (Fisch et al., 2012; van den Beuken-van Everdingen et al., 2007). Approximately 90% of cancer pain can be effectively controlled by pharmacological therapies which are guided by the World Health Organization (WHO, 1996), but patients are still experiencing pain (Jacox, Carr, & Payne, 1994; Yates et al., 2002).
Barriers to effective pain management are related to institutions, health care providers, patients, and their caregivers (Breivik et al., 2009). Institutional barriers are availability of capacity and policy of the organization, while health care provider-related barriers are lack of knowledge and misconceptions on effects of available medications (Pargeon & Hailey, 1999). Family members and caregivers of cancer patients have significant barriers towards pain management such as physiological distress, lack of knowledge, and attitudinal barriers, especially if the
2
patient is no longer able to meet his or her needs (McPherson, Hadjistavropoulos, Devereaux, & Lobchuk, 2014; Ovayolu, Ovayolu, Aytac, Serce, & Sevinc, 2015). Patient-related barriers are diverse including misconceptions on medication effects, poor communication with their health care providers, and their personal beliefs (Oldenmenger, Sillevis Smitt, van Dooren, Stoter, & van der Rijt, 2009). Emotional components of physical illness, especially anxiety and depression, may increase the distress of physical illness and negatively affect illness management (Snaith & Zigmond, 1994).
Researchers also emphasized that pain management depends on culture and health care system (Juarez, Ferrell, & Borneman, 1999; Valeberg et al., 2009). Patient-related perceived barriers of Asian cancer patients to pain management were notably higher than those of Western patients, especially for concerns about disease progression, tolerance, and fatalism (Chen, Tang, & Chen, 2012).
In Mongolia, cancer is the second (23.4%) leading cause of death. Almost 75.9% of cancer patients are diagnosed during advanced stages (III and IV) of disease and 64.3% of those survive for less than a year after the diagnosis (Health Indicator of
Mongolia 2013). Few studies had investigated about patient-related factors of
cancer pain management among Mongolian patients. Therefore, it is critical to identify patient-related factors in order to effectively treat and manage pain in Mongolian cancer patients.
3
1.2 Purpose of Study
The purpose of this study was to identify the levels of identify level of anxiety, depression, beliefs on pain and analgesics, pain severity and pain management and to find correlations among these variables in the sample of Mongolian cancer patients.
The specific aims of the study are to:
A. Identify levels of anxiety, depression, beliefs on pain and analgesics, severity of pain intensity and pain interference, and adequacy of pain management of the participants.
B. Identify differences of the variables by demographic and disease-related characteristics.
4
1.3 Definition of Terms
1. Anxiety and Depression
Conceptual definition of anxiety is the state of generalized anxiety not necessarily focused upon any situation. The concept covers the state of anxious mood, restlessness, and anxious thought (Snaith & Zigmond, 1994).
Conceptual definition of depression is the stage of grief, demoralization, low self-esteem, and pessimism (Snaith & Zigmond, 1994).
The Mongolian version of the Hospital Anxiety and Depression Scale, translated by the translation team of the present study, was used to assess levels of anxiety and depression of the participants.
2. Belief on Pain and Analgesics
A patient’s belief on pain and analgesics has eight different aspects: (a) concern that analgesics may block one’s ability to monitor illness symptoms, (b) concerns about side effects of analgesics, (c) concern that analgesic tolerance may later diminish analgesic effectiveness, (d) fatalism about experiencing uncontrolled cancer pain, (e) belief that ‘good’ patients do not complain, (f) concerns about distracting health caregivers, (g) concern that pain medications may impair the immune system, and (h) fear of addiction to pain medication (Gunnarsdottir,
5 Donovan, Serlin, Voge, & Ward, 2002).
The Mongolian version of the Barrier Questionnaire-II, translated by a translation team of the present study, was used to assess patients’ belief on pain and analgesics.
3. Pain Severity
Pain intensity indicates level of pain such as worst, least, average and current (Charles . S Cleeland, 2009).
Pain interference is the level of impact of pain on functioning of general activity, mood, walking ability, normal work, relations with other people, sleep, and enjoyment of life (Cleeland, 2009).
The Brief Pain Inventory-Short Form (BPI-SF) was used to identify pain intensity and interference in this study. From this, the third and seventh questions were used to assess adequacy of pain management. (Note: the second and eighth questions were not used in the present study). The translation team translated the BPI-SF from English into Mongolian.
4. Pain Management
Adequacy of pain management describes whether cancer pain is adequately treated or inadequately treated. Of the BPI-SF, the seventh question on type of pain medication and the third question of worst pain are used to compute pain
6 management index (Cleeland et al., 1994).
CHAPTER II. LITERATURE REVIEW
1. Pain and Pain Management
Cancer influences patients and their families both emotionally and physically (Bultz & Carlson, 2006). Pain, one of the most common symptoms among cancer patients,
is
always subjective and “whatever the experiencing person says it is, existing whenever the experiencing person says” (McCaffery & Moss, 1968). The International Association for the Study of Pain defined pain as “an unpleasant sensory or emotional experience associated with actual or potential tissue damage or described in terms of such damage” (Merskey, H., & Bogduk, N., 1994).Among the multiple guidelines on pain management, the 3-ladder pain medication guideline by the WHO is the gold standard for pain treatment and control. Unfortunately, many cancer patients are experiencing pain. Of cancer patients, 25% experience pain in the early stage of the disease, 60% during treatment, and 75% in advanced stages (Fisch et al., 2012; van den Beuken-van Everdingen et al., 2007). Breivik and colleagues found that 56% of their 5,084 European cancer research participants suffered moderate to severe pain, and 69% had difficulties with everyday activities (Breivik et al., 2009).
The barriers to optimal pain management are classified into three categories: systematic or institutional, professionals, and patient/family related barriers. At the institutional or systemic level, barriers are low priority given to cancer treatment,
7
problems of criteria or availability of culturally sensitive instruments for pain assessment, restrictive regulations or policies of controlled substances, and failure to hold healthcare professionals accountable for pain assessment (Ferrell, Coyle, & ebrary Inc., 2015; Sun et al., 2007). Health care professionals’ barriers include poor knowledge about accurately identifying and assessing pain, lack of time and ability for reassessment, not using validated measurement tools, problems in communication with health care team members and patients, and bias in dealing with patients (Ferrell et al., 2015; Jacobsen, Sjogren, Moldrup, & Christrup, 2007). Patient/family/societal barriers are highly subjective and include the personal nature of pain experience, lack of awareness on the importance of reporting pain, poor communication with healthcare professionals and misconceptions about pain medication (Ferrell et al., 2015; Ward et al., 1993).
As a complex problem, pain considerably and differently decreases each person’s quality of life and general functioning as well as that of their family or caregivers (Sun et al., 2012; Iwase et al., 2015). Under these circumstances, some studies focused on clarifying influential aspects of pain treatment and management and found that ineffective pain management involved not only problems of the health care provider, but also patients and their caregivers (Pargeon & Hailey, 1999).
2. Anxiety and Depression.
Emotional difficulties such as depression, anger, distress, anxiety, decreased ability to concentrate, mood disturbance, and loss of control may be associated with a person’s illness and can affect pain severity and management (Ferrell et al., 2015).
8
As well, emotional responses can be exacerbated by pain severity, illness and treatment settings. Cancer patients may view their disease as a fearful and lethal medical condition. Pain is one of the most afflicting and fearful symptoms of cancer patients (Bruera & Kim, 2003).
Among emotional difficulties, anxiety and depression are commonly used to evaluate distress from physical illness and decreased quality of life (DiMatteo, Lepper, & Croghan, 2000; Snaith & Zigmond, 1994). High levels of depression and anxiety adversely affect pain management and increase the level of suffering (Duffy & Valentine, 2011).
Although anxiety and depression are common symptoms among cancer patients, these experiences may be impacted by a patient’s illness and personal characteristics. Research with 10,153 participants found that the rate of anxiety and depression was higher in women, especially women who were diagnosed with lung, gynecological or hematological cancer, and in young people.
3. Belief on Pain and Analgesics
A patient’s beliefs affects their thinking, decision making process, views of himself or herself, knowledge, attitudes, and beliefs the person has about the pain and its management (Ferrell et al., 2015). Beliefs about pain may be influenced by one’s past experiences and feelings. A person’s hesitation to use analgesics may be related to one’s misunderstanding regarding the distinction between psychological addiction and physical dependence (Sherwood, Adams-McNeill, Starck, Nieto, & Thompson, 2000; Goebel et al., 2010). Desiring to reserve analgesic use for a time
9
when pain gets worse (Sherwood et al., 2000), preferring to bear the pain instead of dealing with side effects and potential impairment of the immune system, and using pain as an indicator of disease progression impact effective pain management (Gunnarsdottir et al., 2002). Not reporting pain is related to a person’s will to be brave, beliefs that nothing can help, or not wanting to distract health care providers from curing cancer are also reasons that may affect pain management (Gunnarsdottir et al., 2002).
Patient-related factors could also differ based on variations in national health delivery systems, ethnicity, and culture (Edrington et al., 2009; Lebaron, Beck, Maurer, Black, & Palat, 2014). For example, cancer patients in Jordan held high levels of concern (mean of BQ=2.58) particularly for fear of addiction and side effects of pain medication (Al Qadire, 2012). Turkish cancer patients had high levels of concern on addiction and physical side effects (Bagcivan, Tosun, Komurcu, Akbayrak, & Ozet, 2009). Other highlighted barriers to effective pain management among Jordan cancer patients were communication concerns and fatalistic beliefs (Saifan, Bashayreh, Batiha, & AbuRuz, 2015). Among 144 Australian cancer patients, 56% reported pain as a distressing symptom which affected their emotional well-being. Of these patients, 39% tended to wait until pain became severe before taking medication, and 32% preferred to save pain medications for the worst pain (Yates et al., 2002). Taiwanese cancer patients showed higher barriers on tolerance (mean=4.17) and disease progression (mean=3.99) (Lin & Ward, 1995).
Pain intensity and interference with function directly influences a patient’s quality of life and effective pain management. To accurately identify cancer pain,
10
assessment needs to include characteristics such as prevalence, severity, and interference with functioning as a result of cancer pain (Cleeland, 1991). A survey on pain impact on the life of breast cancer survivors revealed that pain exerted a negative impact on mood, normal work, and sleep (Ferreira et al., 2015).
Accurate and continuous pain assessment is the basis of effective pain treatment and enables healthcare professionals to do as much as possible for patients (McPherson et al., 2014). A comprehensive pain assessment should be performed at regular intervals whenever there is a change in the pain and after any modifications in the pain management plan. Given all these considerations, it is critical to understand cancer patient factors which play important roles in pain management.
11
CHAPTER III. METHODS
1. Study Design
This study used a descriptive, cross-sectional design to describe levels of anxiety, depression, beliefs on pain and analgesics, pain intensity, pain interference and pain management, and to examine relationships between these variables.
2. Setting and Sampling
2.1 Settings
The data were collected from three hospitals and three hospices in Mongolia.
1. The National Cancer Center of Mongolia (NCC) is the tertiary hospital for cancer patients providing diagnosis, surgeries, radiation and chemotherapy, and palliative care. The NCC has capacity of 190 acute and 18 palliative care beds. 2. Bayangol District Hospital and Songdo hospitals are secondary health care
facilities where the cancer patients are hospitalized or receive day care from the outpatient clinics.
12
3. Grace, Hope, and Agape hospices are capable of serving 20-60 patients, most of whom are cancer patients.
2.2 Eligibility criteria
The inclusion criteria for the patients were: (a) diagnosed with cancer, (b) older than 18 years, (c) previously or still using an analgesic for cancer-related pain, (d) physically and mentally able to complete the procedures, and (e) willing to participate. Those who refused to participate for any reason were excluded without any judgment or penalty.
2.3 Sample size
Convenience sampling methods were used. The G-power program was used to determine the proper sample size which could reveal significant results. The significance level for the study was set at alpha level 0.05, which means that there is 5% risk of making a Type I error and also there is at least a 95% chance of finding true significance. The effect size of 0.45 was chosen with α=0.05 and power of 0.80, indicating a sample size of 111 was required. Thirty percent was added to accommodate for attrition. This resulted in a final required sample size of 145.
3.
Instruments
13
linguistically appropriate instruments for the target population, translation from source language (English) to the target language (Mongolian) went through the process of the forward and backward translation model (Hilton & Skrutkowski, 2002). Forward translations from the English into Mongolian were performed by a bilingual Mongolian healthcare professional. Two healthcare professionals reviewed forward translations in Mongolian. Then another bilingual nurse, who was not aware of the original English versions, translated the reviewed versions into English. The researcher and authors of the questionnaires performed comparisons of the original version and back-translated version. When back translated versions were found insufficient, this process was repeated until maximum equivalence between the source language and back-translated versions were achieved.
The study variables of the present study were measured with three instruments.
Variables Instruments Items
Anxiety and depression HADS 14
Beliefs on pain and analgesics BQ-II 27
Pain severity and pain management BPI-SF 7
1. Anxiety and Depression.
Hospital Anxiety and Depression Scale (HADS) was used to assess anxiety and
depression. The scale is a 14-item self-reported questionnaire which was developed by Zigmond and Snaith in 1983 to assess the psychological states of patients with physical problems (Zigmond & Snaith, 1983). Anxiety and depression are each measured using seven items that are rated using 0-3 scores (4-point Likert scale).
14
Scores can range from 0 to 21 on each subscale. A subscale score of 0-7 is considered as normal, 8-10 as mild, 11-14 as moderate and 15-21 as severe for both anxiety and depression. In this study, the total scale’s internal consistency, evaluated with Cronbach’s alpha, was 0.73. For anxiety and depression subscales it was 0.84 and 0.73 respectively.
2. Beliefs on Pain and Analgesics
Barriers Questionnaire-II (BQ-II). Barriers Questionnaire (BQ) was developed
to measure patient-related barriers to pain management (Ward et al., 1993). Due to changes in pain management and cancer treatment, BQ was revised and called the Barriers Questionnaire-II (BQ-II) (Gunnarsdottir et al., 2002). BQ-II is a 27-item self-report instrument that measures patients’ beliefs about cancer pain and use of analgesics. Each item is rated on a Likert scale that ranges from zero (do not agree at all) to five (agree very much). The BQ-II includes eight subscales: (a) monitor-disease progression, (b) side effects, (c) tolerance, (d) fatalism, (e) desire to be a good patient, (f) distracting the health care provider, (g) immune system, and (h) addiction. Subscale and total BQ-II scores, calculated as the means of the individual items, can range from 0 to 5, with higher scores indicating higher levels of perceived barriers. Validity and reliability of original BQ-II are well established. The original copy of BQ-II’s internal consistency was 0.89. In this study, Cronbach’s alpha was 0.81.
15
Brief Pain Inventory-Short Form (BPI-SF) was developed by the Pain Research
Group of the WHO Collaborating Center for Symptom Evaluation in Cancer Care (Cleeland & Ryan, 1994). The BPI-SF, a self-reported nine-item questionnaire was used to measure pain intensity and pain interferences, as well as to calculate a pain management index. As research results proved that the original BPI was too lengthy, the short form of BPI was developed and has been widely used in clinical and research applications (Cleeland, 2009). However, the second question on location of pain and eighthquestion on pain relief were not used for this study. The validity and reliability of the BPI-SF has been well established (de Andres Ares et al., 2015). Cronbach alpha of the instrument in this study was 0.86.
The pain intensity score was measured using a numerical scale, 0 (no pain) to 10 (pain as bad as one can imagine). A mean of total pain intensity was calculated as the mean of the worst, least, average, and current pain intensities from the BPI-SF, consistent with previous studies (Baker, O'Connor, & Krok, 2014; Charles . S Cleeland, 2009).
The pain interference score was measured by a numerical scale, 0 (no interference at all) to 10 (complete interference). A mean of total pain interference was calculated as the mean of seven interference items including interferences to general activity, mood, walking ability, normal work, relationships with other people, sleep, and enjoyment of life.
16
Adequacy of pain management was measured utilizing the Pain Management Index (PMI) method. The PMI was developed by Cleeland and colleagues (Cleeland et al., 1994). To compute the PMI, type of pain medication (obtained from BPI-SF question 7) and worst pain (obtained from BPI-SF question 3) are used. Medication type (categorization) is based on the WHO’s ladder guideline for analgesics (WHO, 1996). No prescribed or used analgesic were categorized as 0, while non-opioid (NSAID) use, weak opioid (tramadol, codeine) use, and strong opioid (morphine) use are categorized as 1, 2, and 3 respectively. If the worst pain score is 0 (no pain), it is categorized as 0, while pain scores of 1-3 (mild), 4-7 (moderate pain), and 8-10 (severe pain) are categorized as 1, 2, and 3 respectively. The PMI is determined by subtracting the worst pain score from the analgesic score. The PMI is determined by subtracting the worst pain score from the analgesic score. A negative PMI scores means a patient’s pain is under-medicated, while scores of zero or greater indicate adequate analgesics for pain.
4. Data Collection Procedures
An advertisement or flyers on the research were distributed in nursing stations of the selected hospitals and hospices in Mongolia.
A package of questionnaires was given to the patient. Questionnaire completion took place in a patient’s room, nursing station, or in a place of the participant’s choosing that was comfortable for the patient. Questionnaires were returned to the nursing station where the researcher was waiting, or the researcher collected them from the patients when they were done. The researcher was nearby the participants
17
to clarify any misconception or address any difficulties in reading the questionnaires. The researcher helped the patient if this was desired. Prior to distributing the questionnaire, the researcher reviewed information and obtained verbal or written informed consent from the participants. At the time of obtaining consent, the researcher asked participants if they were interested in meeting with the researcher again to know about research results. When the package of questionnaires was returned, the researcher checked each questionnaire for either missing parts or unreadable hand writing. It took approximately 15-20 minutes to complete the questionnaires.
5. Data Analysis
Data was analyzed using the IBM Statistical Package for Social Sciences 23.0 version. Descriptive statistics included frequencies, percentage, means, and standard deviations. One-way ANOVA and independent t-tests were used to investigate associations between demographics, disease-related characteristics, level of anxiety, depression, beliefs on pain and analgesics, pain intensity, pain interference, and pain management. Pearson’s correlation (bivariate) was used to examine relationships among main variables. The significance level was set at 0.05.
6. Ethical Consideration
The research was approved by the Institutional Review Board of the Seoul National University (IRB NO.1602/002-007). Approvals for research undertaken in Mongolia were obtained from administrators, head nurses, or managers of hospitals
18
and hospices. Codes were used on completed questionnaires instead of recording identifying information. Permissions to use instruments were obtained from the authors. Each participant was informed through the written consent form and verbal explanation by the investigator.
Paper copies of the consent form, demographic data, questionnaires and field notes will be stored in locked file. Data will be kept for a period of at least 5 years.
19
CHAPTER IV. RESULTS
1. Demographic and Disease-Related Characteristics of the
Participants
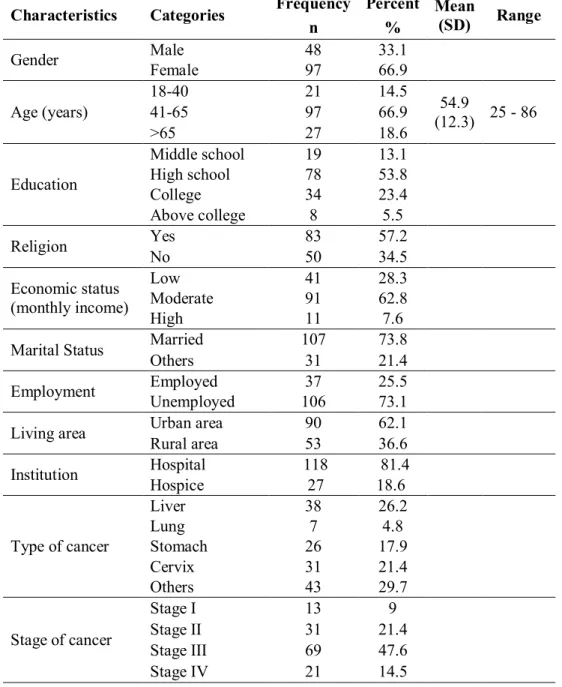
A convenience sample of 145 cancer patients participated in this study. Most of the participants (81.4%) were in a hospital setting. The majority (66.9%) of the participants were female. The mean age was 54.9 (±12.3) years old, ranging from 25 to 86. Seventy-eight (53.8%) participants had completed high school as their highest level of education, and 83 (57.2%) had religion. Among the participants, 91 (62.8%) had moderate monthly income and 107 (73.8%) were married. The majority (73.1%), were unemployed. Ninety (62.1%) of the participants lived in the city.
The most common types of cancer were liver (26.2%) and cervix (21.4%). Of the participants, 69 (47.6%) had stage-III cancer. “Cancer had reoccurred among 26 (17.9%) participants. Curative treatment was being given to 93 (64.1%) patients”. Twenty-seven (18.6%) had other medical issues besides cancer.
20
Table 1. Demographic and Disease-Related Characteristics of Participants
Characteristics Categories Frequency Percent Mean
(SD) Range n % Gender Male 48 33.1 Female 97 66.9 Age (years) 18-40 21 14.5 54.9 (12.3) 41-65 97 66.9 25 - 86 >65 27 18.6 Education Middle school 19 13.1 High school 78 53.8 College 34 23.4 Above college 8 5.5 Religion Yes 83 57.2 No 50 34.5 Economic status (monthly income) Low 41 28.3 Moderate 91 62.8 High 11 7.6
Marital Status Married 107 73.8
Others 31 21.4
Employment Employed 37 25.5
Unemployed 106 73.1
Living area Urban area 90 62.1
Rural area 53 36.6 Institution Hospital 118 81.4 Hospice 27 18.6 Type of cancer Liver 38 26.2 Lung 7 4.8 Stomach 26 17.9 Cervix 31 21.4 Others 43 29.7 Stage of cancer Stage I 13 9 Stage II 31 21.4 Stage III 69 47.6 Stage IV 21 14.5
21
Recurrence Yes 26 17.9
No 118 81.4
Current treatment Curative 93 64.1
Palliative 51 35.2
Any other medical issues
Yes 27 18.6
No 112 77.2
2. Level of Variables
2.1 Anxiety and Depression
As shown in table 2, the total mean of anxiety was 9.77 (±2.51) and the total mean of depression was 9.01 (±4.31).
Table 2. Levels of Anxiety and Depression
Variable Mean SD Min-Max
Anxiety 9.77 2.51 4 - 16
Depression 9.01 4.31 1- 20
2.2 Beliefs on Pain and Analgesics
The total BQ-II mean score was 2.69 (±0.63). The highest concerns among participants were fatalism (3.27 ±0.99), tolerance (3.13 ±1.0]), and monitoring disease progression (2.92 ±1.08). The lowest was distracting health professionals (2.16 ±1.14).
Table 3. Levels of Beliefs on Pain and Analgesics
Variable Category Mean SD Min-Max
Belief on Pain and Analgesics Monitor-disease progression 2.92 1.08 0.0 - 5.0 Side effects 2.29 0.85 0.2 - 4.7 Tolerance 3.13 1.08 0.3 - 5.0 Fatalism 3.27 0.99 0.5 - 5.0 Desire to be good 2.33 1.21 0.0 - 5.0 Distracting health professionals 2.16 1.14 0.0 - 5.0
22
Immune system 2.72 1 0.3 - 5.0
Addiction 2.77 1.21 0.0 - 5.0
Total BQ-II a Score 2.69 0.63 0.8 - 4.5
a Barriers Questionnaire-II
2.
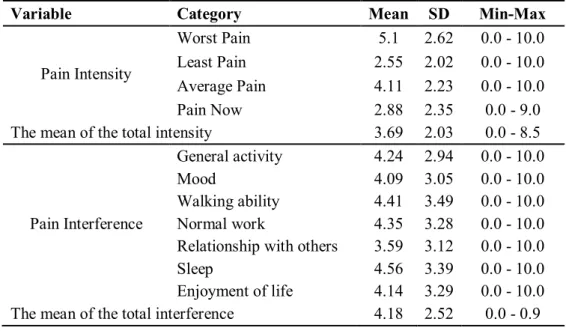
3 Pain Severity
The mean of the total intensity was 3.69 (±2.03) and the mean of the total interference was 4.18 (±2.52).
Table 4. Levels of Pain Intensity and Interferences
Variable Category Mean SD Min-Max
Pain Intensity
Worst Pain 5.1 2.62 0.0 - 10.0
Least Pain 2.55 2.02 0.0 - 10.0 Average Pain 4.11 2.23 0.0 - 10.0
Pain Now 2.88 2.35 0.0 - 9.0
The mean of the total intensity 3.69 2.03 0.0 - 8.5
Pain Interference
General activity 4.24 2.94 0.0 - 10.0
Mood 4.09 3.05 0.0 - 10.0
Walking ability 4.41 3.49 0.0 - 10.0 Normal work 4.35 3.28 0.0 - 10.0 Relationship with others 3.59 3.12 0.0 - 10.0
Sleep 4.56 3.39 0.0 - 10.0
Enjoyment of life 4.14 3.29 0.0 - 10.0 The mean of the total interference 4.18 2.52 0.0 - 0.9
2.4 Pain Management
23
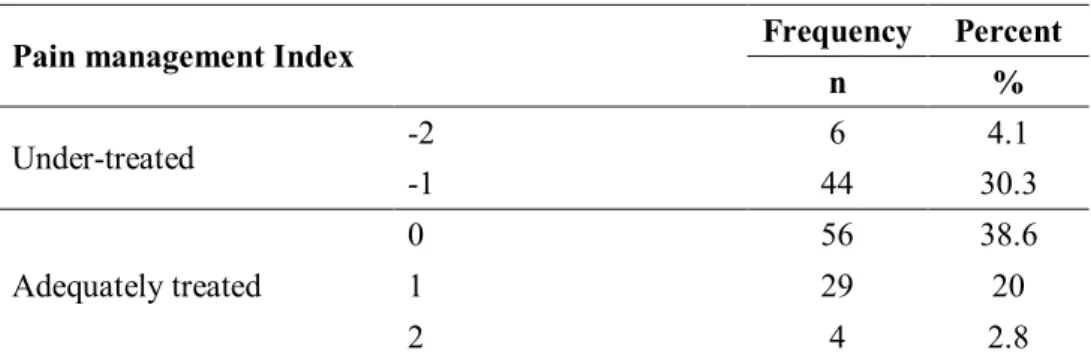
The PMI was determined by subtracting the worst pain score from the analgesic score, measured by the Brief Pain Inventory-Short Form. A negative PMI score (possible range of -3 to -1) indicates that a patient’s pain is under-medicated, while scores of zero or greater (possible range of 0 to 3) indicates adequate analgesic use for pain control.
As shown in Table 5, fifty (34.4%) patients were under-treated.
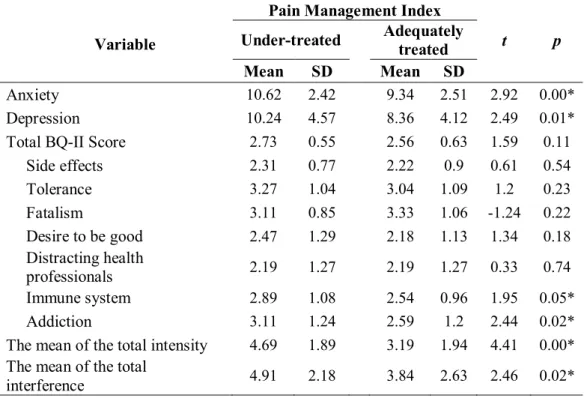
2.4.2 Comparison of Variables by Pain Management Index
Patients whose pain was under-treated had higher anxiety (t=2.92, p=0.00), and depression (t=2.49, p=0.01). Under-treated patients had higher rates of misconception about the immune system (t=1.95, p=0.05), and addiction (t=2.44,
p=0.02). In addition, under-treated patients had higher pain intensity (t=4.41, p=0.00), and interference (t=2.46, p=0.02).
Table 5. Pain Management Index
Pain management Index Frequency Percent
n % Under-treated -2 6 4.1 -1 44 30.3 Adequately treated 0 56 38.6 1 29 20 2 4 2.8
24
Table 6. Comparison of Variables by Pain Management Index
Variable
Pain Management Index
t p
Under-treated Adequately treated
Mean SD Mean SD
Anxiety 10.62 2.42 9.34 2.51 2.92 0.00*
Depression 10.24 4.57 8.36 4.12 2.49 0.01*
Total BQ-II Score 2.73 0.55 2.56 0.63 1.59 0.11
Side effects 2.31 0.77 2.22 0.9 0.61 0.54 Tolerance 3.27 1.04 3.04 1.09 1.2 0.23 Fatalism 3.11 0.85 3.33 1.06 -1.24 0.22 Desire to be good 2.47 1.29 2.18 1.13 1.34 0.18 Distracting health professionals 2.19 1.27 2.19 1.27 0.33 0.74 Immune system 2.89 1.08 2.54 0.96 1.95 0.05* Addiction 3.11 1.24 2.59 1.2 2.44 0.02*
The mean of the total intensity 4.69 1.89 3.19 1.94 4.41 0.00* The mean of the total
interference 4.91 2.18 3.84 2.63 2.46 0.02*
3. Differences of the Variables by Demographic and Disease-Related
Characteristics
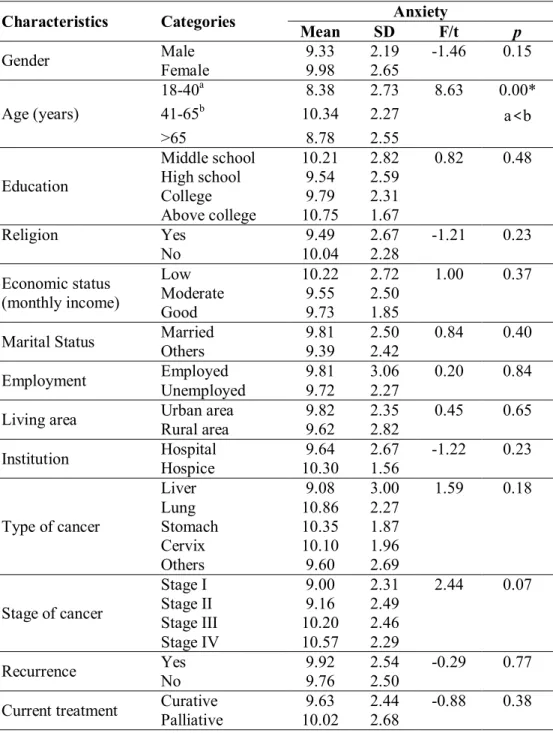
3.1 Anxiety by Demographic and Disease-Related Characteristics
No differences were found in anxiety by demographic and disease-related characteristics, except for the age (Table 7). Post-hoc test showed that patients who were in the 41-65 age group had higher levels of anxiety than those in the 18-40 age group (p=0.00).
25
Table 7. Anxiety by Demographic/Disease-Related Characteristics
Characteristics Categories Anxiety
Mean SD F/t p
Gender Male Female 9.33 9.98 2.19 2.65 -1.46 0.15
Age (years) 18-40a 8.38 2.73 8.63 0.00* 41-65b 10.34 2.27 a<b >65 8.78 2.55 Education Middle school 10.21 2.82 0.82 0.48 High school 9.54 2.59 College 9.79 2.31 Above college 10.75 1.67 Religion Yes 9.49 2.67 -1.21 0.23 No 10.04 2.28 Economic status (monthly income) Low 10.22 2.72 1.00 0.37 Moderate 9.55 2.50 Good 9.73 1.85
Marital Status Married Others 9.81 9.39 2.50 2.42 0.84 0.40 Employment Employed Unemployed 9.81 9.72 3.06 2.27 0.20 0.84 Living area Urban area Rural area 9.82 9.62 2.35 2.82 0.45 0.65 Institution Hospital Hospice 10.30 9.64 2.67 1.56 -1.22 0.23
Type of cancer Liver 9.08 3.00 1.59 0.18 Lung 10.86 2.27 Stomach 10.35 1.87 Cervix 10.10 1.96 Others 9.60 2.69 Stage of cancer Stage I 9.00 2.31 2.44 0.07 Stage II 9.16 2.49 Stage III 10.20 2.46 Stage IV 10.57 2.29 Recurrence Yes 9.92 2.54 -0.29 0.77 No 9.76 2.50
26 Any other medical
issues
Yes 10.11 2.56 -0.82 0.41
No 9.66 2.56
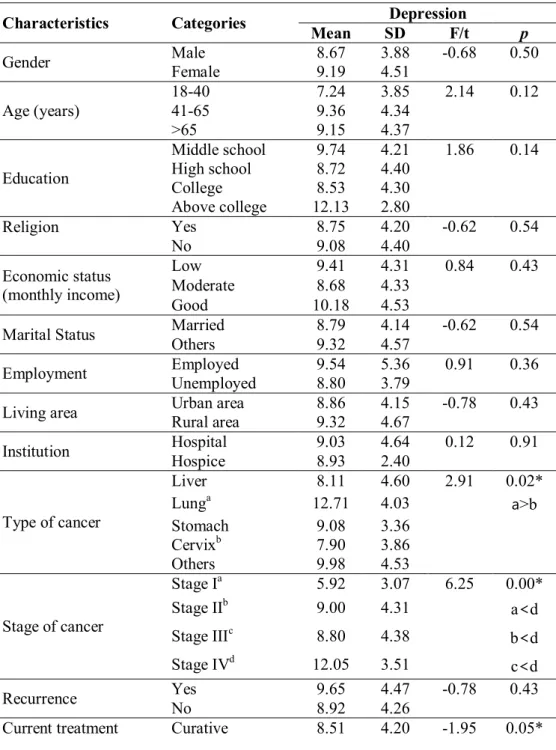
3.2 Depression by Demographic and Disease-Related Characteristics
Depression was significantly different than type of cancer (F(4,140)=2.91,
p=0.02), stage of cancer (F(3,130)=6.25, p=0.00), and current treatment (t=-1.95,
p=0.05).
Lung cancer patients had higher levels of depression than cervix cancer patients (p=0.05) as the post-hoc test shown.
According to post hoc test results, statistically significant differences between stage-IV and stage-I (p=0.00), stage-II (p=0.05), and stage-III (p=0.01) showed that patients who had stage-IV cancer experienced higher levels of depression than those in other stages. Patients who were receiving palliative treatment had a higher level of depression (p=0.05).
27
Table 8. Depression by Demographic/Disease-Related Characteristics
Characteristics Categories Depression
Mean SD F/t p
Gender Male Female 8.67 9.19 3.88 4.51 -0.68 0.50 Age (years) 18-40 7.24 3.85 2.14 0.12 41-65 9.36 4.34 >65 9.15 4.37 Education Middle school 9.74 4.21 1.86 0.14 High school 8.72 4.40 College 8.53 4.30 Above college 12.13 2.80 Religion Yes 8.75 4.20 -0.62 0.54 No 9.08 4.40 Economic status (monthly income) Low 9.41 4.31 0.84 0.43 Moderate 8.68 4.33 Good 10.18 4.53
Marital Status Married Others 8.79 9.32 4.14 4.57 -0.62 0.54
Employment Employed 9.54 5.36 0.91 0.36
Unemployed 8.80 3.79
Living area Urban area Rural area 8.86 9.32 4.15 4.67 -0.78 0.43 Institution Hospital Hospice 9.03 8.93 4.64 2.40 0.12 0.91
Type of cancer Liver 8.11 4.60 2.91 0.02* Lunga 12.71 4.03 a>b Stomach 9.08 3.36 Cervixb 7.90 3.86 Others 9.98 4.53 Stage of cancer Stage Ia 5.92 3.07 6.25 0.00* Stage IIb 9.00 4.31 a<d Stage IIIc 8.80 4.38 b<d Stage IVd 12.05 3.51 c<d Recurrence Yes 9.65 4.47 -0.78 0.43 No 8.92 4.26
28
Palliative 9.96 4.42 Any other medical
issues
Yes 10.26 4.21 -1.79 0.13
No 8.61 4.33
3.3 Belief on Pain and Analgesics by Demographic and Disease-Related Characteristics
As shown in Table 9, a statistically significant difference (t=11.06, p=0.00) was found in cancer recurrence. Patients with cancer recurence had a lower level of misconception on pain and analgesics.
29
Table 9. Beliefs on Pain and Analgesics by Demographic/Disease-Related Characteristics
Characteristics Categories Beliefs on pain and analgesics
Mean SD F/t p Gender Male 2.69 0.6 0.4 0.53 Female 2.69 0.64 Age (years) 18-40 2.64 0.69 1.04 0.36 41-65 2.66 0.63 >65 2.85 0.56 Education Middle school 2.62 0.58 0.84 0.48 High school 2.76 0.62 College 2.61 0.63 Above college 2.87 0.7 Religion Yes 2.63 0.61 0.08 0.78 No 2.82 0.62 Economic status (monthly income) Low 2.7 0.64 0.01 0.99 Moderate 2.69 0.64 Good 2.7 0.61
Marital Status Married Others 2.72 2.69 0.62 0.62 0.02 0.87
Employment Employed 2.63 0.73 2.28 0.13
Unemployed 2.71 0.59
Living area Urban area 2.67 0.59 1.18 0.28
Rural area 2.72 0.69 Institution Hospital 2.61 0.66 -0.26 0.80 Hospice 2.65 0.45 Type of cancer Liver 2.67 0.72 0.29 0.88 Lung 2.78 0.78 Stomach 2.8 0.45 Cervix 2.67 0.69 Others 2.65 0.58 Stage of cancer Stage I 2.58 0.38 0.57 0.64 Stage II 2.79 0.53 Stage III 2.63 0.67 Stage IV 2.69 0.73 Recurrence Yes 2.57 0.91 11.06 0.00* No 2.72 0.55
Current treatment Curative Palliative 2.63 2.78 0.64 0.6 0.04 0.84
30
issues No 2.71 0.62
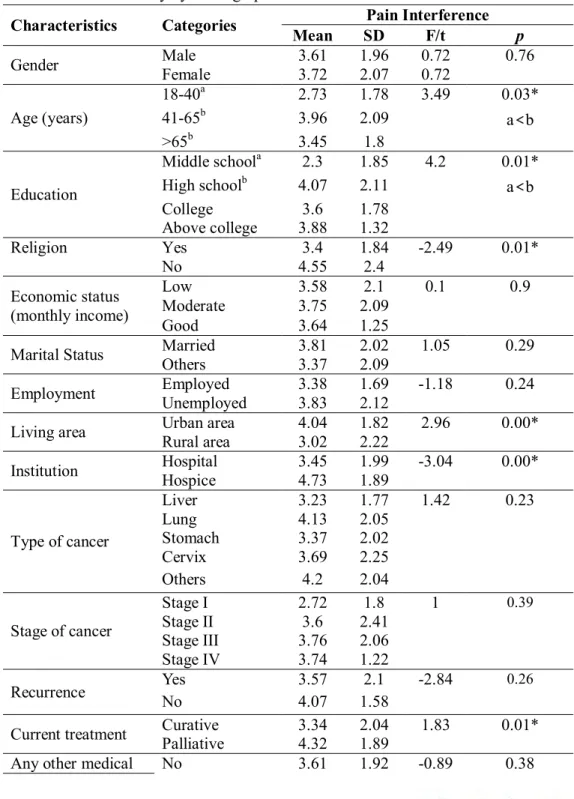
3.4 Pain Intensity by Demographic and Disease-Related Characteristics
The independent t-test revealed statistically significant differences of pain intensity with religion (t=-2.491, p=0.01) living area (t=2.96, p=0.00), institution (t=-3.04, p=0.00), and current treatment (t=1.83, p=0.01). These findings signify that patients who were non-religious, lived in an urban area, or were receiving palliative care had higher intensity of pain. A statistically significant difference was found in institution (p=0.00) indicating that patients from hospice had higher pain intensity (t=-3.04, p=0.00.) than those in hospice.
A statistically significant difference was found between pain intensity and age (F(2,142)=3.49, p=0.03). Post hoc-test results showed that the 41-65 age range was different than the 18-40 age range (F(2,142)=0.50, p=0.03). This indicates that 41-65 years old patients experienced higher pain intensity.
Significant differences between pain intensity and education (F(3,140)=0.05, p=0.03) were noted between patients who obtained a middle school education versus a high school education (F(2,140)=0.50, p=0.03). The group with high school graduate reported higher pain intensity than those with middle school graduates.
31
Table 10. Pain Intensity by Demographic and Disease-Related Characteristics
Characteristics Categories Pain Interference
Mean SD F/t p
Gender Male Female 3.61 3.72 1.96 2.07 0.72 0.72 0.76
Age (years) 18-40a 2.73 1.78 3.49 0.03* 41-65b 3.96 2.09 a<b >65b 3.45 1.8 Education Middle schoola 2.3 1.85 4.2 0.01*
High schoolb 4.07 2.11 a<b
College 3.6 1.78 Above college 3.88 1.32 Religion Yes 3.4 1.84 -2.49 0.01* No 4.55 2.4 Economic status (monthly income) Low 3.58 2.1 0.1 0.9 Moderate 3.75 2.09 Good 3.64 1.25
Marital Status Married 3.81 2.02 1.05 0.29
Others 3.37 2.09
Employment Employed 3.38 1.69 -1.18 0.24
Unemployed 3.83 2.12
Living area Urban area Rural area 4.04 3.02 1.82 2.22 2.96 0.00* Institution Hospital Hospice 3.45 4.73 1.99 1.89 -3.04 0.00*
Type of cancer Liver 3.23 1.77 1.42 0.23 Lung 4.13 2.05 Stomach 3.37 2.02 Cervix 3.69 2.25 Others 4.2 2.04 Stage of cancer Stage I 2.72 1.8 1 0.39 Stage II 3.6 2.41 Stage III 3.76 2.06 Stage IV 3.74 1.22 Recurrence Yes No 3.57 4.07 1.58 2.1 -2.84 0.26 Current treatment Curative 3.34 2.04 1.83 0.01*
Palliative 4.32 1.89
32
issues Yes 3.98 2.11
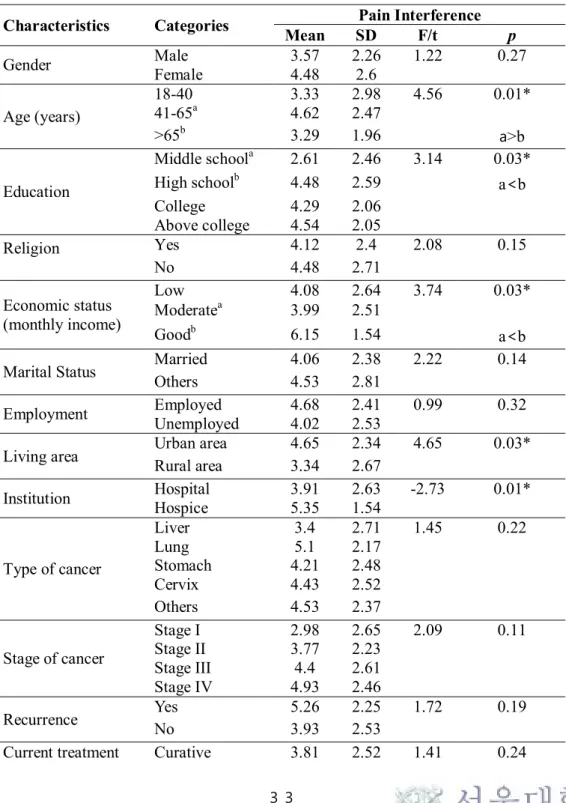
3.5 Pain Interference by Demographic and Disease-Related
Characteristics
The independent t-test revealed statistically significant differences of pain interference with living area (t=4.65, p=003) and institution (t=-2.73, p=0.01). This signifies that patients who lived in urban areas and were receiving care from hospice had higher levels of pain interferences.
Statistically significant difference between pain interference and age group (F(2,142)=4.56, p=0.01). More specifically, the 41-65 age group had a higher level of interference than the >65 age group (F(2,142)=0.54, p=0.04).
A significant difference was found in education (F(3,135)=3.13, p=0.03) indicating patients with high school education reported a higher level of interference than those with middle school education. A statistically significant difference was found in economic status, showing that patients who had high income had higher interferences than those with moderate monthly income.
There were statistically significant differences between pain interference and living area (p=0.03) and type of institution (p=0.01).
33
Table 11. Pain Interference by Demographic and Disease-Related Characteristics
Characteristics Categories Mean SD Pain Interference F/t p
Gender Male 3.57 2.26 1.22 0.27 Female 4.48 2.6 Age (years) 18-40 3.33 2.98 4.56 0.01* 41-65a 4.62 2.47 >65b 3.29 1.96 a >b Education Middle schoola 2.61 2.46 3.14 0.03*
High schoolb 4.48 2.59 a<b
College 4.29 2.06 Above college 4.54 2.05 Religion Yes 4.12 2.4 2.08 0.15 No 4.48 2.71 Economic status (monthly income) Low 4.08 2.64 3.74 0.03* Moderatea 3.99 2.51 Goodb 6.15 1.54 a<b
Marital Status Married 4.06 2.38 2.22 0.14
Others 4.53 2.81
Employment Employed 4.68 2.41 0.99 0.32
Unemployed 4.02 2.53
Living area Urban area Rural area 4.65 3.34 2.34 2.67 4.65 0.03*
Institution Hospital Hospice 3.91 5.35 2.63 1.54 -2.73 0.01*
Type of cancer Liver 3.4 2.71 1.45 0.22 Lung 5.1 2.17 Stomach 4.21 2.48 Cervix 4.43 2.52 Others 4.53 2.37 Stage of cancer Stage I 2.98 2.65 2.09 0.11 Stage II 3.77 2.23 Stage III 4.4 2.61 Stage IV 4.93 2.46 Recurrence Yes 5.26 2.25 1.72 0.19 No 3.93 2.53
34
Palliative 4.92 2.36 Any other medical
issues
No 4.2 2.53 0 0.98
Yes 4.4 2.55
3.6 Pain Management by Demographic and Disease-Related Characteristics
A statistically significant difference were found in gender (t=4.01, p=0.05), religion (t=4.12, p=0.04), and current treatment (t=5.92, p=0.02) in terms of pain management (Table 12). These findings signify that female, non-religious, curative treatment receiving patients were more inadequately treated.
There was a significant differences between pain management index and type of cancer (F(4,135)=5.92, p=0.002).. A Tukey’s post hoc test revealed that stomach cancer was significantly different than cervix cancer (p=0.008), and other cancers (p=0.002).
35
Table 12. Pain Management Index by Demographic/Disease-Related Characteristics
Characteristics Categories Pain Management Index
Mean SD F/t p
Gender Male Female -0.17 0.0 0.87 0.96 4.01 0.05*
Age (years) 18-40 0.0 0.78 0.36 0.7 41-65 -0.13 0.93 >65 -0.22 0.89 Education Middle school 0.11 0.99 0.49 0.69 High school -0.15 0.91 College -0.15 0.76 Above college -0.25 1.04 Religion Yes -0.01 0.91 4.12 0.04* No -0.24 0.99 Economic status (monthly income) Low -0.08 1.05 0.89 0.42 Moderate -0.18 0.77 Good 0.18 1.25
Marital Status Married -0.14 0.93 0.52 0.47
Others -0.06 0.96
Employment Employed -0.17 1.01 0.41 0.52
Unemployed -0.1 0.9
Living area Urban area -0.22 0.91 0.48 0.49
Rural area 0.08 0.95
Institution Hospital Hospice -0.08 -0.26 0.97 0.71 0.90 0.37
Type of cancer Liver 0.03 0.62 4.17 .00* Lung -0.43 0.79 Stomacha 0.4 0.82 a>b Cervixb -0.33 1.12 a>c Othersc -0.37 0.85 Stage of cancer Stage I 0.0 0.82 1.04 0.38 Stage II -0.13 0.9 Stage III -0.2 0.95 Stage IV 0.19 0.81 Recurrence Yes -0.12 0.73 2.28 0.13 No -0.11 0.98
Current treatment Curative -0.14 1.02 5.92 0.02* Palliative -0.06 0.76
36
issues Yes -0.22 1.05
4. Correlations among the Variables
As shown in Table 13, Pearson’s correlation analysis revealed significant relationships between anxiety and depression (r=0.66, p=0.00), anxiety and total pain intensity (r=0.17, p=004) and anxiety and total pain interference (r=0.34, p=0.00). These relationships signify that patients who had high levels of anxiety had higher levels of depression, pain intensity, and interferences.
Statistically significant correlation between depression and total interferences (r=0.29, p=0.00) signifies that patients who were more depressed had higher level of interferences.
Total BQ-II scores were significantly correlated with total pain intensity (r=0.33, p=0.00), and total pain interference, (r=0.21, p=0.00). These correlations signify that patients who had a higher level of misbelief on pain and analgesics had higher levels of pain intensity and interference. Moreover, the total BQ-II score was significantly and negatively correlated with PMI, and it signified that persons who had higher levels of misbeliefs on pain and analgesics had lower levels of PMI.
Total pain intensity was significantly and positively correlated with total pain interference (r=0.55, p=0.00), and negatively with PMI (r=-0.47, p=0.00). These findings signify that higher levels of pain intensity correlated with higher levels of pain interference and lower levels of PMI.
A significant negative correlation between PMI and total pain interference (r=-0.19, p=0.02) signifies that lower pain management index scores were related to higher levels of pain interference.
37 Table 13. Bivariate Correlations among Variables
Variables Anxiety Depression
BQ-IIa Score Pain Intensity Pain Interference PMIb r (p) Anxiety 1 0.66** 0.12 0.17* 0.34** -0.128 0.00 0.17 0.05 0.00 0.13 Depression 1 0.04 0.09 0.29** -0.08 0.66 0.26 0.00 0.33 BQ-IIa Score 1 0.33** 0.21* -0.21* 0.00 0.01 0.01 Pain Intensity 1 0.55** -0.47** 0.00 0.00 Pain Interference 1 -0.19* 0.02 PMIb 1 **. Correlation is significant at the 0.01 level (2-tailed).
*. Correlation is significant at the 0.05 level (2-tailed). a Barriers Questionnaire-II
b Pain Management Index
38
CHAPTER V. DISCUSSION
This study aimed to describe patient-related factors impacting optimal pain management among Mongolian cancer patients and to determine their correlations.
This study showed that level of anxiety (9.77 ±2.51) and the level of depression, (9.01 ±4.31) were mild in Mongolian cancer patients.
Older patients who were 41-65 years old had a higher level of anxiety than patients who were 18-40 years old. An explanation for this may be that middle-aged patients are concerned about their health more than the younger because younger people tend to heal faster than older people. As well as when people get older, their health gradually gets worse.
Of the participants in this study, lung cancer patients had statistically higher levels of depression than patients other types of cancer, which is consistent with previous studies that described lung cancer patients as experiencing greater amounts of psychological distress (Carlsen, Jensen, Jacobsen, Krasnik, & Johansen, 2005; Montazeri, Milroy, Hole, McEwen, & Gillis, 2001). Findings that people who had advanced cancer and were receiving palliative care had a higher level of depression could be explained by palliative care patients becoming more distressed at the end of life.
In the present study, the mean score of BQ-II, 2.69 (±0.63), showed moderate levels of misbeliefs on pain and analgesics. Using the same BQ-II scale, the overall mean of beliefs on pain and analgesics was 2.3 (±0.74) among Denmark patients,
39
2.5 (±0.83) in Lithuania patients and 2.5 (±0.6) in Chinese American patients (Edrington et al., 2009). As Chen et al analyzed, Asian patients are more likely to have greater concerns on tolerance, monitoring disease progress, and addiction (Chen et al., 2012), while Western patients tend to have greater concerns regarding addiction, side effects, and medication tolerance (Dawson et al., 2005; Edrington et al., 2009). However, in this study, the highest concerns were fatalism 3.27 (±0.99), tolerance 3.13 (±1.08), and monitoring disease progression 2.92 (±1.08). Interestingly, the mean scores of the lowest concern, distracting health professionals, 2.16 (±1.14) among Mongolian cancer patients, was still higher than the result of the studies in other countries. This may indicate that Mongolian cancer patients lack information or knowledge about pain and analgesics, feel afraid or that it is inappropriate to make a request of caregivers, or that a higher ratio of patients to health professionals complicates communication and treatment. Although the significant correlation between beliefs on pain and analgesics and cancer recurrence (t=11.06, p=0.00), indicated patients with cancer recurrence had fewer misbeliefs on pain and analgesics, the level of misbeliefs among them was still high.
In the present study, the mean of total pain intensity, 3.69 (±2.03), showed a mild level of pain. Significant differences of pain intensity between age (F(2,142)=3.49, p=0.03), education (F(3,140)=0.50, p=0.03), religiousness (t =
-2.491, p=0.01), living area (t=2.96, p=0.00), and current treatment (t=1.83, p=0.01), led to several considerations to reduce pain intensity of cancer patients in
Mongolia .
40
age group (F=(2,142)=3.49, p=0.03). A statistically significant difference between pain intensity and education (F(3,140)=0.50, p=0.03), was consistent with previous studies and an explanation for this could be that as patients have more information or education, they become more sensitive to their illness. Of the participants, non-religious patients had a higher degree of pain intensity than the non-religious ones. Religious patients may be more reluctant to report their pain, and their reluctance might be related to fatalistic beliefs. A number of research studies have also shown that faith (spiritual or religious beliefs) positively helps patients to cope with pain (Koenig, King, & Carson, 2012). In addition, spirituality positively impacts the quality of life of cancer patients, including at the end-of-life (Efficace & Marrone, 2002). An explanation for urban patients’ high level of pain intensity may be that they are more open to share their pain and illness with their health care professionals. Because of these differences, health professionals need to take greater care with patients who have education up to middle school, are religious, or are from a rural area in order to assess pain accurately. Palliative care patients’ higher level of pain intensity may be affected by stage of disease. This finding was consistent with previous studies (Fisch et al., 2012; van den Beuken-van Everdingen et al., 2007).
The mean of total pain interference (4.18 ±2.52), indicated that participants experienced moderate pain interference. Pain interference was different in age group, education, monthly income and living area, also requires discussion. Patients in the 41-65 age group had a higher level of interference than groups of older or younger age. One possible reason for this is that they have higher level of
41
responsibility for their family and works. Patients over 65 years old may be calmer because they have less responsibilities and more time for themselves. As well, 18-40 year old patients may have more energy to deal with pain interference
There are two possible explanations for differences in education in terms of pain interference. First, more highly educated patients may better identify their interference level of pain. In contrast, patients who are less academically prepared may lack confidence and therefore reluctant to report pain. A second reason is that more highly educated people may experience greater fear about losing their position in society and their pain disturbs their role and participation in diverse social networks. These reasons may be connected to statistically significant differences to pain interference and economic status, (F(2,140)=3.74, p=0.03). People who have lower income or higher income reported higher levels of pain interference than the people with middle income. Moreover, people with high income may require more care and attention from others. Low-income patients may worry about losing their vital income, while high-income patients may be concerned about losing their good economic status or job. Permanent living area of the participants had a significant influence on both pain intensity and pain interference. Higher levels of pain interferences in urban patients could be explained by their boarder networks and communication with others. An additional consideration is that this research was conducted in urban health care facilities, thus those who live in the urban center may be more comfortable and knowledgeable about the health care system in the city than those who come from the rural areas. It could be proved by another study that patients from rural areas stated they didn't understand the hospital system in the
42
city and were afraid to ask anyone (Battsetseg, 2016).
Previous studies showed many cancer patients experienced pain and that pain treatments were insufficient. In the present study, 50 of 140 respondents were under-treated for their pain. Pain management was different in as per statistics in gender, religion, type of cancer, and current treatment.
In addition, patients who had undertreated pain were more anxious, depressed, and had higher levels of concern about their immune system, addiction to pain medication, pain intensity, and pain interference. Several practice and research implications can be drawn from these findings. A finding that cancer pain of female participants was less well treated than that of men (p=0.05) could be explained by female patients having a high level of pain intensity related to their diagnosis. In a previous study, female patients tended to have higher levels of pain intensity and interferences with diagnoses such as cervix and breast cancers. Of the research respondents, religious patients had better pain management than non-religious patients. This may signify that spiritual care is important in surviving and overcoming cancer. A statistically significant difference between PMI and current treatment, signified that patients who were receiving curative treatment tended to be under-treated. It might be that early stage cancer patients do not have enough information on their illness and options for pain management. As well, patients who are receiving palliative care might be more resigned to deal with their pain and prescribed analgesics.
Results showing that patients with under-treated pain had higher levels of anxiety, depression, misbeliefs about their immune system and addiction, pain
43
intensity and pain interference and this demonstrates the need to develop interventions to assist patients to manage their psychological distress and to educate patients on their illness and effects of their pain medication.
As a result of correlational study, pain management was correlated with beliefs on pain and analgesics, pain intensity and pain interference.
The results of this study demonstrate the need to enhance cancer patients’ effective communication with their health professionals, provide more information to patients about their illness and pain, and teach them ways to manage impacting factors in order to attain optimal pain management.
This study has two limitations. First, this descriptive study was limited by convenience sampling. Second, the PMI was computed from patient’s reports of pain medication use. Data were collected on drug type but not drug dose. The PMI does not take into consideration to adjuvant medications or non-pharmacologic approaches. The PMI didn’t assess the adequacy of prescribed analgesics.
44
CHAPTER VI. CONCLUSION
This is the first known study to evaluate patient-related factors to pain management among Mongolian cancer patients. Data from a convenience sample of 145 cancer patients were collected from 3 hospitals and 3 hospices.
Summary of major findings includes:
1. Of participants, the majority of the participants were female, 97 (66.9%); held secondary education, 78 (53.8%); were religious (57.2%); and were married, 107 (73.8%). Although many identified themselves as having a moderate economic level (62.8%), 106 participants (73.1%) were
unemployed. The majority (62.1%) of the participants lived in urban areas. The most common types of cancer were liver, n=38 (26.2%), and cervix, n=31 (21.4%). Of them, 69 (47.6%) patients were at stage-III and 31 (21.4%) were at stage-II. Cancer had reoccurred in 26 (17.9%) participants. Ninety-three (64.1%) patients were taking curative treatment. Twenty-seven (18.6%) had other medical issues.
2. The total mean of anxiety was 9.77 (±2.51). Patients who were in the 41-65 age group were more anxious, p=0.00.
3. The total mean of depression was 9.01 (±4.31). Lung cancer patients had higher levels of depression, p=0.05. A statistically significant difference (F(3,130)=6.25, p=0.00), was revealed between depression and cancer stage.
45
Patients who were receiving palliative treatment had a higher level of depression (p=0.05).
4. The total mean of the misbeliefs on pain and analgesics was 2.69 (±0.63). The highest concerns were fatalism 3.27 (±0.99) and tolerance 3.13 (±1.08). Patients with cancer recurrence had a lower level of misconception on pain and analgesics.
5. The mean of total intensity was 3.69 (±2.03). Patients who were in the 41-65 age group (F(2,142)=0.50, p=0.03), held high school education
(F(3,140)=0.50, p=0.03), were non-religious (t=-2.491, p=0.01), lived in
an urban area (t=2.96, p=0.00), or were receiving palliative care (t=1.83,
p=0.01), had higher intensity of pain.
6. The mean of total interference was 4.14 (±2.52). Patients who were in the 41-65 age group (F(2,142)=4.56, p=0.01), held higher education (F(3,135)=3.13, p=0.00), had high income (F(2,140)=0.80, p=002), and lived in an urban area (F(1,140)=4.65, p=003), had higher interference of pain with actions.
7. Of the participants, fifty (43.4%) were under-treated for pain control. Patients whose pain was under-treated had higher levels of anxiety (t=2.92,
p=0.00), depression (t=2.49, p=0.01), misconceptions about their immune
system (t=1.95, p=0.05) and addictions (t=2.44, p=0.02), pain intensity (t=4.41, p=0.00), and interference(t=2.46, p=0.02). Statistically significant differences between pain management index and gender (t=4.01, p=0.05)