Original Paper
This article is licensed under the Creative Commons Attribution-NonCommercial-NoDerivatives 4.0 Interna-tional License (CC BY-NC-ND) (http://www.karger.com/Services/OpenAccessLicense). Usage and distribution for commercial purposes as well as any distribution of modified material requires written permission.
© 2016 The Author(s) Published by S. Karger AG, Basel
Catholic Kwandong University, International St. Mary’s Hospital, Incheon Metropolitan City, 404-834, (Republic of Korea)
E-Mail kchwang@cku.ac.kr / doctor7408@gmail.com Ki-Chul Hwang and Sang Woo Kim
Proteomic Analysis and Identification of
Paracrine Factors in Mesenchymal Stem
Cell-Conditioned Media under Hypoxia
Suk-Won Songa Kyung-Eun Kimb Jung-Won Choic,d Chang Youn Leee Jiyun Leef
Hyang-Hee Seof Kyu Hee Limg Soyeon Limc,d Seahyong Leec,d Sang Woo Kimc,d
Ki-Chul Hwangc,d
aDepartment of Cardiovascular Surgery, Gangnam Severance Hospital, Yonsei University College of Medicine, Seoul, bDepartment of Pediatric Cardiology, CHA Gumi Medical Center, CHA University, Gumi, cCatholic Kwandong University, International St. Mary’s Hospital, Incheon Metropolitan City, dInstitute for Bio-Medical Convergence, College of Medicine, Catholic Kwandong University, Gangneung-si, eDepartment of Integrated Omics for Biomedical Sciences, Graduate School, Yonsei University, Seoul, fBrain Korea 21 PLUS Project for Medical Science, Yonsei University College of Medicine, Seoul, gDepartment of Veterinary Physiology, College of Veterinary Medicine, Biosafety Research Institute, Chonbuk National University, Jeonju City, Republic of Korea
Key Words
Bone marrow-derived rat mesenchymal stem cells • Hypoxia • Cardiomyocyte differentiation • Two-dimensional electrophoresis • Network analysis
Abstract
Background/Aims: We previously showed that a hypoxic environment modulates the
antiarrhythmic potential of mesenchymal stem cells. Methods: To investigate the mechanism by which secreted proteins contribute to the pathogenesis of antiarrhythmic potential in mesenchymal stem cells, we used two-dimensional electrophoresis combined with MALDI-TOF-MS to perform a proteomic analysis to compare the paracrine media produced by normoxic and hypoxic cells. Results: The proteomic analysis revealed that 66 protein spots out of a total of 231 matched spots indicated differential expression between the normoxic and hypoxic conditioned media of mesenchymal stem cells. Interestingly, two tropomyosin isoforms were dramatically increased in the hypoxic conditioned medium of mesenchymal stem cells. An increase in tropomyosin was confirmed using Western blot to analyze the conditioned media between normoxic and hypoxic cells. In a network analysis based on gene ontology (GO) Molecular Function by GeneMANIA analysis, most of the identified proteins were found to be involved in the regulation of heart processes. Conclusion: Our results show that hypoxia up-regulates tropomyosin and other secreted proteins which suggests that tropomyosin may be involved in regulating proarrhythmic and antiarrhythmic functions.
Introduction
Mesenchymal stem cells (MSCs) exhibit tissue healing capabilities and therefore are considered a promising tool with clinical implications in cell-based applications for cardiac therapeutics [1-7]. Moreover, recent studies have suggested that MSCs exert their therapeutic effects by secreting factors that affect the regulation of angiogenesis and immune responses and that protect tissues and reduce inflammation in presence of ischemic tissue injury [8, 9]. The use of these paracrine factors, which are secreted into the conditioned medium (CM) by MSCs, has emerged as an alternative approach for MSC-based therapies to treat various diseases, including myocardial infarction (MI) [10-13]. Our previous study showed that the factors that are released from MSCs under hypoxic conditions ameliorate the induction of ventricular arrhythmias after MI by preventing apoptosis and thereby accelerating functional recovery [14]. However, little is known about how environmental conditions affect the potential roles of stem cells, and it is necessary to identify proteins that might serve as novel indicators of cellular recovery [15].
To obtain a more comprehensive understanding of the efficacy of secretome-based therapeutics, proteomic techniques and their applications have emerged as large-scale screening tools to both create a protein profile and identify protein functions [16, 17]. The most widely used method for identifying protein complexes is two-dimensional gel electrophoresis (2-DE), by which proteins are separated and then identified using mass spectrometry. Despite the limitations that are associated with 2-DE, such as the difficulty in analyzing proteins with extreme molecular weights or isoelectric points, 2-DE remains a powerful technique that can be used to separate post-translational modifications and specific protein isoforms [18]. Moreover, 2-DE has been used to compare the cellular protein profiles of MSCs that originate in a variety of tissues and to study senescence in prolonged MSC cell cultures [19-21]. Recently, MSC-CMs and exosomes have become the subject of proteomic profiling, which has been used to identify released factors that might have applications in regenerative medicine [18, 22].
In support of our previous finding [14], this study was performed to determine whether proteomes from MSC-CMs that were affected by hypoxia contain therapeutic factors that could contribute to improving arrhythmogenicity in rats with MI.
Materials and Methods
Rat mesenchymal stem cell cultures
Rat MSCs (rMSCs) were obtained from bone marrow (BM) as previously described [23]. All procedures were approved by the Institutional Animal Care and Use Committee of the Incheon Catholic University Medical School. Bone marrow was obtained from rat femurs and tibias into PBS (HyClone, Logan, UT, USA) containing 2% fetal bovine serum (FBS; HyClone). Mononuclear cells were isolated using density gradient centrifugation (Ficoll-Paque Plus; GE Healthcare, Sweden) for 30 min at 1,000 ×g. The cells were then suspended in fresh Dulbecco’s Modified Eagle’s Media (DMEM; HyClone) containing 20% FBS, plated at a density of 7 × 10⁵ cells/well and incubated in a humidified atmosphere of 5% CO
2 at 37°C.
Preparation of normoxic and hypoxic conditioned medium
Normoxic conditioned medium (NCM) and hypoxic conditioned medium (HCM) were obtained as previously reported [14]. rMSCs (1 × 10⁶ cells) at 80% confluence were pre-washed twice with serum-free medium (SFM) and then incubated with new SFM under normoxic and hypoxic conditions for 12 h. To induce hypoxic conditions, the rMSCs were incubated at 37°C in 5% CO2, 5% H2 and 0.5% O2 in a chamber with an anaerobic atmosphere system (Technomart, Korea). The CM was collected after 12 h of incubation from cells grown under both normoxic and hypoxic conditions, and the cell debris was then removed via centrifugation for 30 min at 1,000 ×g at 4°C.
Preparation of protein samples for 2-DE
For 2-DE analysis, the CM from the cells was centrifuged to remove cell debris and then concentrated using a Vivaspin Turbo 15 (Sartorius). Proteins were isolated from the phenol-ethanol supernatant layer that was left over after the DNA precipitation step, which was performed using TRIZOL Reagent (Life Technologies, Frederick, Maryland, USA). The proteins were then extracted from the concentrated medium using ethanol precipitation. The precipitated proteins were dissolved in rehydration buffer solution containing 7 M urea, 2 M thiourea, 4% CHAPS, 20 mM DTT, 1 mM PMSF, 2% IPG buffer (Bio-Rad, Hercules, CA, USA), and a trace of bromophenol blue. The protein was then stored at -80 oC until analysis. Protein content was determined using Bradford protein assays (Bio-Rad).
2-DE
Each 2-DE was performed in triplicate using protein samples (30 µg per gel) that were obtained from NCM and HCM. Immobilized pH gradient (IPG)-isoelectric focusing (IEF) of the protein samples was performed using pH 3-10, 18 cm IPG DryStrips (GE Healthcare, Buckinghamshire, UK) in a EttanTMIPGphorTM 3 (GE Healthcare) using the protocol recommended by the manufacturer. The IPG strips were passively rehydrated for 12 h in strip holders with 340 µL of DeStreak Rehydration Solution (GE Healthcare) that included 30 µg of protein for each sample. IEF was executed in advanced mode protocol, as follows: 1 h at 500 V, 3 h at 1,000 V, and 6 h at 7,000 V, and it was then held at 7,000 V until it reached 115 KVh. The gel strips were then placed onto a 12% polyacrylamide gel for resolution along the second dimension, which was performed using an Etthan DALTsix apparatus. Fractionations were performed according to the manufacturer’s instructions. A total of six gels, including three gels containing separated proteins per group, were visualized using silver staining and submitted to image analysis and peptide mass fingerprinting (PMF) [24].
Image acquisition and data analysis
The gels were imaged using a UMAX PowerLook 1120 (Maxium Technologies, Akron, OH, USA), and modified ImageMaster 2-D software V4.95 (GE Healthcare) was used to compare the images. A reference gel was selected from the gels in the control group, and spots detected on other gels were matched to those in the reference gel. Relative optical densities and relative volumes were calculated to correct for differences in in-gel staining. The intensity volume of each spot was processed using background subtraction and total spot volume normalization, and the resulting spot volume percentage was used for comparisons.
Protein identification
To identify the proteins using PMF, the protein spots were excised, digested with trypsin (Promega, Madison, WI, USA), mixed with CHCA in 50% ACN/0.1% TFA, and subjected to MALDI-TOF analysis (Microflex LRF 20, Bruker Daltonics). Spectra were collected from 300 shots per spectrum over an m/z range of 600-3000 and calibrated using two-point internal calibration of trypsin auto-digested peaks (m/z 842.5099, 2211.1046). A peak list was generated using Flex Analysis (version 3.0). The threshold that was used to select the peaks was determined as previously described [25]. Protein scores were calculated as -10 * Log (p), where p was the probability that the observed match was a random event, and a score greater than 61 was defined as significant (p < 0.05).
Immunoblot analysis
Immunoblot analyses were performed as previously described [25]. Briefly, the membranes were rinsed three times with TBS-T buffer and then incubated for 1 h with 1:500~1000 dilutions of primary antibodies against HIF-1α, TPM, or β-actin (Santa Cruz Biotechnology, Santa Cruz, CA, USA) in TBS-T buffer containing 1% skim milk. After three more washes, the membranes were incubated for 1 h with horseradish peroxidase-conjugated anti-goat IgG or anti-rabbit IgG secondary antibodies (1:2000, Santa Cruz Biotechnology) in TBS-T buffer containing 5% skim milk. Development was performed using enhanced chemiluminescence (ECL Western Blotting Detection Kit, GE Healthcare). The band intensities were quantified using ImageJ software (NIH).
Transient knockdown of Hif1a
To knockdown (KD) Hif1a, target-specific commercial AccuTarget siRNAs (BIONEER, Daejeon, Korea) (siRNA no. 1654508: sense (5’-3’), CAGUUACGAUUGUGAAGUU (dTdT); antisense (5’-3’),
AACUUCACAAUCGUAACU G (dTdT)) were designed to KD Hif1a gene expression and negative control was used. The rMSCs (1 × 10⁶ cells per dish in a 10 mm dish) were transiently transfected with the siRNA (100 nM per dish) and agent (45 μl per dish) using the TransIT-X2 Dynamic Delivery System (Mirus Bio LLC, Madison, WI, USA), and gene expression levels were then examined in cells that were cultured for an additional 24 h. The level of each gene transcript was normalized to the level of the Gapdh transcript.
Network analysis
To predict genetic interactions between Ca2+-regulatory markers and the interacting partner proteins that were identified in this study we used a predictive web interface, GeneMANIA (http://www.genemania. org). This interface generates a list of genes that have functional similarity based on data obtained from currently available genomics and proteomics databases. The GeneMANIA algorithm contains two import components: a linear regression-based algorithm that is used to calculate a single, composite functional association network from multiple networks that were derived from different proteomic or genomic data sources and a component that predicts gene functions [26].
Real-time RT-PCR
The level of each gene transcript was quantitatively determined using a StepOnePlus Real-Time PCR System (Applied Biosystems, Foster City, CA, USA). Total RNA was isolated from MSCs using TRIZOL reagent (Invitrogen), and reverse-transcription was performed using a Maxime RT Premix kit (iNtRON Biotechnology, Seongnam, Korea). A SYBR Green Dye system (SYBR Premix Ex Taq (Tli RNase Plus) with a ROX reference dye (TAKARA Bio INC. Foster City, CA, USA) was used to perform real-time RT-PCR. The level of each gene transcript (Hif1a, Tpm1, and Tpm2) was normalized to Gapdh transcript levels, and relative changes in gene expression were quantified using the ∆∆CT method [27]. Oligonucleotide primers were used to isolate Hif1a (forward primer (F), 5’-AGCAATTCTCCAAGCCCTCC-3’; reverse primer (R), 5’-TTCATCAGTGGTGGCAGTTG-3’), Tpm1 (F, 5’-GGGCTGAGTTTGCAGAGAGA-3’; R, 5’-AGCTCAGAGAGGTGGGACAT-3’), and Tpm2 (F, 5’-GCCAAGGAAGAGAACGTGG A-3’; R, 5’-TGTAGTCTGGTCGGCAGGTA-3’).
Immunofluorescence analysis
To investigate the expression patterns of the target proteins in MSCs, the cells were grown on cell culture slides (SPL, Pocheon-si, Korea) and then fixed with 4% formaldehyde. They were then washed with PBS and subjected to permeabilization in 0.25% Triton X-100 (Sigma-Aldrich, St. Louis, MO, USA). The cell slides were washed with PBS three times, blocked with 1% BSA in PBS-T for 1 h, and then incubated with polyclonal anti-TPM antibody (1:100 dilution) or anti-NOS3 antibody (1:100) (Santa Cruz Biotechnology) overnight at 4°C. They were then washed three times with PBS. The cell slides were then incubated with FITC-conjugated goat secondary antibody (1:500 dilutions) against TPM or rhodamine-conjugated rabbit secondary antibody (1:500 dilutions) against NOS3. DAPI (Sigma-Aldrich) was used to stain cell nuclei. The prepared slides were observed using a confocal laser scanning microscope LSM700 (Carl Zeiss, Oberkochen, Germany). Acquisition of the images was performed using Zen black or blue software (Carl Zeiss).
Co-immunoprecipitation (Co-IP)
To identify TPM-interacting partner proteins in MSCs and MSC-CMs under normoxia and hypoxia, Co-IP was performed with slight modifications as outlined in previous protocol [24]. Input proteins containing 500 µg of protein were incubated with 15 μl of anti-TPM antibody (Santa Cruz Biotechnology) at 4°C for 3 h on a rotary shaker, after which 20 μl of A/G PLUS agarose conjugate suspension (Santa Cruz Biotechnology) was added and allowed to mix at 4°C for 12 h on a rotary shaker. After centrifugation at 1000 ×g for 5 min at 4°C, the supernatant was collected and the beads washed three times with RIPA buffer (Sigma). Then, 2× Laemmli buffer was added and boiled for 5 min. For the negative control sample, control goat IgG (Santa Cruz Biotechnology) was used. After Co-IP, all samples were separated by 8-12% SDS-PAGE, after which samples were transferred to a PVDF for immunoblot analysis.
Statistical analysis
All experimental results were compared using One-way Analysis of Variance (ANOVA) in the Statistical Package of Social Science (SPSS, version 17) program. The data are expressed as the mean ± SEM. A protected
least-significant difference (LSD) test, which is a method for analyzing multiple comparisons that consist of single-step procedures in One-way ANOVA, was used to identify significant differences between means (p<0.05).
Results
Differential expression of the NCM and HCM proteins
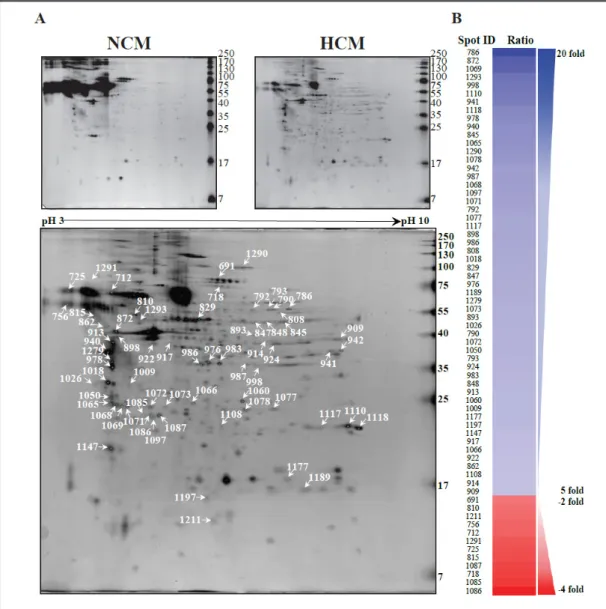
To compare the protein expression profiles of normoxic and hypoxic rMSCs-CMs with that of SFM, BM-MSCs were prepared and characterized using MSC surface markers [23]. The conditioned medium was then collected, and cell residues were removed using centrifugation. Large volumes of conditioned medium were concentrated using centrifugal filtration units containing 3 kDa molecular weight cut-off membranes [14]. The NCM and HCM protein samples were separated using 2-DE and identified using MALDI-TOF-MS. From 7 to 250 kDa and between pH 3-10, a total of 231 matched spots were differentially expressed between NCM and HCM obtained from MSCs (Fig. 1A). Sixty-six spots were identified
Fig. 1. Representative silver-stained two-dimensional gel (2-DE) images. (A) Spots that showed differential
expression are indicated with arrows in the 2-DE image, (B) The expression patterns of MSC-CM proteins in cells exposed to normoxic and hypoxic conditions.
that showed statistically different intensities between the NCM and HCM samples. These differentially altered spots indicate dramatic changes in the responses of these markers to hypoxic conditions. Most of the spots were up-regulated in the HCM samples. Among the differentially expressed spots, 54 spots were dramatically up-regulated (≥5-fold), whereas 12 spots were down-regulated (≤-2-fold) in the HCM sample (Fig. 1B). According to MALDI-TOF identification the proteins that were up-regulated in HCM included endoplasmin precursor, tropomyosin 1, tropomyosin 2, annexin A1, transgelin, and nucleoside diphosphate kinase B. In contrast, two proteins (secretogranin-3 and hemiferrin) were expressed at lower levels in HCM than in NCM (Table 1). Interestingly, among the modulated spots, spots 940, 978, and 1018 were identified as tropomyosin isoforms (TPM1 and 2). Additionally, these proteins were highly expressed in both hypoxic MSCs and their conditioned media (Fig. 2). Our results provide the first evidence demonstrating the differential expression of tropomyosin isoforms in MSCs in response to hypoxia. These results suggest the possibility that the tropomyosin isoforms that are secreted by MSCs into the CM in response to hypoxia have the potential to assist recovery from the myocardial damage that is associated with infarction via a troponin-tropomyosin-like system [14, 28, 29]. These proteins were not described as secreted molecules in MSCs but could be induced to be released via the secretion of extracellular vesicles or exosomes. Accordingly, we next focused our interest on performing further protein validation studies of tropomyosin.
Expression of tropomyosin isoforms response to hypoxia
Under hypoxic conditions, Hif1a is a key transcriptional regulatory factor that regulates many genes at the transcriptional level. To determine the relationship between HIF-1α and TPM expression, we confirmed that Hif1a/HIF-1α and Tpm1,2/TPM were expressed in MSCs Table 1. List of identified proteins that showed differential expression between NMX and HPX MSC-CMs
Fig. 2. The TPM isoforms found
to be differentially expressed in 2-DE between NCM and HCM. (A) Two-dimensional images of the proteomes of MSC-CM and MSC under hypoxic conditions, (B) Spot images (3D view in the lower pa-nel) of TPM isoforms between NCM and HCM.
and MSCs-CM under normoxic and hypoxic conditions (Fig. 3A, B). The results showed that under hypoxic conditions, HIF-1α up-regulated TPM at the protein expression level but not the transcriptional level. In addition, MSCs in which Hif1a was knocked down were studied to evaluate the role of Hif1a/HIF-1α in regulating Tpm1,2/TPM (Fig. 3C). We found that the expression level of TPM was significantly up-regulated under hypoxic conditions and that TPM levels were significantly down-regulated when Hif1a was knocked down in both MSCs and MSC-CMs.
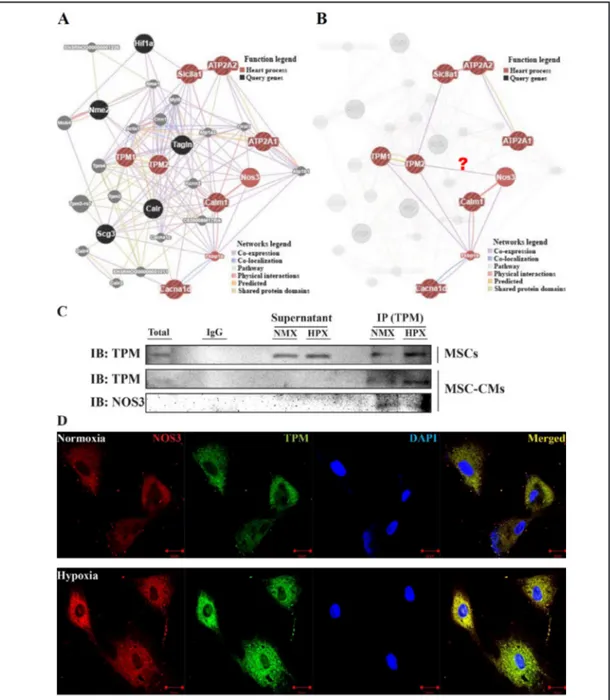
Distinct expression of proteins involved in heart processes according to network analysis
We next used in silico analysis to investigate the genetic interactions of proteins. The identified and candidate proteins were classified according to gene ontology entries in GeneMANIA. The GeneMANIA analysis predicted a potential interaction between all identified proteins and Ca2+-regulatory markers (Fig. 4A). Based on the result of this network analysis, the function-based interaction between Tpm2 with Nos3 is shown in Fig. 4B. The GeneMANIA analysis showed that TPM interacts with NOS3. Therefore, to verify the possibility of such an interaction, anti-TPM antibody was used to perform immunoblotting for NOS3 and TPM against MSC-CM proteins (Fig. 4C). The Interaction between TPM and NOS3 was then further validated in MSCs using dual-fluorescent staining (Fig. 4D). This result suggests that NOS3 interacts with TPM expression, indicating that NOS3 plays an important role in regulating TPM expression in MSCs under hypoxic conditions and that this protein is likely to prevent an arrhythmogenicity effect.
Discussion
In the present study, we used 2-DE combined with MALDI-TOF to show that TPM isoforms were differentially expressed and that multiple proteins were released from hypoxia-treated MSCs. We then tested the hypothesis that TPM isoforms are secreted into Fig. 3. The effect of hypoxia on Hif1a and Tpm1/Tpm2 levels in MSCs was analyzed between NCM and
HCM. (A) The mRNA levels of Hif1a and Tpm1/Tpm2 were normalized to the Gapdh control in MSC, (B) The expression levels of HIF-1α and TPM in the immunoblot analysis, (C) TPM expression levels after inhibition of Hif1a with siRNA. The statistical significance between the negative control siRNA (NC) and the Hif1a siR-NA-induced knock-down (KD) groups was determined using a One-way ANOVA test, where * p < 0.05 and ** p < 0.001. The data represent the mean ± SD (n=3).
CM using immunoprecipitation and western blot analyses. To investigate the interactions between proteins, we performed a network analysis using GeneMANIA and the network predicted a potential interaction between TPM and NOS3 that was based on the gene ontology (GO) Molecular Function. Finally, we confirmed the previously observed TPM and NOS3 expression levels in MSCs and MSC-CMs using co-immunoprecipitation assays and dual-fluorescent staining.
Fig. 4. The networks that were generated in the GeneMANIA analysis between NCM and HCM. (A) The
GeneMANIA results for the molecular function-based relationship between TPM and Ca2+-regulatory pro-teins, (B) predicted that nine of the targets belonged to heart processes in GeneMANIA, (C) The interaction between TPM and NOS3 in MSC-CMs was validated using co-immunoprecipitation, (D) The interactions between target proteins (TPM and NOS3) were validated by analyzing co-localization in MSCs exposed to normoxic and hypoxic conditions. The sections were observed at 400× magnification, and the scale bar represents 20 µm.
Normally, the presence and function of actin in the nuclei of a wide variety of cell types have been extensively debated, while the presence of cardiac troponin and TPM in the nuclei of cardiac myocytes has recently been recognized in human and rats [29-31]. TPMs exist in both muscle and non-muscle isoforms. Non-muscle TPMs regulate the actin cytoskeleton independently of troponin and are involved in a variety of cellular events that regulate cell shape and motility [32]. In some reports, TPM isoforms have also been observed on the outside of cells, and cell culture experiments have demonstrated the presence of TPM on the surface of various cells that were derived from the colon, including primary cultures of colonic epithelial cells [33]. Our studies suggest that TPM1 and TPM2 are probably located in extracellular vesicles that are derived from multiple cell and tissue types [34-37]. These proteins are not generally known as secreted molecules of MSCs, but they could be released via the secretion of extracellular vesicles or exosomes in response to hypoxia.
Exposure to hypoxia results in alterations in the metabolic properties of cells, but hypoxic cells adapt to maintain their structure and vital functions. A recent study demonstrated that the activation of cardiac fibroblasts was inhibited in leptin-deficient MSCs exposed to hypoxia [34]. The authors found that co-cultured MSCs showed decreased fibroblast activation and that preconditioning the cells with hypoxia enhanced these effects. HIF-1α plays an important role in the adaptive response of cells to hypoxia [35]. Our previous study suggested that hypoxia preconditioned MSCs were regulated by the transcription factor HIF-1α, which produced alterations in Ca2+ homeostasis [14]. In this study, we found that hypoxia stimulated the expression of TPM proteins. We also found that this change in expression occurred via an HIF-1α-dependent pathway by knocking down Hif1a expression in MSCs under normoxic or hypoxic conditions. However, the relationship between HIF-1α and TPM remains unclear. Further investigation will therefore be needed.
We found that TPM interacts with NOS3 based on gene ontology (GO) Molecular Functions in GeneMANIA network analysis. This result suggests that HCM facilitates the effects of MSCs by activating NOS3, which is known to protect against ischemic injury [37]. A recent study demonstrated that statins enhanced the therapeutic efficacy of MSC-transplantations in a swine model of acute MI by activating NOS3 [37]. They suggested that the success of a stem cell therapy could depend upon its “paracrine” effects and may be further enhanced by prolonging the survival and retention of the transplanted cells. Our study also provides evidence showing that HCM may improve survival in stem cells and contribute to cardiac functional recovery.
In summary, the present study is the first to demonstrate that extracellular TPM isoforms are preferentially expressed in MSCs under hypoxic conditions. Hypoxia stimulates the expression of TPM isoforms via a Hif1a-dependent mechanism. Our results suggest that the up-regulation of TPM and other secreted proteins may facilitate cardiac repairs after MI by enhancing the paracrine activities of MSC-CMs during hypoxia.
Abbreviations
2-DE (two-dimensional electrophoresis); HCM (hypoxic conditioned medium); HIF-1α (hypoxia-inducible factor 1-alpha); HPX (hypoxia); MI (myocardial infarction); MSCs (mesenchymal stem cells); NCM (normoxic conditioned medium); NMX (normoxia); NOS3 (nitric oxide synthase 3); SFM (serum-free medium); TPM (tropomyosin).
Acknowledgements
This study was supported by a Korea Science and Engineering Foundation grant funded by the Korean government (MEST) (2015M3A9E6029519 and NRF-2015M3A9E6029598).
Disclosure Statement
The authors declare that they have no conflicts of interest. References
1 Prockop DJ: Marrow stromal cells as stem cells for nonhematopoietic tissues. Science 1997;276:71-74. 2 Pittenger MF, Martin BJ: Mesenchymal stem cells and their potential as cardiac therapeutics. Circ Res
2004;95:9-20.
3 Zhang J, Wu Y, Chen A, Zhao Q: Mesenchymal stem cells promote cardiac muscle repair via enhanced neovascularization. Cell Physiol Biochem 2015;35:1219-1229.
4 Gong X, Fan G, Wang W, Wang G: Trimetazidine protects unbilical cord mesenchymal stem cells against hypoxia and serum deprivation induced apoptosis by activation of Akt. Cell Physiol Biochem 2014;34:2245-2255.
5 Wang XM, Yang YJ, Wu YJ, Zhang Q, Qian HY: Attenuating hypoxia-induced apoptosis and autophagy of mesenchymal stem cells: the potential of sitagliptin in stem cell-based therapy. Cell Physiol Biochem 2015;37:1914-1926.
6 Sun Y, Li QF, Yan J, Hu R, Jiang H: Isoflurane preconditioning promotes the survival and migration of bone marrow stromal cells. Cell Physiol Biochem 2015;36:1331-1345.
7 Choi JW, Kim KE, Lee CY, Lee J, Seo HH, Lim KH, Choi E, Lim S, Lee S, Kim SW, Hwang KC: Alterations in cardiomyocyte differentiation-related proteins in rat mesenchymal stem cells exposed to hypoxia. Cell Physiol Biochem 2016;39:1595-1607.
8 Ranganath SH, Levy O, Inamdar MS, Karp JM: Harnessing the mesenchymal stem cell secretome for the treatment of cardiovascular disease. Cell Stem Cell 2012;10:244-258.
9 Teng X, Chen L, Chen W, Yang J, Yang Z, Shen Z. Mesenchymal stem cell-derived exosomes improve the microenvironment of infarcted myocardium contributing to angiogenesis and anti-inflammation. Cell Physiol Biochem 2015;37:2415-2424.
10 Chen L, Tredget EE, Wu PY, Wu Y: Paracrine factors of mesenchymal stem cells recruit macrophages and endothelial lineage cells and enhance wound healing. PLoS One 2008;3:e1886.
11 Kinnaird T, Stabile E, Burnett MS, Shou M, Lee CW, Barr S, Fuchs S, Epstein SE: Local delivery of marrow-derived stromal cells augments collateral perfusion through paracrine mechanisms. Circulation 2004;109:1543-1549.
12 Chen L, Xu Y, Zhao J, Zhang Z, Yang R, Xie J, Liu X, Qi S: Conditioned medium from hypoxic bone marrow-derived mesenchymal stem cells enhances wound healing in mice. PLoS One 2014;9:e96161.
13 Timmers L, Lim SK, Hoefer IE, Arslan F, Lai RC, van Oorschot AA, Goumans MJ, Strijder C, Sze SK, Choo A, Piek JJ, Doevendans PA, Pasterkamp G, de Kleijn DP: Human mesenchymal stem cell-conditioned medium improves cardiac function following myocardial infarction. Stem Cell Res 2011;6:206-214.
14 Hwang HJ, Chang W, Song BW, Song H, Cha MJ, Kim IK, Lim S, Choi EJ, Ham O, Lee SY, Shim J, Joung B, Pak HN, Kim SS, Choi BR, Jang Y, Lee MH, Hwang KC: Antiarrhythmic potential of mesenchymal stem cell is modulated by hypoxic environment. J Am Coll Cardiol 2012;60:1698-1706.
15 Maurer MH: Proteomic definitions of mesenchymal stem cells. Stem Cells Int 2011;2011:704256. 16 Celebi B, Elcin YM: Proteome analysis of rat bone marrow mesenchymal stem cell subcultures. J Proteome
Res 2009;8:2164-2172.
17 Celebi B, Elcin AE, Elcin YM: Proteome analysis of rat bone marrow mesenchymal stem cell differentiation. J Proteome Res 2010;9:5217-5227.
18 Kupcova Skalnikova H: Proteomic techniques for characterisation of mesenchymal stem cell secretome. Biochimie 2013;95:2196-2211.
19 Kim J, Shin JM, Jeon YJ, Chung HM, Chae JI: Proteomic validation of multifunctional molecules in mesenchymal stem cells derived from human bone marrow, umbilical cord blood and peripheral blood. PLoS One 2012;7:e32350.
20 Miranda HC, Herai RH, Thome CH, Gomes GG, Panepucci RA, Orellana MD, Covas DT, Muotri AR, Greene LJ, Faca VM: A quantitative proteomic and transcriptomic comparison of human mesenchymal stem cells from bone marrow and umbilical cord vein. Proteomics 2012;12:2607-2617.
21 Madeira A, da Silva CL, dos Santos F, Camafeita E, Cabral JM, Sa-Correia I: Human mesenchymal stem cell expression program upon extended ex-vivo cultivation, as revealed by 2-DE-based quantitative proteomics. PLoS One 2012;7:e43523.
22 Lai RC, Tan SS, Teh BJ, Sze SK, Arslan F, de Kleijn DP, Choo A, Lim SK: Proteolytic Potential of the MSC Exosome Proteome: Implications for an Exosome-Mediated Delivery of Therapeutic Proteasome. Int J Proteomics 2012;2012:971907.
23 Chang W, Song BW, Lim S, Song H, Shim CY, Cha MJ, Ahn DH, Jung YG, Lee DH, Chung JH, Choi KD, Lee SK, Chung N, Lee SK, Jang Y, Hwang KC: Mesenchymal stem cells pretreated with delivered Hph-1-Hsp70 protein are protected from hypoxia-mediated cell death and rescue heart functions from myocardial injury. Stem Cells 2009;27:2283-2292.
24 Kim SW, Choi JH, Mukherjee R, Hwang KC, Yun JW: Proteomic identification of fat-browning markers in cultured white adipocytes treated with curcumin. Mol Cell Biochem 2016;415:51-66.
25 Kim SW, Park TJ, Choi JH, Aseer KR, Choi JY, Kim YJ, Choi MS, Yun JW: Differential protein expression in white adipose tissue from obesity-prone and obesity-resistant mice in response to high fat diet and anti-obesity herbal medicines. Cell Physiol Biochem 2015;35:1482-1498.
26 Warde-Farley D, Donaldson SL, Comes O, Zuberi K, Badrawi R, Chao P, Franz M, Grouios C, Kazi F, Lopes CT, Maitland A, Mostafavi S, Montojo J, Shao Q, Wright G, Bader GD, Morris Q: The GeneMANIA prediction server: biological network integration for gene prioritization and predicting gene function. Nucleic Acids Res 2010;38:W214- W220.
27 Livak KJ, Schmittgen TD: Analysis of relative gene expression data using real-time quantitative PCR and the 2(-Delta Delta C(T)) Method. Methods 2001;25:402-408.
28 Ma L, Bradu A, Podoleanu AG, Bloor JW: Arrhythmia caused by a Drosophila tropomyosin mutation is revealed using a novel optical coherence tomography instrument. PLoS One 2010;5:e14348. 29 Asumda FZ, Chase PB: Nuclear cardiac troponin and tropomyosin are expressed early in cardiac
differentiation of rat mesenchymal stem cells. Differentiation 2012;83:106-115.
30 Bergmann O, Bhardwaj RD, Bernard S, Zdunek S, Barnabe-Heider F, Walsh S, Zupicich J, Alkass K, Buchholz BA, Druid H, Jovinge S, Frisen J: Evidence for cardiomyocyte renewal in humans. Science 2009;324:98-102. 31 Kajstura J, Urbanek K, Perl S, Hosoda T, Zheng H, Ogorek B, Ferreira-Martins J, Goichberg P, Rondon-Clavo
C, Sanada F, D'Amario D, Rota M, Del Monte F, Orlic D, Tisdale J, Leri A, Anversa P: Cardiomyogenesis in the adult human heart. Circ Res 2010;107:305-315.
32 Lin JJ, Warren KS, Wamboldt DD, Wang T, Lin JL: Tropomyosin isoforms in nonmuscle cells. Int Rev Cytol 1997;170:1-38.
33 Kesari KV, Yoshizaki N, Geng X, Lin JJ, Das KM: Externalization of tropomyosin isoform 5 in colon epithelial cells. Clin Exp Immunol 1999;118:219-227.
34 Chen P, Wu R, Zhu W, Jiang Z, Xu Y, Chen H, Zhang Z, Chen H, Zhang L, Yu H, Wang J, Hu X: Hypoxia preconditioned mesenchymal stem cells prevent cardiac fibroblast activation and collagen production via leptin. PLoS One 2014;9:e103587.
35 Jiang C, Sun J, Dai Y, Cao P, Zhang L, Peng S, Zhou Y, Li G, Tang J, Xiang J: HIF-1A and C/EBPs transcriptionally regulate adipogenic differentiation of bone marrow-derived MSCs in hypoxia. Stem Cell Res Ther
2015;6:21.
36 Recchia FA: Role of nitric oxide in the regulation of substrate metabolism in heart failure. Heart Fail Rev 2002;7:141-148.
37 Song L, Yang YJ, Dong QT, Qian HY, Gao RL, Qiao SB, Shen R, He ZX, Lu MJ, Zhao SH, Geng YJ, Gersh BJ: Atorvastatin enhance efficacy of mesenchymal stem cells treatment for swine myocardial infarction via activation of nitric oxide synthase. PLoS One 2013;8:e65702.