R E S E A R C H A R T I C L E
Open Access
Long-term effects of the SLC2A9 G844A
and SLC22A12 C246T variants on serum uric
acid concentrations in children
Hye Ah Lee
1,2, Bo Hyun Park
1, Eun Ae Park
3, Su Jin Cho
3, Hae Soon Kim
3and Hyesook Park
1*Abstract
Background: We evaluated the effects of two single-nucleotide polymorphisms on UA concentrations in the first decade of life using repeated-measures data.
Methods: We included all subjects who were followed-up at least once and for whom we had both UA and genotypic data (i.e., 375, 204, 307, and 363 patients aged 3, 5, 7, and 9 years, respectively). All participated in the Ewha Birth and Growth Cohort study. We used a mixed model analysis to estimate the longitudinal association of serum UA concentration due to the rs3825017 (SLC22A12 c. 246C > T) and rs16890979 (SLC2A9 c. 844G > A) genotypes. Results: Overall, the tracking coefficient of UA concentrations in children 3 to 9 years of age was 0.31, and was higher in boys than in girls (0.34 vs. 0.29, respectively). Regarding individual variance, serum UA concentrations decreased as age increased (β = − 0.07, p < 0.05), but there were no significant differences by sex. The effects of rs3825017 on UA concentration were significant in boys, but not in girls. Boys with the T allele of rs3825017 had higher concentrations than their counterparts regardless of the time of follow-up. The rs16890979 genotypes were not significantly associated with serum UA concentration in either sex.
Conclusion: This study showed that rs3825017 in the SLC22A12 gene was associated with UA concentration in
childhood.
Keywords: Children, Longitudinal study, Urate transporter 1, Uric acid Background
Uric acid (UA) is the major endpoint of purine metabol-ism in humans [1,2]. Serum UA concentration is modu-lated by urate excretion and reabsorption, which mainly occurs in the kidneys [1, 2]. An abnormally high serum concentration of UA is a predictor of vascular disease, gout, and renal disease [1], and is also associated with pediatric hypertension [3]. In addition, a longitudinal cohort study of the Bogalusa Heart Study reported that UA concentration in childhood is a significant predictor of blood pressure later in life [4].
It has been suggested that genetic variants markedly con-tribute to UA concentrations [5], with an estimated herit-ability of − 70% [6]. Genome-wide association (GWA)
studies of common variants identified more than 30 genetic loci associated with the UA concentrations, mostly in urate transporters, such as the genes encoding solute carrier fam-ily 2 facilitated glucose transporter member 9 (also known asSLC2A9 encoding GLUT9), solute carrier family 22 (or-ganic anion/cation transporter) member 12 (also known as SLC22A12 encoding URAT1), and the ATP-binding cassette transporter subfamily G member 2 (ABCG2) [2,5]. The importance of URAT1 and GLUT9 for regulating blood urate levels was confirmed, and mutations in SLC22A12 and SLC2A9 have been reported to be respon-sible for hypouricemia [7]. ABCG2 is also known to be a major cause of gout and hyperuricemia that acts by de-creasing urate excretion [8]. Among these candidate genes, the missense single-nucleotide polymorphisms (SNPs) rs3733591 (c. 881G > A) and rs16890979 (c. 844G > A) in theSLC2A9 gene had significant effects on gout in an Asian population [9]. Both polymorphisms protected against the * Correspondence:[email protected]
1Department of Preventive Medicine, College of Medicine, Ewha Womans
University, 1071, Anyangcheon-ro, Yangcheon-ku, Seoul 158-710, Korea Full list of author information is available at the end of the article
© The Author(s). 2018 Open Access This article is distributed under the terms of the Creative Commons Attribution 4.0 International License (http://creativecommons.org/licenses/by/4.0/), which permits unrestricted use, distribution, and reproduction in any medium, provided you give appropriate credit to the original author(s) and the source, provide a link to the Creative Commons license, and indicate if changes were made. The Creative Commons Public Domain Dedication waiver (http://creativecommons.org/publicdomain/zero/1.0/) applies to the data made available in this article, unless otherwise stated.
development of gout, and rs16890979 showed a stronger association than rs3733591 [9]. The protective effect of common variant p.V12 M (rs2231137) inABCG2 on gout was also reported in a meta-analysis (odds ratio = 0.73, p < 0.0001) [10], but the functional characterization of this variant did not show altered urate transport activity [11].
As variants in SLC22A12 related to hypouricemia,
c.774G > A and c.269G > A were identified in Japanese [12] and Korean [13] subjects, and c.1245_1253del and c.1400C > T were found in the Roma population [14]. In addition, a recent study of Korean men reported five tag-ging SNPs of URAT1, of which rs3825017 (c. 246C > T) showed a strong association with hyperuricemia despite the small sample size [15]. Except for genetic effects, birth weight [16], dietary intake [1, 17], and body mass index (BMI) [18] are also correlated with UA concentrations.
Evidence from GWA and epidemiology studies has suggested a number of candidate genes and a recent study from the Viva La Familia Study also reported genetic vari-ants inSLC2A9 associated with UA concentrations in chil-dren [19]. Studies evaluating the effects of gene variants in the context of controlling UA concentrations are important, but insufficient research has been conducted in children. On reviewing the literature and considering the possibility of genotype analysis, we assessed the effects of two SNPs (rs3825017 genotype of SLC22A12 and rs16890979 geno-type ofSLC2A9) of UA-related genes on the UA concentra-tion in childhood using repeated-measures UA data derived from the Ewha Birth & Growth Cohort study to determine whether genetic variants influence the UA concentrations during the first 10 years of life. Because there is little data on how the UA concentration is maintained over time, we also estimated the tracking coefficient of the UA concentra-tions during childhood.
Methods
Study subjects
This study was conducted as part of the ongoing Ewha Birth & Growth Cohort study, a single-hospital-based prospective cohort that was established in 2001–2006. The cohort was started to investigate the risk and pre-ventive factors that may be associated with growth and disease susceptibility via longitudinal observations. The study enrolled 940 subjects at 24–28 weeks pregnancy who visited Ewha Womans University Mokdong Hos-pital, Seoul, Korea for prenatal care. We conducted follow-up when their offspring reached the ages of 3, 5, and 7 years and annually thereafter. By 2016, the follow-up of children aged 9 years had been completed. The methodology of the cohort study has been reported elsewhere [20, 21]. In this study, two SNPs were geno-typed in the subjects who were followed up at least once. There were 471, 400, 364, and 400 cohort members who were followed up at the ages of 3, 5, 7, and 9 years,
respectively. Of these, we included subjects who had both UA and genotype data (i.e., 375, 204, 307, and 363 at ages 3, 5, 7, and 9 years, respectively). This study was composed of 620 children because many children attended multiple follow-up visits. Written informed consent for participation in the study was obtained from the parents or guardians of all of the study participants at the time of follow-up. The study protocol was ap-proved by the Institutional Review Board of Ewha Womans University Hospital (approval No. EUMC 2015–04-048). All processes were performed in accord-ance with relevant guidelines and regulations.
Uric acid measurements
When visiting a hospital to participate in the follow-up pro-gram, we collected a blood sample from an antecubital vein in a vacutainer tube containing ethylenediaminetetraacetic acid (EDTA). All blood sample were obtained after fasting at least 8 h. Serum UA concentrations were measured using the uricase-peroxidase coupled reaction method on a Hitachi Auto-analyzer 7600 (Hitachi, Fukuoka, Japan) in the Clinical Biochemistry Department of the Seegene Med-ical Foundation, Seoul, Korea. UA measurements during follow-up were performed in the same way.
Genotyping the two SNPs
The genotypes of rs3825017 inSLC22A12 and rs16890979 in SLC2A9 were screened using the TaqMan fluorogenic 5′ nuclease assay (ABI, Foster City, CA, USA). The final volume of the polymerase chain reaction (PCR) was 5μL, and each reaction contained 10 ng genomic DNA, 2.5μL
TaqMan Universal PCR Master Mix, and 0.13 μL 20×
Assay Mix. The thermal cycle conditions were as follows: 50 °C for 2 min to activate the uracil N-glycosylase and to prevent carry-over contamination, 95 °C for 10 min to ac-tivate the DNA polymerase, followed by 45 cycles at 95 °C for 15 s and 60 °C for 1 min. All of the PCR reactions were performed using 384-well plates on a Dual 384-Well Gen-eAmp PCR System 9700 (ABI). The endpoint fluorescent readings were performed on an ABI PRISM 7900 HT Se-quence Detection System (ABI). Duplicate samples and negative controls were included to ensure the accuracy of genotyping, which was performed at DNA Link Inc. in Seoul, Korea. The distribution of the two SNPs in the study subjects satisfied Hardy–Weinberg equilibrium.
Covariates
As covariates, we considered BMI and birth weight, based on previous studies [16,18]. Maternal education level was used as a measure of socioeconomic status because it changes little over time (graduated from high school or some college or higher). Anthropometric data were col-lected by trained researchers when the subjects visited the hospital to participate in the follow-up program. Height
and weight were measured to the nearest 0.1 cm and 0.1 kg, respectively, while wearing light clothing and no shoes using a stadiometer and calibrated scale. BMI was calculated as weight (kg)/height2 (m2). BMI at each follow-up point was considered a covariate. Birth weight was obtained from the hospital birth records.
Statistical analysis
Numerical variables are presented as the mean and stand-ard deviation and categorical variables were presented as the number of subjects and percent. Using repeated-mea-sures data for UA concentrations in subjects aged 3, 5, 7, and 9 years, we estimated the intra-class correlation (ICC) as the tracking coefficient through mixed model analysis [22]. There was no critical tracking value. We interpreted < 0.3 as weak, 0.3–0.6 as moderate, and > 0.6 as strong, based on a previous study [23]. The average difference in UA con-centration by sex was evaluated using Student’s t-test. The average UA concentration according to genotype was ana-lyzed using a generalized linear model.
To investigate the long-lasting effects of genetic vari-ants on UA concentration, we used mixed model ana-lysis with a random intercept model. Analyses were conducted using a variance component structure based on lower Akaike information criterion (AIC) values for model selection. The genetic variant used a dominant model (CC vs. CT + TT genotypes) to ensure that the groups had sufficient subjects. Maternal education level and birth weight were treated as time-independent covariates. The BMI at each follow-up visit was consid-ered a time-dependent covariate. To assess the effect modifier, we also included the interaction between sex and genotype as a dominant model.
All of the statistical tests were conducted using SAS 9.4 (SAS Institute, Cary, NC, USA) with two-sided tests, and a p value < 0.05 was considered statistically signifi-cant. For the interaction,P values < 0.1 were considered to be significant, based on a previous report [24]. Results
Two SNPs were examined in 620 children. The rs3825017 allele frequencies of CC, CT, and TT were 61.1%, 34.9%, and 4.0%, respectively. The rs16890979 allele frequencies of GG, GA, and AA were 99.0%, 1.0%, and 0.0%, respectively (Table1). The genetic polymorphism distribution did not differ by sex (p > 0.05, χ2
test) and there was no sex differ-ence in UA concentration with follow-up time (P > 0.05). Overall, the tracking coefficient of UA concentration from 3 to 9 years of age was 0.31, and was higher in boys than in girls (0.34 vs. 0.29, respectively). While the tracking coeffi-cient of UA concentration from 5 to 9 years of age was higher (total = 0.37, boys = 0.39, girls = 0.34), these values can interpreted as showing moderate stability.
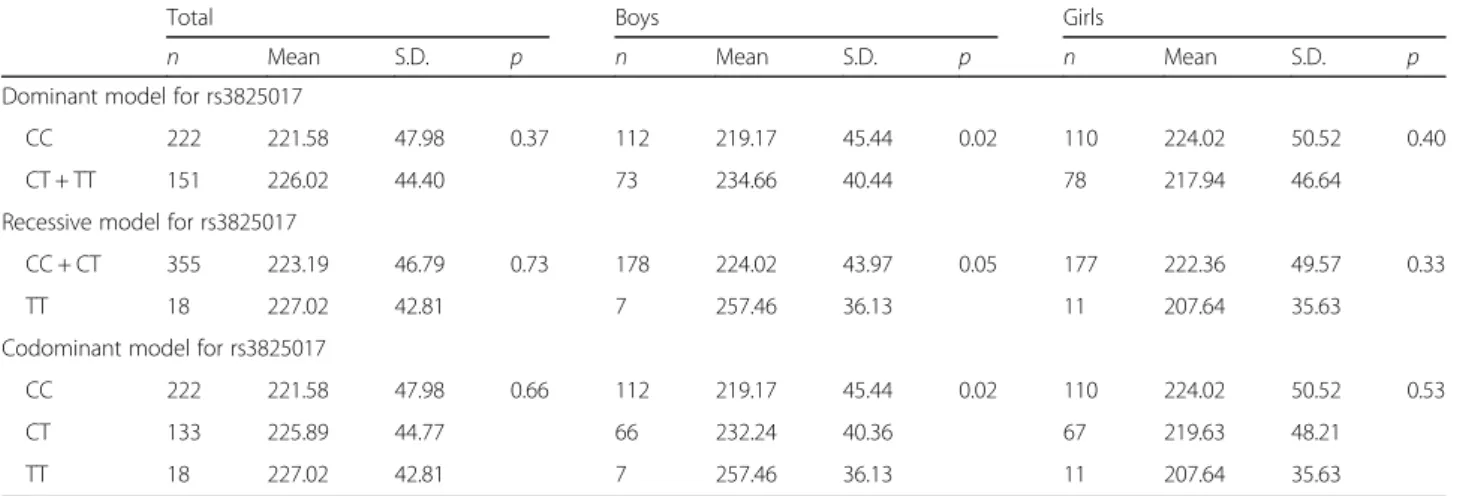
Table 2 shows the average UA concentration for gen-etic models of the two polymorphisms. There was a lim-ited ability to assess the effects of rs16890979 on UA concentration because the minor allele frequency was very low. Thus, its result was not presented in the table. The effects of rs3825017 on UA concentration were sig-nificant in boys, but not in girls. Boys with the T allele of rs3825017 had higher concentrations than their counter-parts at baseline (Table 2). In boys, carriers with one or two T alleles (i.e., CT or TT) had a higher mean UA concentration than non-carriers regardless of the time of follow-up, even after adjusting for birth weight, maternal education level, time, and BMI at each follow-up point. In girls, no effects of rs3825017 on UA concentration were apparent (Fig.1).
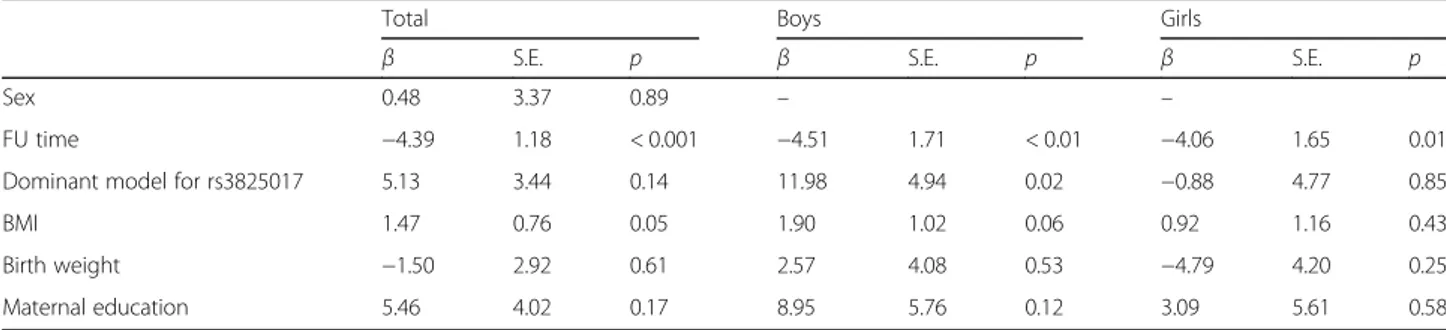
The longitudinal effects of rs3825017 genotype on individual UA concentration are presented in Table 3. The random intercept model showed that UA concen-tration at baseline varied among the children. When estimating changes in UA concentration with age, we found that concentration decreased by 4.39μmol/L with every 2-year increase in age (P < 0.001). Individual UA concentrations changed at the same rate with age in the children, indicating that there were no significant effects of a random slope in time. The rs3825017 genotypes had significant effects on the changes in UA concentration in the first decade of life in boys only (Table3). The effect of BMI on the UA concentrations was not significant in either sex. Maternal education level as a measure of so-cioeconomic status and birth weight had no effect on UA concentration. After adjusting for the interaction be-tween genotypes and sex, the difference in sex was sig-nificant (P for interaction = 0.08). The longitudinal effects of rs16890979 were not assessed due to the very low frequency of the minor allele.
Discussion
This study used a longitudinal approach to examine the relationship between two candidate SNPs and UA concen-tration in a general pediatric population. The rs3825017 genotype ofSLC22A12 had a notable effect on UA concen-tration in the first 10 years of life in boys. Although there was no sex difference in UA concentration, the genetic ef-fects of rs3825017 on concentration differed by sex (P geno-type × sex= 0.08) during childhood. The tracking coefficient of UA from 3 to 9 years of age showed moderate stability.
Both SLC22A12, which encodes urate transporter 1
(URAT1), and SLC2A9, which encodes glucose
trans-porter 9 (GLUT9), are involved in modulating urate reabsorption in the renal tubules. A meta-analysis of GWA studies identified multiple candidate loci related to UA level in European (SLC2A9, ABCG2, SLC17A1, SLC22A11, SLC22A12, SLC16A9, GCKR, LRRC16A, and PDZK1) and East Asian (SLC2A9, ABCG2, SLC22A12,
and MAF) populations [2, 25]. Mutations in SLC22A12 or SLC2A9 were initially reported in Japanese patients with renal hypouricemia, although patients from various ethnic groups have subsequently been identified [7]. A study of children in the Viva La Familia Study also
recently showed that the serum UA concentration was associated strongly with genetic variants in SLC2A9 through GWA analysis [19]. Of genetic variants, the Hereditary and Phenotype Intervention (HAPI) Heart Study found that rs16890979 inSLC2A9 was associated
Table 1 Distribution ofSLC2A9 G844A and SLC22A12 C246T variants and characteristics of the study subjects
Unit:n (%) or mean (standard deviation)
Total Boys Girls
Genetic variants rs3825017 polymorphism CC 377 (61.1%) 197 (62.5%) 180 (59.6%) CT 215 (34.9%) 107 (34.0%) 108 (35.8%) TT 25 (4.0%) 11 (3.5%) 14 (4.6%) rs16890979 polymorphism GG 614 (99.0%) 312 (98.7%) 302 (99.3%) GA 6 (1.0%) 4 (1.3%) 2 (0.7%)
Serum uric acid concentration (μmol/L) at each FU age
UA at 3 years of age 223.44 (46.44) 225.38 (43.98) 221.52 (48.78) UA at 5 years of age 235.94 (42.55) 234.60 (41.55) 237.28 (43.69) UA at 7 years of age 223.97 (55.64) 219.92 (57.03) 227.94 (54.12) UA at 9 years of age 211.59 (48.85) 214.19 (52.04) 208.97 (45.41) Covariates Birth weight (kg) 3.09 (0.59) 3.15 (0.59) 3.03 (0.58)
BMI (kg/m2) at 3 years of age 15.47 (1.31) 15.49 (1.33) 15.45 (1.29)
BMI (kg/m2) at 5 years of age 15.71 (1.67) 15.94 (1.78) 15.47 (1.53)
BMI (kg/m2) at 7 years of age 15.95 (2.10) 16.19 (2.18) 15.72 (2.01)
BMI (kg/m2) at 9 years of age 17.50 (2.58) 17.88 (2.75) 17.14 (2.35)
Maternal education level
Graduated from high school 132 (22.2%) 64 (21.2%) 68 (23.3%)
Some college or higher 462 (77.8%) 238 (78.8%) 224 (76.7%)
UA uric acid, FU follow-up, BMI body mass index
Table 2 Baseline differences in the uric acid concentrations (μmol/L) for each genetic modela
Total Boys Girls
n Mean S.D. p n Mean S.D. p n Mean S.D. p
Dominant model for rs3825017
CC 222 221.58 47.98 0.37 112 219.17 45.44 0.02 110 224.02 50.52 0.40
CT + TT 151 226.02 44.40 73 234.66 40.44 78 217.94 46.64
Recessive model for rs3825017
CC + CT 355 223.19 46.79 0.73 178 224.02 43.97 0.05 177 222.36 49.57 0.33
TT 18 227.02 42.81 7 257.46 36.13 11 207.64 35.63
Codominant model for rs3825017
CC 222 221.58 47.98 0.66 112 219.17 45.44 0.02 110 224.02 50.52 0.53
CT 133 225.89 44.77 66 232.24 40.36 67 219.63 48.21
TT 18 227.02 42.81 7 257.46 36.13 11 207.64 35.63
S.D standard deviation a
with UA concentrations and it accounted for 4.3% of the variance [26]. This association was also reported in studies of the Framingham and Rotterdam cohorts [5] and a Czech population [27], but there was a discrepancy in the direction of association. This might involve additional fac-tors, such as diet, lifestyle, and different linkage disequilib-rium structures [8, 27]. Although two meta-analyses
reported that the dominant model of rs16890979 was as-sociated with gout in an Asian population [9, 28], our study had limited statistical strength due to the low minor allele frequency; the minor allele frequency of rs16890979 was less than 0.02 in the populations of China and Japan, was greater than 0.29 in a European population [29], 0.23 in the Framingham Heart Study, and was 0.21 in the Rot-terdam Study [5]. In addition,SLC2A9 rs16890979 showed possible associations with gout [9] and hyperuricemia [30]. However, functional characterization of SLC2A9 rs16890979 in an experimental validation study revealed no significant difference in the expression of GLUT9 [30]. Functional studies are likely to be important in determin-ing the causality of disease-related SNPs.
In our study, rs3825017 in SLC22A12 affected UA con-centration in boys, but not in girls. Three other studies have examined rs3825017 [12, 15, 31]. In line with our study, one study of Korean men found an association with hyper-uricemia (odds ratio = 2.29, 95% confidence interval 1.78 to 2.93), while studies from Japanese and Chinese population found no significant effect. The latter studies did not assess sex differences, which needs further study. Regarding to SLC2A9, several studies have suggested sex differences by genotype including rs16890979; the effects were seen more clearly in women than in men [2, 32]. The sex difference can be explained by sex hormones. Because estrogen is uri-cosuric [33], the differences with the rs3825017 genotype are expected to be more distinct around puberty. A recent GWA study of gout and its subtypes revealed that HIST1H2BF-HIST1H4E, NIPAL1, and FAM35A were novel risk loci [8]. However, detailed knowledge of the functional pathways of these genes affecting UA concentrations remains limited and further studies are required.
Although the pathological mechanism of UA is un-clear, Mazzali et al. reported that rats with induced mild hyperuricemia develop mild hypertension and slightly reduced renal function [34]. In addition, in-jury was seen in the afferent arterioles of the renal microvasculature in the hyperuricemic rat [35, 36]. These experimental studies also suggested that these
Fig. 1 The average uric acid concentrations (μmol/L) with the dominant model of rs3825017 genotypes from 3 to 9 years of age, by sex. a Boys, b Girls The least-squared mean by genotypes (as a dominant model) at each follow-up age were obtained from a mixed model under a random intercept model with variance components structure. It was estimated while controlling for time, birth weight, maternal education level, and body mass index at each time point. Genetic variants and time were applied as categorical values to obtain the mean values for the genetic variant at each time point. The box indicates the average UA concentration, and the vertical lines show the standard error
Table 3 Longitudinal effects of rs3825017 genotypes on individual serum uric acid concentrations
Total Boys Girls
β S.E. p β S.E. p β S.E. p
Sex 0.48 3.37 0.89 – –
FU time −4.39 1.18 < 0.001 −4.51 1.71 < 0.01 −4.06 1.65 0.01
Dominant model for rs3825017 5.13 3.44 0.14 11.98 4.94 0.02 −0.88 4.77 0.85
BMI 1.47 0.76 0.05 1.90 1.02 0.06 0.92 1.16 0.43
Birth weight −1.50 2.92 0.61 2.57 4.08 0.53 −4.79 4.20 0.25
Maternal education 5.46 4.02 0.17 8.95 5.76 0.12 3.09 5.61 0.58
FU follow-up, BMI body mass index
The rs3825017 genotypes for the dominant model (CC and CT + TT)
changes could be prevented by maintaining UA con-centration in the normal range [1, 34, 35].
Even in children, UA had an independent effect on higher blood pressure after controlling for adiposity fac-tors, renal function, and pubertal status [18]. A cohort study with an average 12-year follow-up also reported that the UA concentration in childhood and changes in con-centration were significant predictors of blood pressure in later life [4]. Feig et al. suggested that serum UA concen-tration is directly correlated with blood pressure, and that hyperuricemia showed a stronger association in childhood primary hypertension than in secondary or white-coat hypertension [3]. Therefore, control of UA levels may be important to prevent disease. In our study, the tracking coefficient of UA during the 6-year follow-up period beginning at 3 years of age showed moderate stability (ICC = 0.31). The tracking coefficient of UA from 5 to 9 years of age was slightly higher (ICC = 0.37). The UA concentration in blood can vary with age, sex, and puber-tal status [4, 19]. Unlike previous studies, we found no differences in UA concentration with sex, and the average UA concentration decreased with increasing age during the first decade of life. Our study examined younger sub-jects than those used in previous studies [4, 18, 37], and there are few prospective studies of UA using repeated measures. Thus, it is difficult to explain the difference.
To the best of our knowledge, this is the first study to assess the persistent effects of genetic variants on the UA concentration during childhood. Compared with non-car-riers, boys with carriers of at least one rs3825017 T allele exhibited elevated UA concentrations. Our results support those of an earlier study conducted in Korean males [15]. Additionally, BMI was positively associated with the UA concentration during childhood, with borderline signifi-cance in boys but not in girls.
This study had several weaknesses. First, we assessed the effect of one tag SNP; other genetic variants near URAT1 may also be important. In addition, residual confounding by unmeasured factors may affect UA con-centration. Conversely, our results are less likely to be influenced by unhealthy factors such as alcohol con-sumption and comorbidities compared to adult studies and case-control studies, because this study examined a general pediatric population. We assumed that the gen-etic variants were dichotomized by a dominant effect of the risk allele due to the low frequency of homozygous carriers of the risk allele. It is necessary to confirm this in a large-scale study and in studies of different ethnic groups. To verify the statistical power, we calculated the required sample size for linear mixed model with ran-dom intercept. As a result, 41 subjects per group were required to evaluate the significance of a difference in the UA concentration between the two groups (non-car-riers vs car(non-car-riers of at least one rs3825017 T allele),
assuming that the power was 80% with α = 0.05, four repeated measurements, and mean difference− 11.3. Thus, we found that the statistical power of our study was adequate. Finally, there is a limit to generalizing our findings because the evidence is still insufficient.
Conclusions
In summary, we estimated the stability of UA concentra-tion over 6 years beginning in early childhood, and observed moderate stability. A single measurement of UA during childhood may have a limited ability to predict dis-ease in later life. Through a longitudinal approach, we also found that rs3825017 genotype had a notable effect on UA concentration in boys during childhood. Our study considered only two SNPs (rs3825017 in SLC22A12 and rs16890979 in SLC2A9). Therefore, further studies with extended follow-up periods are required to consider other major genetic loci associated with UA concentrations, such as glucokinase regulatory protein (GCKR) and ABCG2 [2].
Abbreviations
ABCG:ATP-binding cassette transporter; AIC: Akaike information criterion; BMI: Body mass index; EDTA: Ethylenediaminetetraacetic acid;GCKR: Glucokinase regulatory protein; GLUT9: Glucose transporter 9; GWA: Genome-wide association; ICC: Intra-class correlation; PCR: Polymerase chain reaction;SLC22A12: Solute carrier family 22 (organic anion/cation transporter) member 12;SLC2A9: Solute carrier family 2 facilitated glucose transporter member 9; SNP: Single-nucleotide polymorphism; UA: Uric acid; URAT1: Urate transporter 1
Funding
This research was supported by the Basic Science Research Program through the National Research Foundation of Korea (NRF), funded by the Ministry of Science, ICT& Future Planning (NRF-2014R1A1A3051023).
Availability of data and materials
All data generated or analysed during this study are included in this published article.
Authors’ contributions
Conceptualization, EAP, SJC, HSK, and HP; formal analysis, HAL; data curation, HAL, BHP, EAP, SJC, HSK, and HP; writing the original draft, HAL; reviewing and editing the manuscript, BHP, EAP, SJC, HSK and HP; supervision, HP; approval of the final manuscript, all authors.
Ethics approval and consent to participate
Written informed consent for participation in the study was obtained from the parents or guardians of all of the study participants. The study protocol was approved by the Institutional Review Board of Ewha Womans University Hospital (approval No. EUMC 2015–04-048).
Consent for publication Not applicable.
Competing interests
The authors declare that they have no competing interests.
Publisher’s Note
Springer Nature remains neutral with regard to jurisdictional claims in published maps and institutional affiliations.
Author details
1Department of Preventive Medicine, College of Medicine, Ewha Womans
2Clinical Trial Center, Mokdong Hospital, Ewha Womans University, Seoul,
Korea.3Department of Pediatrics, College of Medicine, Ewha Womans
University, Seoul, Korea.
Received: 28 January 2018 Accepted: 30 August 2018
References
1. Kutzing MK, Firestein BL. Altered uric acid levels and disease states. J Pharmacol Exp Ther. 2008;324(1):1–7.
2. Kolz M, Johnson T, Sanna S, Teumer A, Vitart V, Perola M, et al. Meta-analysis of 28,141 individuals identifies common variants within five new loci that influence uric acid concentrations. PLoS Genet. 2009;5(6):e1000504. 3. Feig DI, Johnson RJ. The role of uric acid in pediatric hypertension. J Ren
Nutr. 2007;17(1):79–83.
4. Alper AB Jr, Chen W, Yau L, Srinivasan SR, Berenson GS, Hamm LL. Childhood uric acid predicts adult blood pressure: the Bogalusa heart study. Hypertension. 2005;45(1):34–8.
5. Dehghan A, Köttgen A, Yang Q, Hwang SJ, Kao WL, Rivadeneira F, et al. Association of three genetic loci with uric acid concentration and risk of gout: a genome-wide association study. Lancet. 2008;372(9654):1953–61. 6. Whitfield JB, Martin NG. Inheritance and alcohol as factors influencing
plasma uric acid levels. Acta Genet Med Gemellol. 1983;32:117–26. 7. Claverie-Martin F, Trujillo-Suarez J, Gonzalez-Acosta H, Aparicio C, Justa
Roldan ML, Stiburkova B, Ichida K, Martín-Gomez MA, Herrero Goñi M, Carrasco Hidalgo-Barquero M, Iñigo V, Enriquez R, Cordoba-Lanus E, Garcia-Nieto VM, RenalTube Group. URAT1 and GLUT9 mutations in Spanish patients with renal hypouricemia. Clin Chim Acta. 2018;481:83–9.https://doi. org/10.1016/j.cca.2018.02.030.
8. Nakayama A, Nakaoka H, Yamamoto K, Sakiyama M, Shaukat A, Toyoda Y, et al. GWAS of clinically defined gout and subtypes identifies multiple susceptibility loci that include urate transporter genes. Ann Rheum Dis. 2017;76(5):869–77.https://doi.org/10.1136/annrheumdis-2016-209632. 9. Chen Y, Ying Y, Shi S, Li L, Huang Y, Ye H, Gong O, Huang H, Ji H, Huang T,
Duan S. A systematic review and meta-analysis of 4 candidate
polymorphisms with the risk of gout. Int J Clin Exp Med. 2016;9(8):16025–33. 10. Stiburkova B, Pavelcova K, Zavada J, Petru L, Simek P, Cepek P, Pavlikova M,
Matsuo H, Merriman TR, Pavelka K. Functional non-synonymous variants of ABCG2 and gout risk. Rheumatology (Oxford). 2017;56(11):1982–92. 11. Higashino T, Takada T, Nakaoka H, Toyoda Y, Stiburkova B, Miyata H, et al.
Multiple common and rare variants of ABCG2 cause gout. RMD Open. 2017; 3(2):e000464.
12. Iwai N, Mino Y, Hosoyamada M, Tago N, Kokubo Y, Endou H. A high prevalence of renal hypouricemia caused by inactive SLC22A12 in Japanese. Kidney Int. 2004;66(3):935–44.
13. Lee JH, Choi HJ, Lee BH, Kang HK, Chin HJ, Yoon HJ, Ha IS, Kim S, Choi Y, Cheong HI. Prevalence of hypouricaemia and SLC22A12 mutations in healthy Korean subjects. Nephrology (Carlton). 2008;13(8):661–6.https://doi. org/10.1111/j.1440-1797.2008.01029.x.
14. Gabrikova D, Bernasovska J, Sokolova J, Stiburkova B. High frequency of SLC22A12 variants causing renal hypouricemia 1 in the Czech and Slovak Roma population; simple and rapid detection method by allele-specific polymerase chain reaction. Urolithiasis. 2015;43(5):441–5.https://doi.org/10. 1007/s00240-015-0790-4.
15. Cho SK, Kim S, Chung JY, Jee SH. Discovery of URAT1 SNPs and association between serum uric acid levels and URAT1. BMJ Open. 2015;5(11):e009360. 16. Franco MC, Christofalo DM, Sawaya AL, Ajzen SA, Sesso R. Effects of low
birth weight in 8- to 13-year-old children: implications in endothelial function and uric acidlevels. Hypertension. 2006;48(1):45–50.
17. Lin WT, Huang HL, Huang MC, Chan TF, Ciou SY, Lee CY, et al. Effects on uric acid, body mass index and blood pressure in adolescents of consuming beverages sweetened with high-fructose corn syrup. Int J Obes (Lond). 2013;37(4):532–9.
18. Viazzi F, Antolini L, Giussani M, Brambilla P, Galbiati S, Mastriani S, et al. Serum uric acid and blood pressure in children at cardiovascular risk. Pediatrics. 2013;132(1):e93–9.
19. Voruganti VS, Laston S, Haack K, Mehta NR, Cole SA, Butte NF, et al. Serum uric acid concentrations and SLC2A9 genetic variation in Hispanic children: the viva La Familia study. Am J Clin Nutr. 2015;101(4):725–32.
20. Lee HA, Park EA, Cho SJ, Kim HS, Kim YJ, Lee H, et al. Mendelian randomization analysis of the effect of maternal homocysteine during
pregnancy, as represented by maternal MTHFR C677T genotype, on birth weight. J Epidemiol. 2013;23(5):371–5.
21. Lee HA, Kim YJ, Lee H, Gwak HS, Hong YS, Kim Q, et al. The preventive effect of breast-feeding for longer than 6 months on early pubertal development among children aged 7-9 years in Korea. Public Health Nutr. 2015;18(18):3300–7.
22. Twisk JWR. Applied longitudinal data analysis for epidemiology: a practical guide. Cambridge: Cambridge University Press; 2003. p. 225–7.
23. Pearson N, Salmon J, Campbell K, Crawford D, Timperio A. Tracking of children's body-mass index, television viewing and dietary intake over five-years. Prev Med. 2011;53(4–5):268–70.
24. Prado EL, Maleta K, Ashorn P, Ashorn U, Vosti SA, Sadalaki J, Dewey KG. Effects of maternal and child lipid-based nutrient supplements on infant
development: a randomized trial in Malawi. Am J Clin Nutr. 2016;103:784–93. 25. Okada Y, Sim X, Go MJ, Wu JY, Gu D, Takeuchi F, et al. Meta-analysis
identifies multiple loci associated with kidney function-related traits in east Asian populations. Nat Genet. 2012;44(8):904–9.
26. Parsa A, Brown E, Weir MR, Fink JC, Shuldiner AR, Mitchell BD, et al. Genotype-based changes in serum uric acid affect blood pressure. Kidney Int. 2012;81(5):502–7.
27. Stibůrková B, Pavlíková M, Sokolová J, Kožich V. Metabolic syndrome, alcohol consumption and genetic factors are associated with serum uric acid concentration. PLoS One. 2014;9(5):e97646.https://doi.org/10.1371/ journal.pone.0097646. eCollection 2014.
28. Meng Q, Yue J, Shang M, Shan Q, Qi J, Mao Z, et al. Correlation of GLUT9 polymorphisms with gout risk. Medicine (Baltimore). 2015;94(44):e1742. 29. Yang B, Mo Z, Wu C, Yang H, Yang X, He Y, et al. A genome-wide
association study identifies common variants influencing serum uric acid concentrations in a Chinese population. BMC Med Genomics. 2014;7:10. 30. Hurba O, Mancikova A, Krylov V, Pavlikova M, Pavelka K, Stibůrková B.
Complex analysis of urate transportersSLC2A9, SLC22A12 and functional characterization of non-synonymous allelic variants of GLUT9 in the Czech population: no evidence of effect on hyperuricemia and gout. PLoS One. 2014;9(9):e107902.
31. Li C, Han L, Levin AM, Song H, Yan S, Wang Y, et al. Multiple single nucleotide polymorphisms in the human urate transporter 1 (hURAT1) gene are associated with hyperuricaemia in Han Chinese. J Med Genet. 2010; 47(3):204–10.
32. McArdle PF, Parsa A, Chang YC, Weir MR, O'Connell JR, Mitchell BD, et al. A common non-synonymous variant in GLUT9 is a determinant of serum uric acid levels in old order Amish. Arthritis Rheum. 2008;58(9):2874–81. 33. Adamopoulos D, Vlassopoulos C, Seitanides B, Contoyiannis P, Vassilopoulos
P. The relationship of sex steroids to uric acid levels in plasma and urine. Acta Endocrinol. 1977;85(1):198–208.
34. Mazzali M, Kanellis J, Han L, Feng L, Xia Y-Y, Chen Q, et al. Hyperuricemia induces a primary arteriolpathy in rats by a blood pressure-independent mechanism. Am J Physiol Renal Physiol. 2002;6:F991–7.
35. Sánchez-Lozada LG, Tapia E, Avila-Casado C, Soto V, Franco M, Santamaría J, et al. Mild hyperuricemia induces glomerular hypertension in normal rats. Am J Physiol Renal Physiol. 2002;283(5):F1105–10.
36. Watanabe S, Kang DH, Feng L, Nakagawa T, Kanellis J, Lan H, et al. Uric acid, hominoid evolution, and the pathogenesis of salt-sensitivity. Hypertension. 2002;40(3):355–60.
37. Feig DI, Johnson RJ. Hyperuricemia in childhood primary hypertension. Hypertension. 2003;42(3):247–52.