Governmental designation of spine
specialty hospitals, their characteristics,
performance and designation effects:
a longitudinal study in Korea
Sun Jung Kim,1,2Ji Won Yoo,3,4Sang Gyu Lee,2,5Tae Hyun Kim,2,5 Kyu-Tae Han,1,2 Eun-Cheol Park2,6
To cite: Kim SJ, Yoo JW, Lee SG,et al. Governmental designation of spine specialty hospitals, their characteristics, performance and designation effects: a longitudinal study in Korea.BMJ Open 2014;4: e006525. doi:10.1136/ bmjopen-2014-006525
▸ Prepublication history for this paper is available online. To view these files please visit the journal online (http://dx.doi.org/10.1136/ bmjopen-2014-006525).
Received 3 September 2014 Revised 7 October 2014 Accepted 24 October 2014
For numbered affiliations see end of article.
Correspondence to Dr Eun-Cheol Park; [email protected]
ABSTRACT
Objectives:This study compares the characteristics and performance of spine specialty hospitals versus other types of hospitals for inpatients with spinal diseases in South Korea. We also assessed the effect of the government’s specialty hospital designation on hospital operating efficiency.
Setting:We used data of 823 hospitals including 17 spine specialty hospitals in Korea.
Participants:All spine disease-related inpatient claims nationwide (N=645 449) during 2010–2012.
Interventions:No interventions were made. Outcome measures:Using a multilevel generalised estimating equation and multilevel modelling, this study compared inpatient charges, length of stay (LOS), readmission within 30 days of discharge and in-hospital death within 30 days of admission in spine specialty versus other types of hospitals.
Results:Spine specialty hospitals had higher inpatient charges per day (27.4%) and a shorter LOS (23.5%), but per case charges were similar after adjusting for patient-level and hospital-patient-level confounders. After government designation, spine specialty hospitals had 8.8% lower per case charges, which was derived by reduced per day charge (7.6%) and shorter LOS (1.0%). Rates of readmission also were lower in spine specialty hospitals (OR=0.796). Patient-level and hospital-level factors both played important roles in determining outcome measures. Conclusions:Spine specialty hospitals had higher per day inpatient charges but a much shorter LOS than other types of hospitals due to their specialty volume and experience. In addition, their readmission rate was lower. Spine specialty hospitals also endeavoured to be more efficient after governmental‘specialty’ designation.
INTRODUCTION
Since 1 November 2011, the Korean Ministry of Health-Welfare has designated 92
hospi-tals in South Korea as ‘specialty hospitals’ to
promote specialised, high quality care. These specialty hospitals encompass specialty areas including spine, joint, colorectal-anal, burn,
breast, heart, ENT (ear, nose and throat), ophthalmology, alcohol treatment, OBGYN, neurosurgery and physical rehabilitation, etc. The highest number of hospitals with this designation (17) includes spine specialty hospitals.
Since South Korea established a national health insurance (NHI) programme in 1989, hospitals have faced many challenges such as an ageing population, rapidly rising healthcare
costs and growing chronic disease burden.1
These challenges are being addressed by various policy initiatives at the government level. In addition, physicians altering the mix
of treatments to increase profit margin2 and
the increased level of competition among
pro-viders present incentives for increasing ef
fi-ciency.3Moreover, providers have experienced
financial challenges,3due in part to the rapid
increase in small general hospitals, from 581
in 2000 to 1295 in 2010.4In order to address
these challenges, small hospitals have begun to specialise in order to better compete with small general, mid-sized general and even ter-tiary research hospitals.5
Strengths and limitations of this study
▪ This study is one of only a few studies to evaluate the performance and characteristics of specialty hospitals in this country, where government desig-nated the hospitals and even outside USA.
▪ This study used nationwide all spine-related
inpatient health insurance claims, which accounted for 645 449 participants.
▪ This study provides reasoning for designing ‘spe-cialty’ designation requirements and implementing specialty hospital systems in a health policy perspective.
▪ The limitations of this study include lack of important patient socioeconomic status data and investigation of short-term policy effect.
Kim SJ,et al. BMJ Open 2014;4:e006525. doi:10.1136/bmjopen-2014-006525 1
Open Access Research
group.bmj.com
on December 4, 2014 - Published by
http://bmjopen.bmj.com/
To be designated as a specialty hospital by the Korean Ministry of Health-Welfare, institutions must submit an application and be equipped with a certain number of beds, number of physicians and must have medical
service departments in their specialty area. The
inpatient volume of these institutions must be above the 30th centile among all small and mid-sized general hos-pitals, and the ratio of specialty-area inpatients to total inpatients must be above a certain percentage depend-ing on the specialty area.
The concept of specialty hospitals was first introduced
in the USA beginning in the 1990s. The first specialty
hospitals typically were located in fast-growing cities in
states where a ‘certificate of need’ was not required.6
Subsequently, there was a rapid increase in the number of small hospitals specialising in cardiac, orthopaedic and
surgical services.7 Furthermore, most of these hospitals
were physician-owned, for-profit and specialty-specific.8
Proponents argue that specialty hospitals provide
high-quality medical services at a lower cost,9–11bring added
value to the healthcare system12 13 and lead to greater
patient satisfaction.14 15 The increase in patient volume
and concentration of expertise allows specialty hospitals
to achieve better outcomes and maximise efficiency.16
However, opponents contend that specialty hospitals have lower quality and higher costs, since they are
for-profit and specialise in only the most profitable services,
target healthier patients who are more well-off and
induce demand for their specialised services.17–20
The purpose of this study was to compare the per-formance of spine specialty hospitals versus other types of hospitals in South Korea where, in contrast to the physician-owned specialty hospitals in the USA, the
South Korean government designates only qualified
institutions as specialty hospitals, by evaluating the inpatient charge per case, inpatient charge per day, length of stay (LOS), readmission within 30 days of dis-charge and in-hospital deaths within 30 days of admis-sion for patients. In addition, this study also investigated
the effect of designation as a‘specialty’ hospital on
hos-pital operating efficiency.
DATA AND METHODS Database and data collection
In order to investigate the designation effect of specialty hospitals and to measure their performance, we collected all nationwide claims for inpatients diagnosed with spine diseases from categories used to determine the spine spe-cialty hospital designation by the Ministry of Health and Welfare. Treatments for spine-related diseases included surgical procedures (discectomy, excision of intraspinal lesion, spinal fusion with deformity, spinal fusion, amputa-tion, radical excision of malignant bone tumour,
osteot-omy and externalfixation of extremity, etc) and medical
procedures specific to spinal disorders and injuries,
osteo-myelitis, connective tissue malignancy, connective tissue disorders, other musculoskeletal disorders, etc. We were
able to access claims reported during the 7 months after the government began to designate specialty hospitals on 1 November 2011 (1 November 2011 to 31 May 2012) and included claims reported in the same 7-month period 1 year prior (1 November 2010 to 31 May 2011). Among nearly 1600 hospitals included in the database, only those that admitted more than one spinal-related inpatient case were included. Our analysis encompassed 645 449 patients hospitalised for spine-related illnesses nationwide during the study period, and 823 hospitals including 17 spine spe-cialty hospitals.
Outcome measures
Inpatient charges per case are the sum of fee-for-services
(FFS) claims for each patient’s hospitalisation. LOS is
measured as the number of inpatient days during each episode of hospitalisation. We also calculated inpatient charge per day by dividing inpatient charges per case by the LOS. In Korea, the FFS schedule is negotiated by the government, medical providers and other stake-holders every year. In 2012, the FFS catalogue increased by 1.9%, but there were no increases in 2010 and 2011.
Hence, we discounted 2012 inpatient charges to 2010–
2011 levels. The average foreign exchange rate in 2011 was US$1=1108.09 KRW. Using the claim sample, we also calculated readmission within 30 days of discharge and mortality within 30 days of admission date as a binary variable if a patient was rehospitalised soon after dis-charge or died during hospitalisation.
Covariates
This data set contained inpatient claim details, including patient ID, disease diagnosed, admission/discharge date, sex, age, complexity of illness and the hospital to which each patient was admitted. Complexity of illness was measured by the provider and reported as claim data using the complication or comorbidity level (CCL; 0=patient does not have a complication or comorbidity (CC), 1=patient has a minor CC, 2=patient has a moder-ate CC, 3=patient has a complex CC) when each patient was admitted. Patient claims data were matched to the hospitals where each patient was admitted.
Hospital-level data included characteristics of the hos-pital, such as hospital type (specialty, tertiary, large, small), number of beds (in 100 bed increments), specia-lists per 100 beds, nurses per 100 beds, hospital location (metropolitan if located in cities with a population of more than one million), teaching status and bed
occu-pancy rate. According to the Korean Hospital
Association, Korean hospitals are categorised into three groupings based on bed size: (1) hospitals with over 1000 beds: tertiary research university hospitals, (2)
hos-pitals with 300–1000 beds: mid-sized general hospitals
and (3) hospitals with 100–300 beds: small general
pitals. The specialty hospitals and the small general hos-pitals in our study both fell within category 3 (small
general hospitals).21 The hospital level data were
obtained from the Agency for Health Insurance Review
2 Kim SJ,et al. BMJ Open 2014;4:e006525. doi:10.1136/bmjopen-2014-006525
Open Access
group.bmj.com
on December 4, 2014 - Published by
http://bmjopen.bmj.com/
and Assessment Services. In order to investigate the post policy designation effect, we included the interaction term of type of hospital and year, which we named desig-nation effect.
We also included data envelopment analysis (DEA) using
efficiency as the dummy variable (1=efficient,
0=non-efficient) to determine whether hospitals were operated
efficiently using a conventional technical efficiency
measur-ing technique.22It is derived from microeconomics
meth-odology where input and output combinations are
depicted using a production function to measure the ef
fi-ciency of multiple decision-making units (in this case hospi-tals) when the production process presents a structure of
multiple inputs and outputs.22 Input variables included
number of beds, surgical beds, recovery beds, specialists, residents, nurses, physical therapists and pharmacists; and positron emission tomography, CT and MRI units of each hospital. Output variables included total number of inpatient cases and sum of charges in 2011 and 2012 study periods for each hospital. Hospital-level statistics were
col-lected based on theirfirst quarter of 2012 status, which was
the only available data set at the time of this study.
Analytical approach
Mean and SD were analysed for continuous variables; frequency and per cent were analysed for categorical variables. Univariate analysis of inpatient charges, LOS, readmission within 30 days of discharge and mortality within 30 days of admission was performed to investigate the unadjusted effects of hospital types on these
mea-sures. Analysis of variance and χ2 tests were performed
for identification of group differences. Because the unit
of analysis was each patient’s hospitalisation, this study
utilised multilevel generalised estimating equation
(GEE) regression models in order to avoid problems created by possible nesting of patient observations in
hospitals and overestimation of significance.
The GEE regression models were used to investigate the performance and characteristics of specialty hospitals, including inpatient charges, LOS, readmission and mortal-ity adjusting for patient-level and hospital-level confoun-ders. Because the distributions of continuous dependent variables (inpatient charges and LOS) were skewed, we uti-lised log transformation in order to improve the distribu-tion characteristics of the data. In addidistribu-tion, we ran the GEEs of the binary outcome variables for readmission within 30 days of discharge and mortality within 30 days of admission. In order to enhance case mix adjustment, we included the diagnosis and procedure code in each model. SAS V.9.2 (SAS Institute, Cary, North Carolina, USA) was used for all calculations and analyses. As the
data set does not have patient identification information,
no ethics committee approval is required.
RESULTS
A total of 645 449 patients nationwide were hospitalised for spinal disease during the study periods, and 17
specialty hospitals accounted for 45 649 (7.1%) of
patients nationwide admitted for spine disease (table 1).
Patients in spine specialty hospitals were aged and female, had undergone more surgical procedures, and had lower CCL scores. The increase in volume in 2012 compared with 2011 was greater than average in spe-cialty hospitals as well as in conventional hospitals (total: 12.9% vs specialty 17.8%).
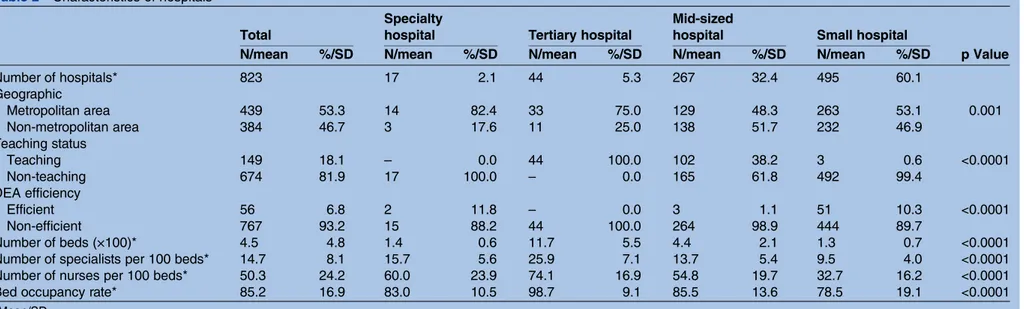
Table 2 shows the hospital characteristics analysed. Of the 823 hospitals in our study, there were 17 Ministry of Health and Welfare-designated spine specialty hospitals (2.1% of the total), which accounted for 7.1% of the total spinal procedures performed nationwide during the study period. While none of these was a teaching hospital, they were located mainly in metropolitan areas, and their structural factors were greater in terms of number of beds (in 100 bed increments), specialists per 100 beds and nurses per 100 beds as well as bed occu-pancy rate as compared with hospitals in the small general hospital category. Although specialty hospitals are larger than small general hospitals in terms of struc-tural factors, both types of hospitals fall within the same small hospital category in Korea. Clinical staff was greater in spine specialty hospitals than in mid-sized general hospitals. Furthermore, 11.8% of specialty
hospi-tals were considered to be efficient compared with 6.8%
of all hospitals.
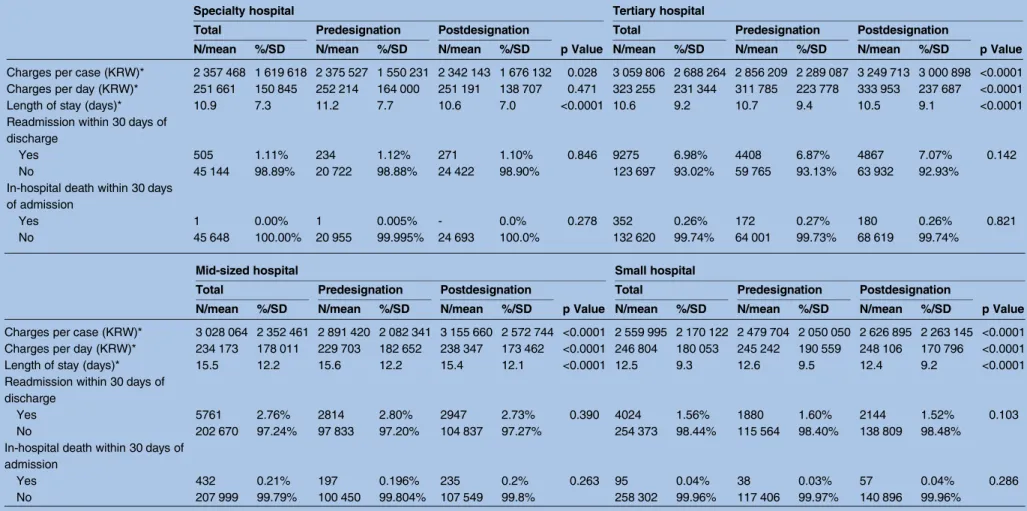
Univariate analysis of outcome variables (see table 3)
revealed that inpatient charges per case were lowest in spine specialty hospitals; however, per day charges were higher than in small and mid-sized general hospitals. LOS was 10.9 days per admission, which was comparable with tertiary research hospitals, but was much shorter
than in small and mid-sized general hospitals.
Readmission within 30 days of discharge was much lower for the spine specialty hospitals than for other hospital types. Death within 30 days of admission also was lowest in specialty hospitals; however, cases of death were very rare in all types of hospitals because spinal procedures typically are not based on life-threatening conditions. Lower charges per case, charges per day and reduced LOS were observed among specialty hospitals during the postdesignation period.
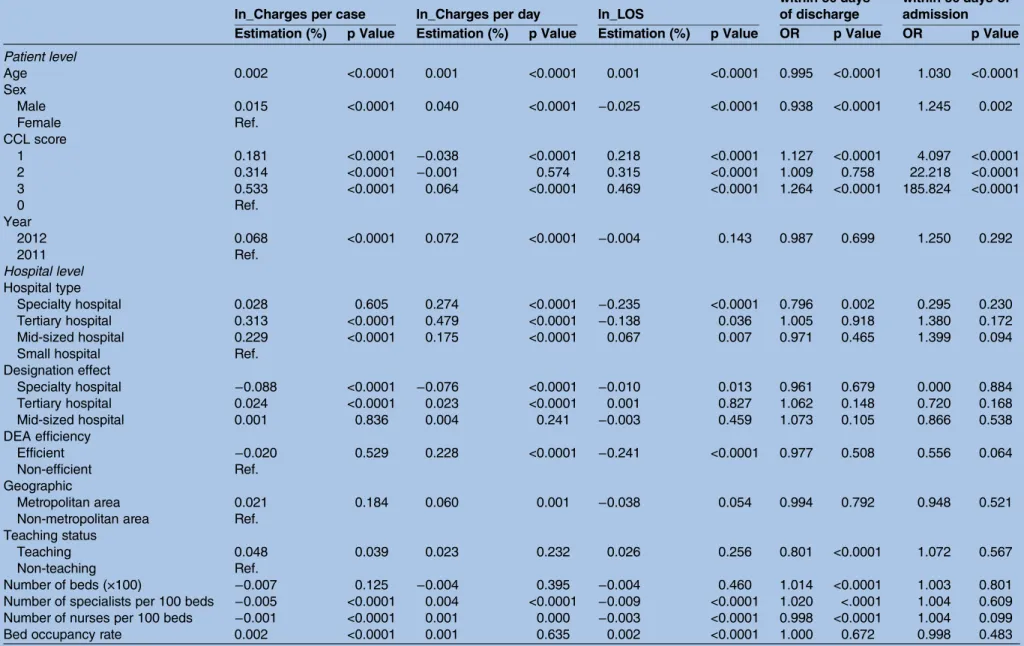
The results of our multilevel GEE regression analysis
are presented intable 4. Although spine specialty
hospi-tals had a 2.8% higher inpatient charge per case than small general hospitals, the difference was not
statistic-ally significant. An effect of the official ‘specialty’
desig-nation was found with regard to inpatient charge per case, with charges per case decreasing 8.8% after spe-cialty status was conferred. Spine spespe-cialty hospitals charged an average of 27.4% more than small general hospitals on a per-day basis, although the LOS at spine specialty hospitals was 23.5% shorter. Moreover, charges per case decreased 7.6% and LOS was reduced by 1% after specialty status was conferred. The OR of readmis-sion was OR=0.796 for the spine specialty hospitals com-pared with small general hospitals; however, the ORs of
Kim SJ,et al. BMJ Open 2014;4:e006525. doi:10.1136/bmjopen-2014-006525 3
Open Access
group.bmj.com
on December 4, 2014 - Published by
http://bmjopen.bmj.com/
Table 1 Characteristics of patients
Total Specialty hospital Tertiary hospital Mid-sized hospital Small hospital
p Value N/mean %/SD N/mean %/SD N/mean %/SD N/mean %/SD N/mean %/SD
Number of cases 645 449 45 649 7.1 132 972 20.6 208 431 32.3 258 397 40.0 Age* 52.6 19.7 55.8 15.5 47.3 23.0 53.5 20.5 54.1 17.1 <0.0001 Sex Male 292 744 45.4 20 795 45.6 62 981 47.4 98 715 47.4 110 253 42.7 <0.0001 Female 352 705 54.6 24 854 54.4 69 991 52.6 109 716 52.6 148 144 57.3 Year Predesignation 303 220 47.0 20 956 45.9 64 173 48.3 100 647 48.3 117 444 45.5 <0.0001 Postdesignation 342 229 53.0 24 693 54.1 68 799 51.7 107 784 51.7 140 953 54.5 *Volume increase in postdesignation 12.9% 17.8% 7.2% 7.1% 20.0% CCL score 0 436 621 67.6 32 190 70.5 93 631 70.4 124 595 59.8 186 205 72.1 <0.0001 1 140 158 21.7 9897 21.7 24 330 18.3 51 641 24.8 54 290 21.0 2 56 346 8.7 3114 6.8 11 974 9.0 25 939 12.4 15 319 5.9 3 12 324 1.9 448 1.0 3037 2.3 6256 3.0 2583 1.0 Procedure type Surgical 579 853 89.8 45 386 99.4 101 431 76.3 185 151 88.8 247 885 95.9 <0.0001 Medical 65 596 10.2 263 0.6 31 541 23.7 23 280 11.2 10 512 4.1 *Mean/SD.
CCL, complication or comorbidity level.
Table 2 Characteristics of hospitals
Total
Specialty
hospital Tertiary hospital
Mid-sized
hospital Small hospital
p Value N/mean %/SD N/mean %/SD N/mean %/SD N/mean %/SD N/mean %/SD
Number of hospitals* 823 17 2.1 44 5.3 267 32.4 495 60.1 Geographic Metropolitan area 439 53.3 14 82.4 33 75.0 129 48.3 263 53.1 0.001 Non-metropolitan area 384 46.7 3 17.6 11 25.0 138 51.7 232 46.9 Teaching status Teaching 149 18.1 – 0.0 44 100.0 102 38.2 3 0.6 <0.0001 Non-teaching 674 81.9 17 100.0 – 0.0 165 61.8 492 99.4 DEA efficiency Efficient 56 6.8 2 11.8 – 0.0 3 1.1 51 10.3 <0.0001 Non-efficient 767 93.2 15 88.2 44 100.0 264 98.9 444 89.7 Number of beds (×100)* 4.5 4.8 1.4 0.6 11.7 5.5 4.4 2.1 1.3 0.7 <0.0001 Number of specialists per 100 beds* 14.7 8.1 15.7 5.6 25.9 7.1 13.7 5.4 9.5 4.0 <0.0001 Number of nurses per 100 beds* 50.3 24.2 60.0 23.9 74.1 16.9 54.8 19.7 32.7 16.2 <0.0001 Bed occupancy rate* 85.2 16.9 83.0 10.5 98.7 9.1 85.5 13.6 78.5 19.1 <0.0001
*Mean/SD.
DEA, data envelopment analysis.
4 Kim SJ, et al .BMJ Open 2014; 4 :e006525. doi:10.1136/ bmjopen-20 14-006525 Ope n Ac cess group.bmj.com on December 4, 2014 - Published by http://bmjopen.bmj.com/ Downloaded from
Table 3 Univariate analysis of dependent variables by hospital types
Specialty hospital Tertiary hospital
Total Predesignation Postdesignation
p Value
Total Predesignation Postdesignation
p Value
N/mean %/SD N/mean %/SD N/mean %/SD N/mean %/SD N/mean %/SD N/mean %/SD
Charges per case (KRW)* 2 357 468 1 619 618 2 375 527 1 550 231 2 342 143 1 676 132 0.028 3 059 806 2 688 264 2 856 209 2 289 087 3 249 713 3 000 898 <0.0001 Charges per day (KRW)* 251 661 150 845 252 214 164 000 251 191 138 707 0.471 323 255 231 344 311 785 223 778 333 953 237 687 <0.0001
Length of stay (days)* 10.9 7.3 11.2 7.7 10.6 7.0 <0.0001 10.6 9.2 10.7 9.4 10.5 9.1 <0.0001
Readmission within 30 days of discharge
Yes 505 1.11% 234 1.12% 271 1.10% 0.846 9275 6.98% 4408 6.87% 4867 7.07% 0.142
No 45 144 98.89% 20 722 98.88% 24 422 98.90% 123 697 93.02% 59 765 93.13% 63 932 92.93%
In-hospital death within 30 days of admission
Yes 1 0.00% 1 0.005% - 0.0% 0.278 352 0.26% 172 0.27% 180 0.26% 0.821
No 45 648 100.00% 20 955 99.995% 24 693 100.0% 132 620 99.74% 64 001 99.73% 68 619 99.74%
Mid-sized hospital Small hospital
Total Predesignation Postdesignation
p Value
Total Predesignation Postdesignation
p Value
N/mean %/SD N/mean %/SD N/mean %/SD N/mean %/SD N/mean %/SD N/mean %/SD
Charges per case (KRW)* 3 028 064 2 352 461 2 891 420 2 082 341 3 155 660 2 572 744 <0.0001 2 559 995 2 170 122 2 479 704 2 050 050 2 626 895 2 263 145 <0.0001 Charges per day (KRW)* 234 173 178 011 229 703 182 652 238 347 173 462 <0.0001 246 804 180 053 245 242 190 559 248 106 170 796 <0.0001
Length of stay (days)* 15.5 12.2 15.6 12.2 15.4 12.1 <0.0001 12.5 9.3 12.6 9.5 12.4 9.2 <0.0001
Readmission within 30 days of discharge
Yes 5761 2.76% 2814 2.80% 2947 2.73% 0.390 4024 1.56% 1880 1.60% 2144 1.52% 0.103
No 202 670 97.24% 97 833 97.20% 104 837 97.27% 254 373 98.44% 115 564 98.40% 138 809 98.48%
In-hospital death within 30 days of admission Yes 432 0.21% 197 0.196% 235 0.2% 0.263 95 0.04% 38 0.03% 57 0.04% 0.286 No 207 999 99.79% 100 450 99.804% 107 549 99.8% 258 302 99.96% 117 406 99.97% 140 896 99.96% *Mean/SD. Kim SJ, et al .BMJ Open 2014; 4 :e006525. doi:10.1 136/bmjopen-2014-0065 25 5 Open Acces s group.bmj.com on December 4, 2014 - Published by http://bmjopen.bmj.com/ Downloaded from
Table 4 Multilevel GEE regression analysis of inpatient charges per case, inpatient charges per day, LOS, readmission and mortality
ln_Charges per case ln_Charges per day ln_LOS
Readmission within 30 days of discharge In-hospital death within 30 days of admission Estimation (%) p Value Estimation (%) p Value Estimation (%) p Value OR p Value OR p Value Patient level Age 0.002 <0.0001 0.001 <0.0001 0.001 <0.0001 0.995 <0.0001 1.030 <0.0001 Sex Male 0.015 <0.0001 0.040 <0.0001 −0.025 <0.0001 0.938 <0.0001 1.245 0.002 Female Ref. CCL score 1 0.181 <0.0001 −0.038 <0.0001 0.218 <0.0001 1.127 <0.0001 4.097 <0.0001 2 0.314 <0.0001 −0.001 0.574 0.315 <0.0001 1.009 0.758 22.218 <0.0001 3 0.533 <0.0001 0.064 <0.0001 0.469 <0.0001 1.264 <0.0001 185.824 <0.0001 0 Ref. Year 2012 0.068 <0.0001 0.072 <0.0001 −0.004 0.143 0.987 0.699 1.250 0.292 2011 Ref. Hospital level Hospital type Specialty hospital 0.028 0.605 0.274 <0.0001 −0.235 <0.0001 0.796 0.002 0.295 0.230 Tertiary hospital 0.313 <0.0001 0.479 <0.0001 −0.138 0.036 1.005 0.918 1.380 0.172 Mid-sized hospital 0.229 <0.0001 0.175 <0.0001 0.067 0.007 0.971 0.465 1.399 0.094 Small hospital Ref.
Designation effect Specialty hospital −0.088 <0.0001 −0.076 <0.0001 −0.010 0.013 0.961 0.679 0.000 0.884 Tertiary hospital 0.024 <0.0001 0.023 <0.0001 0.001 0.827 1.062 0.148 0.720 0.168 Mid-sized hospital 0.001 0.836 0.004 0.241 −0.003 0.459 1.073 0.105 0.866 0.538 DEA efficiency Efficient −0.020 0.529 0.228 <0.0001 −0.241 <0.0001 0.977 0.508 0.556 0.064 Non-efficient Ref. Geographic Metropolitan area 0.021 0.184 0.060 0.001 −0.038 0.054 0.994 0.792 0.948 0.521 Non-metropolitan area Ref.
Teaching status
Teaching 0.048 0.039 0.023 0.232 0.026 0.256 0.801 <0.0001 1.072 0.567 Non-teaching Ref.
Number of beds (×100) −0.007 0.125 −0.004 0.395 −0.004 0.460 1.014 <0.0001 1.003 0.801 Number of specialists per 100 beds −0.005 <0.0001 0.004 <0.0001 −0.009 <0.0001 1.020 <.0001 1.004 0.609 Number of nurses per 100 beds −0.001 <0.0001 0.001 0.000 −0.003 <0.0001 0.998 <0.0001 1.004 0.099 Bed occupancy rate 0.002 <0.0001 0.001 0.635 0.002 <0.0001 1.000 0.672 0.998 0.483
Each model was adjusted by diagnosis and procedure codes.
DEA, data envelopment analysis; GEE, generalised estimating equation; LOS, length of stay.
6 Kim SJ, et al .BMJ Open 2014; 4 :e006525. doi:10.1136/ bmjopen-20 14-006525 Ope n Ac cess group.bmj.com on December 4, 2014 - Published by http://bmjopen.bmj.com/ Downloaded from
mortality were not statistically significant. This
‘designa-tion effect’ was not noted for either readmission or
mor-tality outcome. Efficient hospitals were more likely to
follow the trend of spine specialty hospitals in terms of charging and LOS. Males were associated with higher charges per case and per day, but shorter LOS. Patients with higher CCL scores had higher charges per case and longer LOS. Hospitals located in metropolitan areas had higher charges per case and shorter LOS. Teaching
hos-pitals had higher charges per case but no significant
dif-ference in charge per day or LOS when compared with non-teaching hospitals. Hospital structural factors also were associated with outcome variables; however, the effects were minimal.
DISCUSSION
In this study, we investigated the performance and ef
fi-ciency of spine specialty hospitals versus general
hospi-tals and examined the effect of ‘specialty’ hospital
designation on hospital operating efficiency. Our data
set included spine specialty hospital designation criteria and nationwide inpatient claims in South Korea. Our univariate results showed that charges per inpatient case were lower and LOS were much shorter for specialty hospitals; however, per day charges were higher than other hospitals with the exception of tertiary hospitals. The results of multivariate analysis, after adjusting for patient-level and hospital-level confounders, showed that while spine specialty hospital charges on a per case basis were similar to those of small general hospitals, the per day charges were 27.4% higher; however, the higher per day charge was balanced by 23.5% shorter LOS.
Following ‘specialty’ hospital designation, inpatient
charges per case declined by 6.6%, because of shorter LOS (1.0%) and lower per day charges (7.6%) than general hospitals of comparable size.
Although this study considered only short-term effects
of the ‘specialty’ designation, spine specialty hospitals
appeared to be motivated to reduce their charges. This effect suggests that spine specialty hospitals increased
their efficiencies because of their spine specialisation
and resulting positive volume outcome relationship.23 24
Therefore, these hospitals were able to reduce overall
costs and charge less than other hospitals. This finding
also indicates that the ‘specialty hospital’ designation
influenced spine specialty hospitals to reduce the
finan-cial burden on their patients.
Our findings also revealed that specialty hospitals had
much shorter LOS for each spine inpatient. This result supports the premise that specialty hospital physicians have more experience due to their sheer volume, which
also allows the specialty hospital to emphasise efficiency
by reducing LOS. Shorter LOS for the specialty hospitals was superior to small, mid-sized general hospitals and also was better than tertiary hospitals. However, higher per day charges indicated that specialty hospitals ensure financial viability via high volume and bed turnover. In
order to be designated a specialty hospital in Korea, an institution must meet strict institutional requirements, including having a certain number of beds and physicians in addition to operating a specialty medical service department. This process requires a substantial invest-ment by the institution. Since no additional
reimburse-ments or financial subsidies for specialty hospitals exist,
this might only be a marketing strategy, ensuring the
insti-tution’s financial viability by increasing its efficiency. In
addition, the results of our study also provide empirical
research confirming the arguments of opponents of
spe-cialty hospitals, who contend that spespe-cialty hospitals may
provide healthcare services at greater profit or cherry
pick patients more than traditional hospitals.6 17 18 20
A higher proportion of low CCL patients and surgery rate may support propositions of opponents.
Furthermore, specialty hospitals are most commonly located in metropolitan areas and therefore incur high rent, payroll and other operating costs. Therefore, the overall operating costs for specialty hospitals are often higher than those for hospitals that are located in
non-metropolitan areas.25 This demographic would suggest
that specialty hospitals offset their high operating costs by charging more per day for a shorter LOS, thus increasing patient volume and bed turnover. DEA results also indi-cated that in order for hospitals to achieve operational
efficiency, they might have shorter LOS (24.1%) and
higher charge per day (22.8%) than non-efficient
hospi-tals, although charge per case is similar. Thisfinding
sup-ports the trend observed for higher specialty hospital
efficiency with regard to patient charges and LOS.
Comparing quality measures between specialty hospi-tals and small general hospihospi-tals of similar size, readmis-sion within 30 days of discharge was 20% lower (OR=0.796) in spine specialty hospitals but was similar to larger hospitals (mid-sized, tertiary hospitals). This quality measure might be better in spine specialty hospi-tals because of their higher patient volume and much vaster medical experience in the area of spine disease.
However, we did not find any association with mortality
within 30 days of admission to spine specialty hospitals. We would expect very few cases of mortality among all types of hospitals since spine disease procedures typically are not life-threatening. Of note, our study was only able to evaluate in-hospital mortality, which might underesti-mate actual mortality cases.
This study has several limitations worth considering; therefore, the results must be interpreted with caution. The potential limitation of our study involves our
measure-ment of the effect of‘specialty’ designation status. Because
of the relatively recent establishment of the specialty hos-pital designation system (1 November 2011), there has not
been sufficient time to thoroughly investigate the effects of
the‘specialty’ designation on hospital operating efficiency.
Additional studies using more robust data sets should be performed to better inform long-term policy on spine spe-cialty hospitals. Furthermore, this study may not fully adjust case-mix adjustment, although the analysis models
Kim SJ,et al. BMJ Open 2014;4:e006525. doi:10.1136/bmjopen-2014-006525 7
Open Access
group.bmj.com
on December 4, 2014 - Published by
http://bmjopen.bmj.com/
include current diagnosis and procedure code, due to the nature of claims data. In addition, we did not have access to information about non-NHI covered procedures, which is important because non-covered services are typical in spine-related procedures. Our study also lacked patient sat-isfaction records or socioeconomic status data that may have affected the results of our study.26
The other limitation was the inability to analyse
hos-pitalfinancial performance. Because we did not include
institutions’ financial statements or costs, it was not
pos-sible to examine the real financial viability of hospitals.
Therefore, the actual revenue, costs, profit and financial
viability and their possible impact on our results remain unknown.
Although our study involved only spine-related inpatient claim data, it represents, to the best of our knowledge, one of only a few studies to evaluate the performance and characteristics of specialty hospitals in this country and outside the USA as well. Our conclusions add to the
mounting evidence about the greater efficiency and cost
benefits of specialty hospitals; these results contribute to
the reasoning for designing‘specialty’ designation
require-ments and implementing specialty hospital systems in a health policy perspective. In order to strengthen the
reli-ability and generalisreli-ability of our findings, additional
studies investigating the effect of ‘specialty’ designation
status over a longer time frame are needed.
CONCLUSION
In conclusion, our study showed that spine specialty hos-pitals have higher per day inpatient charges and much shorter LOS than other types of hospitals due to their specialty volume and experience. Specialty hospitals
endeavour to be more efficient after governmental
‘spe-cialty’ designation. In addition, the patient readmission
rate was lower for specialty hospitals than general hospi-tals. To promote a successful specialty hospital system, a broader discussion that includes patient satisfaction and the real cost of care should be initiated.
Author affiliations
1Department of Public Health, Yonsei University College of Medicine, Seoul, South Korea
2Institute of Health Services Research, Yonsei University College of Medicine, Seoul, South Korea
3Department of Medicine, University of Wisconsin School of Medicine and Public Health, Milwaukee, Wisconsin, USA
4Center for Senior Health and Longevity, Aurora Health Care, Milwaukee, Wisconsin, USA
5Department of Hospital Administration, Graduate School of Public Health, Yonsei University, Seoul, South Korea
6Department of Preventive Medicine, Yonsei University College of Medicine, Seoul, South Korea
Contributors SJK designed the study, researched data, performed statistical analyses and wrote the manuscript. JWY, SGL, THK, K-TH and E-CP contributed to the discussion, and reviewed and edited the manuscript. E-CP is the guarantor.
Competing interests None.
Provenance and peer review Not commissioned; externally peer reviewed.
Data sharing statement No additional data are available.
Open Access This is an Open Access article distributed in accordance with the Creative Commons Attribution Non Commercial (CC BY-NC 4.0) license, which permits others to distribute, remix, adapt, build upon this work non-commercially, and license their derivative works on different terms, provided the original work is properly cited and the use is non-commercial. See: http:// creativecommons.org/licenses/by-nc/4.0/
REFERENCES
1. OECD. OECD reviews of health care quality. OECD Publishing, 2012.
2. Kwon S. Payment system reform for health care providers in Korea. Health Policy Plan 2003;18:84–92.
3. Lee KS, Chun KH, Lee JS. Reforming the hospital service structure to improve efficiency: urban hospital specialization. Health Policy 2008;87:41–9.
4. Ministry of Health and Welfare. http://stat.mw.go.kr [In Korean]. 5. Kim J. Hospital performance and their foster plan. Seoul: Korean
Institute of Hospital Management, 2005.
6. Iglehart JK. The emergence of physician-owned specialty hospitals. N Engl J Med 2005;352:78–84.
7. Carey K, Burgess JF Jr, Young GJ. Specialty and full-service hospitals: a comparative cost analysis. Health Serv Res 2008;43:1869–87.
8. Al-Amin M, Zinn J, Rosko MD, et al. Specialty hospital market proliferation: strategic implications for general hospitals. Health Care Manage Rev 2010;35:294–300.
9. Barro JR, Huckman RS, Kessler DP. The effects of cardiac specialty hospitals on the cost and quality of medical care. J Health Econ 2006;25:702–21.
10. Mitchell JM. Utilization changes following market entry by physician-owned specialty hospitals. Med Care Res Rev 2007;64:395–415.
11. Swartzmeyer S, Killoran C. Specialty hospital ban was premature. Studies would have shown whether those facilities help or harm healthcare. Mod Healthc 2004;34:21.
12. Herzlinger R. Specialty Hospitals, Ambulatory Surgery Centers, and General Hospitals: Charting a Wise Public Policy. Conference held on September 10; Washington DC. Waltham, MA: Council on Health Care Economics and Policy, 2004.
13. Porter ME, Teisberg EO. Redefining competition in health care. Harv Bus Rev 2004;82:64–76, 136.
14. Casalino LP, Devers KJ, Brewster LR. Focused factories? Physician-owned specialty facilities. Health Aff 2003;22:56–67. 15. Medicare Payment Advisory Commission. Report to the Congress:
physician-owned specialty hospitals, 2005.
16. United States General Accounting Office. Specialty hospitals: geographic location, services provided, and financial peformance. Washington DC: 2003.
17. Moore K, Coddington D. Specialty hospital rise could add to full-service hospital woes. Healthc Financ Manage 2005;59:84. 18. Nallamothu BK, Rogers MA, Chernew ME, et al. Opening of
specialty cardiac hospitals and use of coronary revascularization in medicare beneficiaries. JAMA 2007;297:962–8.
19. Kahn CN III. Intolerable risk, irreparable harm: the legacy of physician-owned specialty hospitals. Health Aff (Millwood) 2006;25:130–3.
20. American Hospital Association. Impact of limited-service providers on communities and full-service hospitals trendwatch. Trendwatch 2004;6:1–8.
21. Korean Hospital Association. Hospital Management Statistics. 2011. 22. Charnes A, Clark CT, Cooper W, et al. A developmental study of
data envelopment analysis in measuring the efficiency of maintenance units in the US air forces. Ann Oper Res 1984;2:95–112.
23. Tsugawa Y, Kumamaru H, Yasunaga H, et al. The association of hospital volume with mortality and costs of care for stroke in Japan. Med Care 2013;51:782–8.
24. Coté GA, Imler TD, Xu H, et al. Lower provider volume is associated with higher failure rates for endoscopic retrograde
cholangiopancreatography. Med Care 2013;51:1040–7.
25. Kim SJ, Park EC, Jang SI, et al. An analysis of the inpatient charge and length of stay for patients with joint diseases in Korea: specialty versus small general hospitals. Health Policy 2013;113:93–9. 26. Perelman J, Closon MC. Impact of socioeconomic factors on
in-patient length of stay and their consequences in per case hospital payment systems. J Health Serv Res Policy 2011;16:197–202.
8 Kim SJ,et al. BMJ Open 2014;4:e006525. doi:10.1136/bmjopen-2014-006525
Open Access
group.bmj.com
on December 4, 2014 - Published by
http://bmjopen.bmj.com/
in Korea
and designation effects: a longitudinal study
hospitals, their characteristics, performance
Governmental designation of spine specialty
and Eun-Cheol Park
Sun Jung Kim, Ji Won Yoo, Sang Gyu Lee, Tae Hyun Kim, Kyu-Tae Han
doi: 10.1136/bmjopen-2014-006525
2014 4: BMJ Open
http://bmjopen.bmj.com/content/4/11/e006525
Updated information and services can be found at:
These include:
References
#BIBL http://bmjopen.bmj.com/content/4/11/e006525
This article cites 19 articles, 5 of which you can access for free at:
Open Access
http://creativecommons.org/licenses/by-nc/4.0/ non-commercial. See:
provided the original work is properly cited and the use is
non-commercially, and license their derivative works on different terms, permits others to distribute, remix, adapt, build upon this work
Commons Attribution Non Commercial (CC BY-NC 4.0) license, which This is an Open Access article distributed in accordance with the Creative
service
Email alerting
box at the top right corner of the online article.
Receive free email alerts when new articles cite this article. Sign up in the
Collections
Topic
Articles on similar topics can be found in the following collections (516)Health services research (252) Health policy
Notes
http://group.bmj.com/group/rights-licensing/permissions
To request permissions go to:
http://journals.bmj.com/cgi/reprintform
To order reprints go to:
http://group.bmj.com/subscribe/ To subscribe to BMJ go to: group.bmj.com on December 4, 2014 - Published by http://bmjopen.bmj.com/ Downloaded from